They did it! Today, after a long slog of debate, the US Senate has finally passed a bipartisan version of the infrastructure bill that came out of the American Jobs Plan the Biden administration proposed in April.
For more information on the original proposal, see my April 6, 2021 blog:
In Tables 1-3, I have highlighted the entries that can be associated with climate change, and which I will speak to specifically in future blogs. Of course, the whole effort addresses a multitude of overlapping issues; none of the items can be exclusively associated with one of the entries of my earlier Venn diagram. Rounding up from the sum of the estimated costs for all of the entries, we come to $1.9 trillion. With the addition of the $400 billion for in-home care, we reach the plan’s quoted $2.3 trillion. The sum of the highlighted, climate-related items comes to $1.35 trillion, 70% of the total cost.
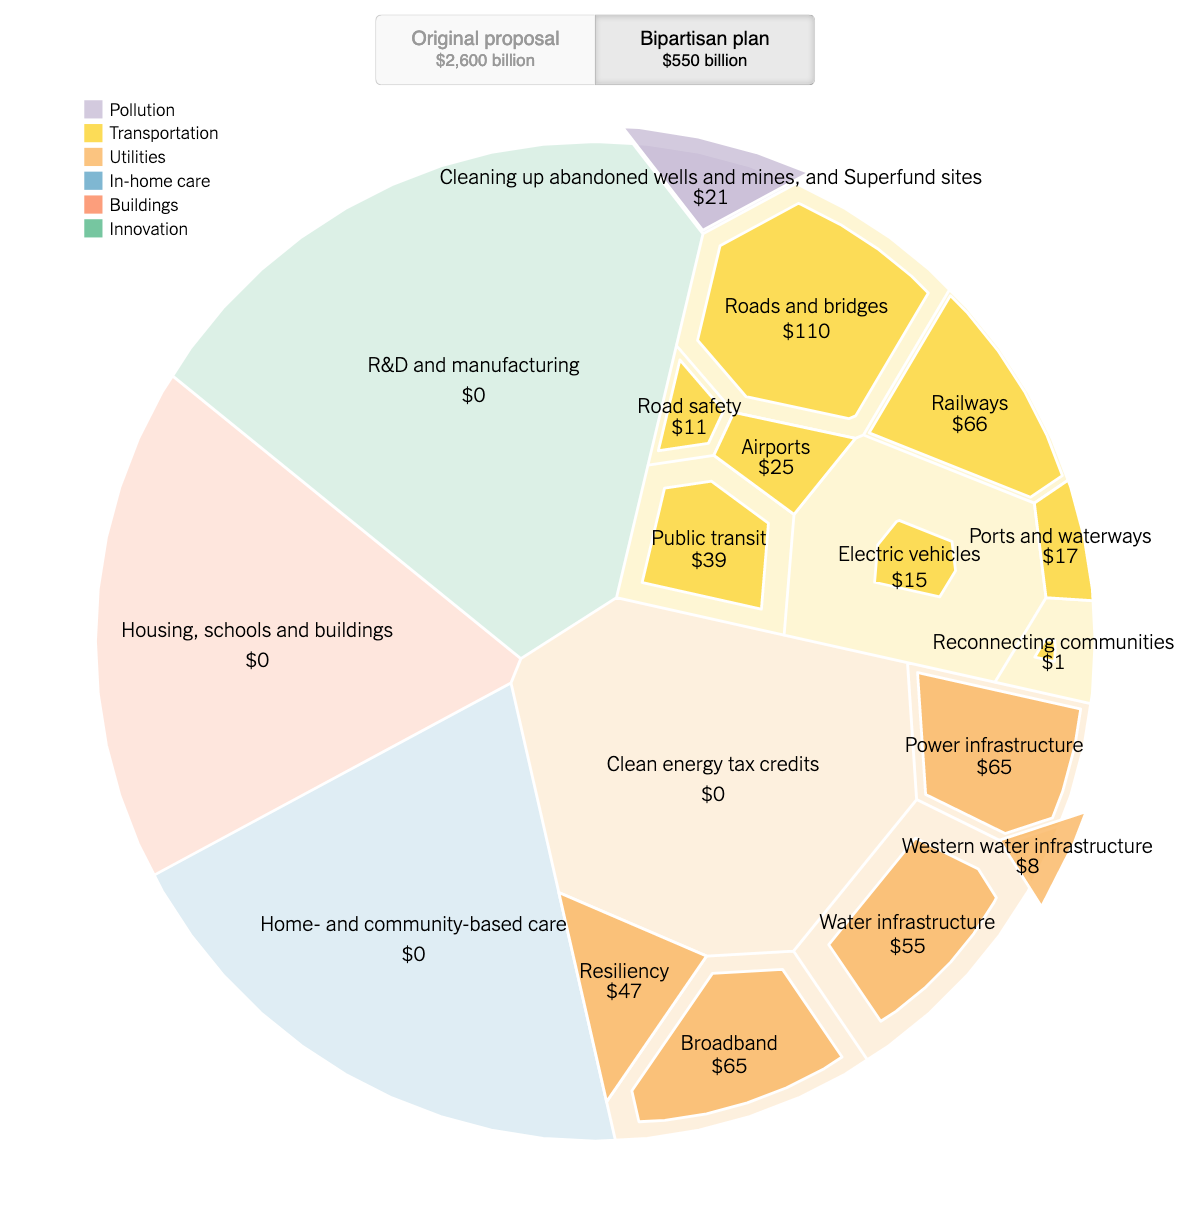
The New York Times published an article about the relationship between the American Jobs Plan and the new infrastructure plan, which also looked at the changes between the original and the current versions of the plan and included the graphic below.

Figure 1
At 2,702 pages, this infrastructure bill is the largest such bill in American history. It was released Sunday evening (August 1st).
As we can see from Figure 1, while roughly half of the original bill tackled climate change, the new version has eliminated nearly all of those measures. That said, we don’t have to despair just yet. The Biden administration seems to be repackaging the proposals separately, aiming to pass as many as possible through the very balanced but incredibly partisan Congress. R&D and Manufacturing was a significant category of the climate-related legislation in the old proposal. In June, the US Senate passed a separate major bill, the United States Innovation and Competition Act of 2021 (see my June 15, 2021 blog, “Sputnik and China”), almost unanimously. Although this particular legislation was designed to counter China, an in-depth examination shows that many of the proposed activities will relate to climate change. The same, I’d argue, is true of the new infrastructure proposal, even in its current, gutted form: as long as this particular climate action-dedicated executive branch is in charge of coordinating these activities, that priority will be visible during implementation.
This is not necessarily true for the other important theme of the original proposal: the social element. Some have labeled that element, which mainly focused on equity in its many forms, “soft” infrastructure. The Republicans (and some key Democrats) refuse to cooperate on these measures. They argue that tackling these issues will inject too much money into the market at once and trigger uncontrollable inflation.
The Democrats are planning to pursue a $3 trillion independent effort that they hope to be able to pass on their own, through a process known as “budget reconciliation.” The danger here is that the House Democrats are threatening not to even bring either of the bills I mentioned above to a vote, even though the Senate has reached bipartisan agreements and the White House has endorsed the compromises. In other words, so far, none of the legislative activities is secured.
In the context of mitigation and adaptation of anthropogenic climate change, these activities still lack an examination of the impacts that will come from our energy transition away from fossil fuel dependence.
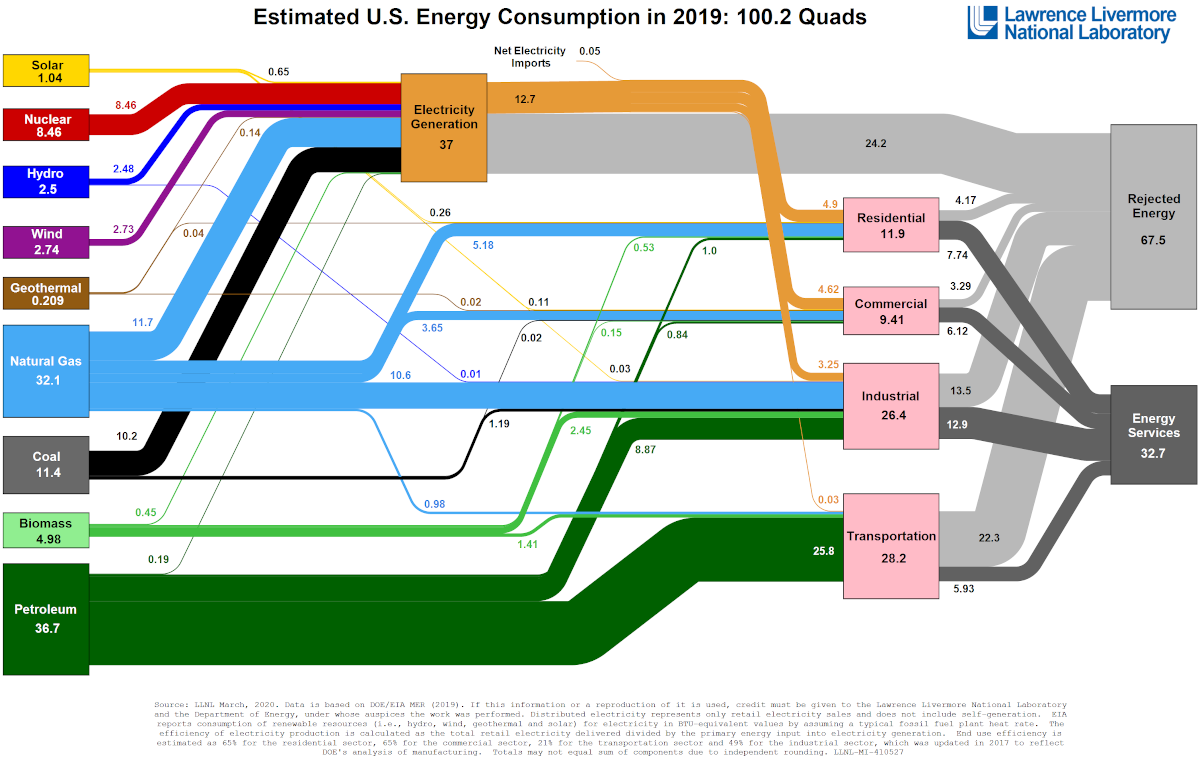
Figure 2 shows the outline of US energy use in 2019, as constructed by Visual Capitalist, based on data from the Lawrence Livermore National Laboratory. The units of energy used throughout are quads. For reference, here’s an approximate conversion:
1quad = 1×10¹⁵BTU = 1×10¹⁸Joules ≈ energy in 8 billion gallons of gasoline
On the left-hand side of Figure 2, we have the energy sources, 80% of which are fossil fuels. To decarbonize the system, we need to eliminate all fossil fuels from the input, and/or capture the carbon dioxide in the air, which we are not currently doing in any significant way.

Figure 2 – Composite energy use in the US – 2019
Breaking down the distribution of the energy above, we find that:
37 quads from the input are going to the production of electricity
28.2 quads are going to petroleum use in transportation.
24.2 quads from the production of electricity are waste energy (marked as rejected energy) or heat that depends on the temperature that we are using in the energy conversion process.
In a previous blog (October 22, 2019), I discussed the limits of the efficiency of producing electricity from primary energy sources. These limits are fundamental and are an expression of the Second Law of Thermodynamics, a key aspect of physics with an unwieldy name. This law applies not only to electricity but also to any process that involves the conversion of heat to work (i.e., in physics, anything useful). Figure 2 describes everything useful that we get out of energy and lumps them all into “energy services.” Out of approximately 100 quads of energy input, we get a mere 32.7 quads of energy services. The total efficiency of this process is 32.7%, an efficiency that is critically dependent on the temperature of the conversion.
We have three ways to decrease the carbonization of our energy use:
- Decrease the number of our energy services
- Decrease the number of fossil fuels that we use and replace them with sustainable energy sources (defined here as primary energy that does not emit carbon dioxide) as much as possible
- Increase the efficiency of the conversion by increasing the temperature of the conversion
As we saw in an earlier blog (October 15, 2019), the most important strategy taking place in the energy transition right now is the shift to electricity from direct use of primary energy sources. Three of the four components of the energy services shown in Figure 2 already have major electrical contributions. The only sector with minimal electrical contributions is transportation. Presently (2019), transportation uses 28.2 quads of energy, 22.3 quads of which are wasted as (mostly exhaust) emissions. President Biden set a goal for 50% of new cars to be electric by 2030. However, electric cars are only as low carbon as the sources of their energy (see my March 19, 2019 blog for a description of the shift to electric cars). So, before we can create a carbon-free economy, we’ll need carbon-free electricity.
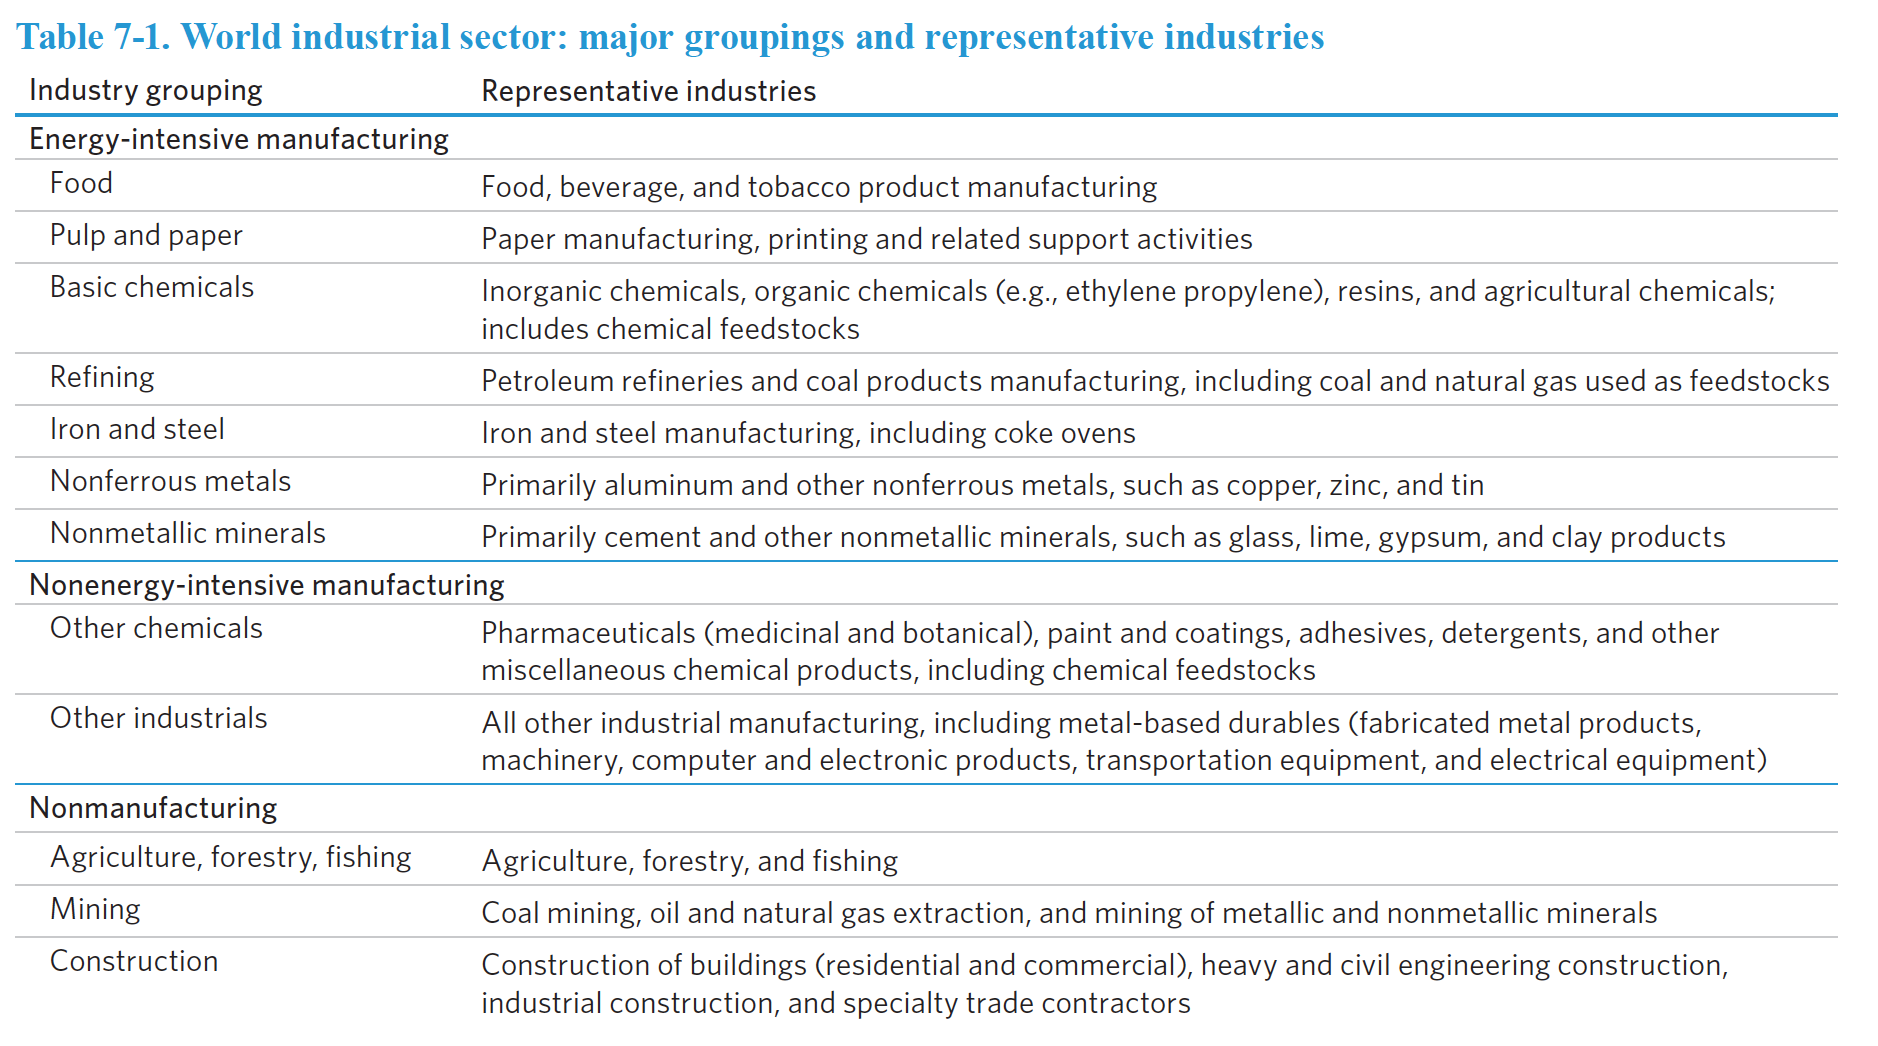
Figure 2 includes the industrial and commercial sectors in its breakdown of energy services. Table 1 gives a list of examples of energy use in the industrial sector:
Table 1 – Examples of industrial sector energy use

A revolution is now taking place, aiming not only to decarbonize this sector but make it fully sustainable, part of the “cyclical economy.” Due to the Second Law of Thermodynamics that I mentioned earlier, the energy part of this sector cannot be reused, but the chemical part can. A piece in The New York Times provides a good summary, with a few examples:
For the past few years, a number of start-ups have begun developing products that aim to fold in carbon dioxide captured from smokestacks and other sources of pollution, in an attempt to reach a new level of environmentally friendly manufacturing: one in which greenhouse-gas molecules are not only kept out of the atmosphere but also repurposed. This undertaking, usually characterized as carbon utilization, goes well beyond flooring — to plastics, jet fuels, diesel, chemicals, building materials, diamonds, even fish food.
Advocates of carbon utilization, or carbontech, as it’s also known, want to remake many of the things we commonly use today. But with one crucial difference: No emissions would have been added to the environment through their fabrication. Carbontech sees a future where the things we buy might be similar in their chemistries and uses but different in their manufacture and environmental impact. You might wake in the morning on a mattress made from recycled CO2 and grab sneakers and a yoga mat made from CO2-derived materials. You might drive your car — with parts made from smokestack CO2 — over roads made from CO2-cured concrete. And at day’s end, you might sip carbontech vodka while making dinner with food grown in a greenhouse enriched by recycled CO2. Many of these items would most likely be more expensive to the consumer than their usual counterparts, in part because they often need significant amounts of energy to make. But the hurdles to making them are no longer insurmountable.
As for the commercial sector, most energy use relates to the day-to-day running of a wide variety of buildings in the following categories:
The top five energy-consuming building categories used about half of the energy consumed by all commercial buildings in 2012, and they include the following types of buildings:
- Mercantile and service (15% of total energy consumed by commercial buildings)
- Malls and stores
- Car dealerships
- Dry cleaners
- Gas stations
- Office(14% of consumption)
- Professional and government offices
- Banks
- Education(10% of consumption)
- Elementary, middle, and high school
- Colleges
- Health care(8% of consumption)
- Hospitals
- Medical offices
- Lodging(6% of consumption)
- Hotels
- Dormitories
- Nursing homes
Last updated: September 28, 2018
It will be interesting to see how we do in decarbonizing these sectors, whether via legislative intervention, advances in technology, commercial competition, or a combination of these factors. Here’s hoping the House can keep the forward momentum of the Senate’s new legislation.
