
Last week’s blog was focused on the observations that private insurance companies are now running away from insuring for natural disasters, mainly because they lose money in this business. It was mentioned there that Florida, having its share of these disasters, confronted this issue by spreading the burden among all its citizens, instituting what some call a “hurricane tax.” This blog is trying to address the issue of the role of the federal government in insuring against disasters.
As was mentioned in last week’s blog, we are now seeing an acceleration in both the frequency and costs of such disasters:
By NOAA’s tally, the events so far this year have caused 253 direct and indirect fatalities and produced more than $57.6 billion in damage — a figure that probably will rise as officials continue to document losses from Tropical Storm Hilary in Southern California and drought that persisted across parts of the Midwest and South.
The acceleration is not confined to the US. The largest recent impact was probably observed in Libya, where the Mediterranean storm Daniel almost wiped out the eastern Libyan city of Derma (125,000 inhabitants). By the time I wrote this blog on Friday, the number of deaths in Libya exceeded 10,000, with many still missing:
Spokesperson of the interior ministry Lieutenant Tarek al-Kharraz on Wednesday told the AFP news agency that 3,840 deaths had been recorded in the Mediterranean city so far, including 3,190 who have already been buried. Among them were at least 400 foreigners, mostly from Sudan and Egypt.
Meanwhile, Hichem Abu Chkiouat, minister of civil aviation in the administration that runs eastern Libya, told the Reuters news agency more than 5,300 dead had been counted so far, and said the number was likely to increase significantly and might even double.
Derna Mayor Abdulmenam al-Ghaithi told Saudi-owned Al Arabiya television the estimated number of deaths in the city could reach between 18,000 to 20,000 based on the number of districts destroyed by the flood.
In the US, the federal responsibility for providing support rests on the shoulders of FEMA (Federal Emergency Administration Agency). Below is some background from Wikipedia that summarizes the role and history of this agency:
The Federal Emergency Management Agency (FEMA) is an agency of the United States Department of Homeland Security (DHS), initially created under President Jimmy Carter by Presidential Reorganization Plan No. 3 of 1978 and implemented by two Executive Orders on April 1, 1979.[1] The agency’s primary purpose is to coordinate the response to a disaster that has occurred in the United States and that overwhelms the resources of local and state authorities. The governor of the state in which the disaster occurs must declare a state of emergency and formally request from the President that FEMA and the federal government respond to the disaster. The only exception to the state’s gubernatorial declaration requirement occurs when an emergency or disaster takes place on federal property or to a federal asset—for example, the 1995 bombing of the Alfred P. Murrah Federal Building in Oklahoma City, Oklahoma, or the Space Shuttle Columbia in the 2003 return-flight disaster.
While on-the-ground support of disaster recovery efforts is a major part of FEMA’s charter, the agency provides state and local governments with experts in specialized fields, funding for rebuilding efforts, and relief funds for infrastructure development by directing individuals to access low-interest loans, in conjunction with the Small Business Administration. In addition to this, FEMA provides funds for response personnel training throughout the United States as part of the agency’s preparedness effort.
In a recent series of reviews, the Brookings Institute examined the effectiveness of FEMA, concluding with some suggestions for improvements. Below, I will focus on the second and third of these posts. The second post focuses on the extent of the current working of FEMA. The present dynamics are shown in Figure 1 and the recent history of the support that went through FEMA is shown in Figure 2.
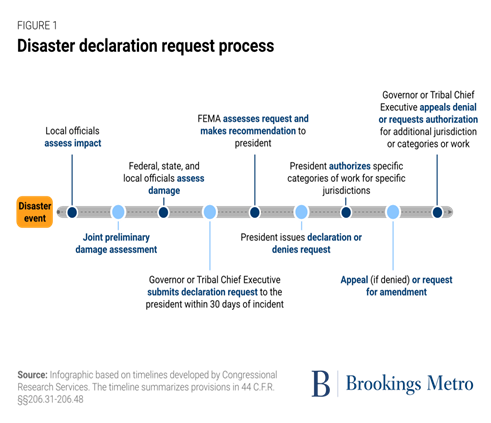
Figure 1 – The FEMA process (Source: Brookings Institute)
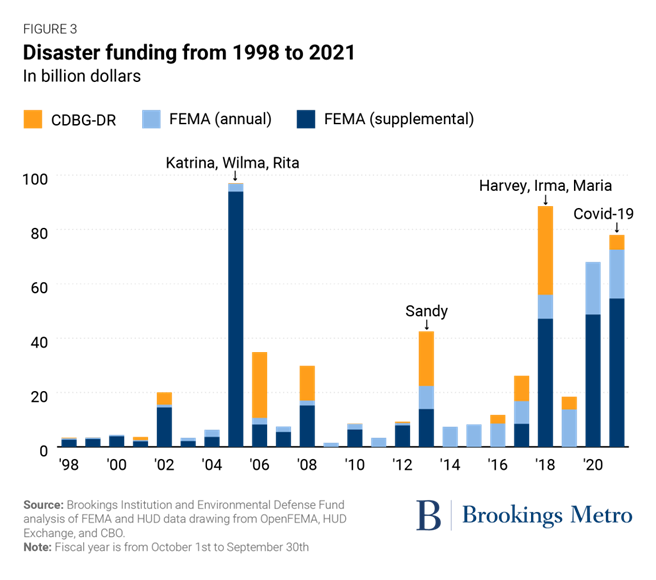
Figure 2 – Recent history of disaster funding in the US (CDBG-DR- Community Development Block Grant – Disaster Recovery) (Source: Brookings Institute)
The third post shows the complexities of the present system and ends with some suggestions for improvements. Figure 3 shows the details of these complexities:
The current federal disaster management structure is labyrinthian: Five “mission area frameworks” spread across 32 “core capabilities” that involve dozens of federal programs in multiple cabinet and non-cabinet agencies, each with its own support function and coordinating role.
On the FEMA website, the five planning frameworks mentioned above are: prevention, protection, mitigation, response, and disaster recovery.
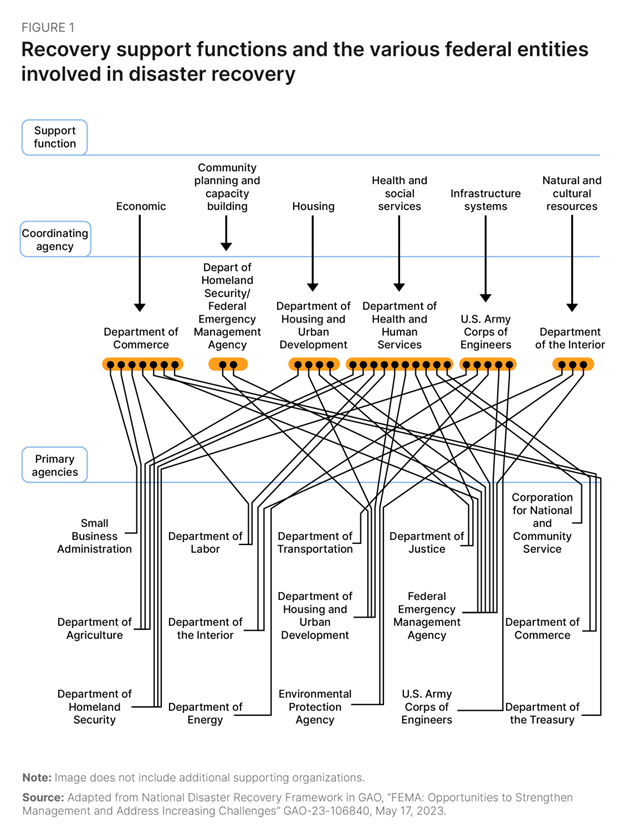
Figure 3 – the many federal entities involved in disaster funding
Some of the reasons for these complexities are summarized below:
There are many reasons for this complicated structure. First, each program’s remit is defined in statute, and incremental reforms and layering of processes have resulted in a behemoth of bureaucracy. For example, CDBG-DR is defined by the statutes associated with the 1974 CDBG program for urban development projects—not disaster recovery. The role and mission of each agency is defined by Congress, working through multiple legislative subcommittees that handle authorization, oversight, and appropriations. Generally, the programs were not defined with a holistic vision for federal disaster policy, let alone an integrated knowledge of the implementation challenges associated with each federal function relevant to disasters.
Political instabilities are primary triggers for government inabilities to help with any kind of disaster, additionally accelerating damage by failing to mitigate or adapt to probable future disasters. This is true not only for countries with their own federal structures but also internationally, when disasters strike poor countries that have serious difficulties helping themselves. This is visible in the latest disaster in Libya, where animosities between the country’s eastern, military government and western, internationally recognized government, have frozen the county for the last 10 years, preventing maintenance and ultimately leading to the collapse of the two dams. The ensuing floods were largely responsible for the destruction of Derma and the resulting deaths of thousands.
In the US, a similar political contest is now threatening to freeze government funding:
The new fiscal year (FY) begins on October 1, 2023, and Congress has so far enacted none of the 12 appropriations bills setting discretionary spending levels. Lawmakers have until midnight on the final day of the fiscal year – September 30 – to enact legislation to fund the programs covered by the appropriations process, or the government will shut down. A continuing resolution (CR) to allow lawmakers more time to complete work on spending bills is likely to be considered. A shutdown in FY 2024 would affect all federal activities covered by discretionary appropriations, as opposed to the most recent FY 2019 shutdown that began in late 2018 and extended into early 2019 that affected only departments and agencies covered by the seven appropriations bills that Congress had not yet enacted.
The funding freeze will put a stop to supplemental financing of FEMA. That will prevent the agency from helping with recent disaster areas in Hawaii and Florida, as well as stopping any help to Libya, Morocco, Ukraine, and whatever comes next.
 (Source:
  Figure 1 – Above-ground high-power lines in the Netherlands
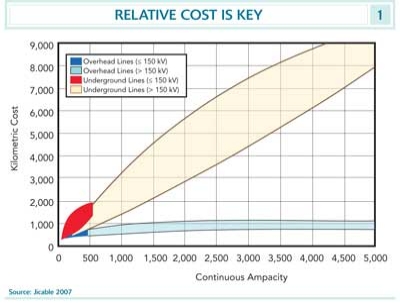
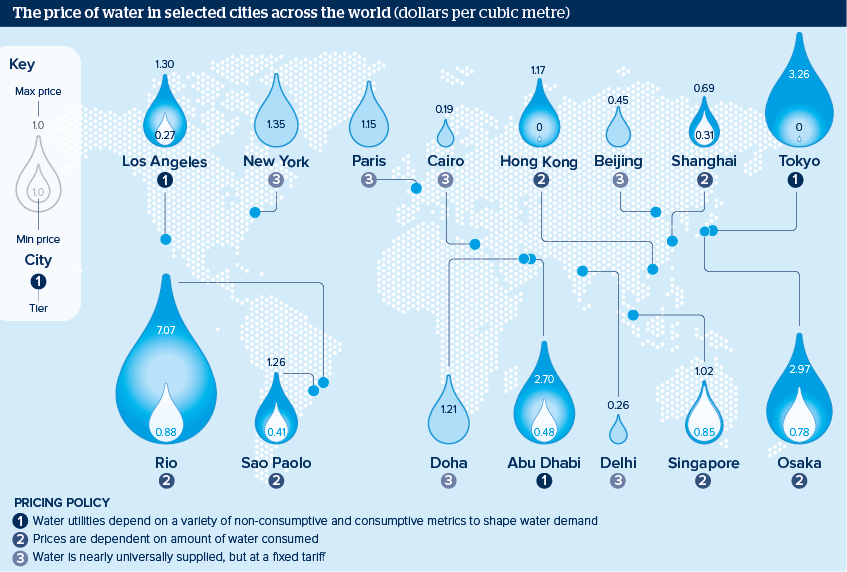 Figure 1 – The price of water in some of the world’s largest cities (Source: Municipal water utilities,


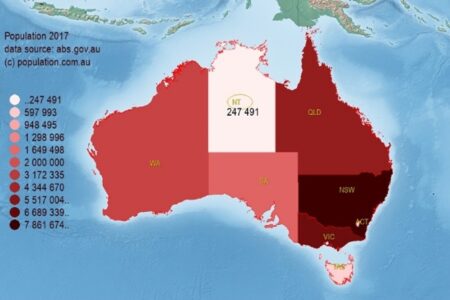
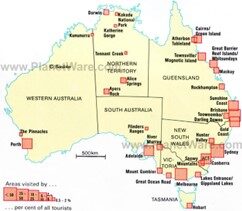


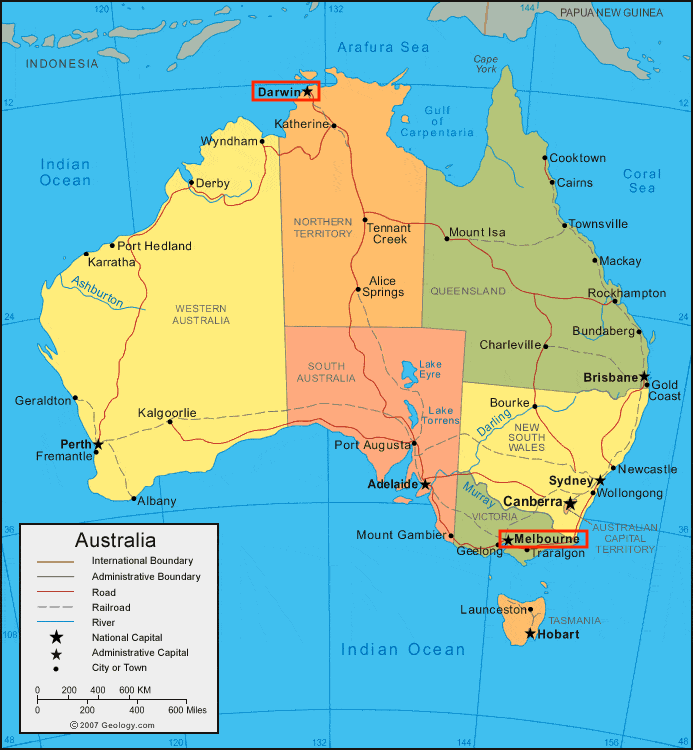 Figure 1 – Map of Australia (Source:
 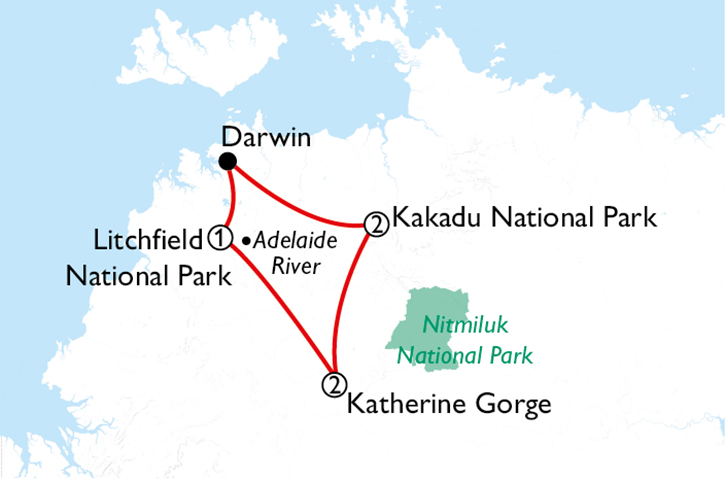 Figure 2 – The three national parks around Darwin
 Figure 3 – The “warning” on Darwin’s Hilton door
 Figure 4 – Soft drink machines in Darwin.