The details of our trip to Darwin were outlined in the first blog that I wrote and posted three days after our return (July 25th). I wrote that “the main driving force that led us to take the trip was the family trip to Melbourne.”
My Australian family started with my cousin (his father and mine were brothers), who is eight years older than me, also born in Warsaw, Poland. In that blog I also included a reference to a recent interview that he gave about his life in Warsaw during the war. In the meantime, I have found an older reference that includes a short summary of the life that he had built in Australia.
I came to Australia with the knowledge that during our stay in Melbourne, we would encounter social occasions where we’d be invited to settings that would include family members that have no idea about the relationship of my family with my cousin’s family. So, I decided to bring my family tree with me. The direct descendants of my cousin are familiar with the connection mainly because this was not our first visit to Melbourne and a few of them also visited us in the US. But family trees are open-ended documents that constantly change with time. The changes are “small” when children are born but the changes can be very large with marriages, because full new family trees are incorporated as a result of a single new marriage link. Aside from the people directly involved, chances are that members of the two families know very little about each other. Indeed, my “prediction” was confirmed at a family event that one of my cousin’s daughters arranged that included her direct family, my cousin, my wife and the mother-in-law of my cousin’s daughter. My wife and I had never met the mother-in-law, so I was glad that I had brought my family tree with me to start a lovely conversation.
I also had an ulterior motive for bringing my family tree to Australia and writing about it in this blog.
I mentioned before that my cousin’s early background has important similarities to mine. We were both in Warsaw at the start of the German invasion of Poland that started WWII and the resulting Holocaust. The difference was that at that point he was 8 years old, and I was 3 months old. This fixes my age above the life expectancy of every country in the world. (Japan holds the record – 82). I still teach, write, and travel but I am fully aware of my limited prospects. So, I am always on the lookout for younger relatives who can take over the administration of my family tree. The Holocaust made sure that, together with the more normal dynamics of family trees such as marriages and births, my tree turns out to be global. The Australian branch is an important offshoot of this tree. In addition to Australia, my tree has major branches in France, US, and Israel. I felt (and still feel) that an important part of my job is to try to ensure continuation of the data-gathering beyond my life span. I feel that with electronic communications in our possession, the dream that all humanity will be part of the same tree is not totally outlandish and that it can contribute to a feeling that all of us are parts of the same family and thus responsible for each other.
The current “record keeper” of the biggest family tree is the Oxford University Big Data Institute with 27 million people. This database is based on genomic research that promises to extend history beyond the written record to include genomic records and thus unify our academic definitions of history with archeology, anthropology and other disciplines that deal with our past. Genomic sequencing is fast becoming part of our “reading skills” and life itself is being redefined, in one sense, as a genomic writing ability. My dream is to try to redirect this to fortify our collective chance of survival. I fully realize that this is a dream that most probably will not materialize. This outlook is fed by my observation that my younger generations are fully occupied with their own dreams for their future and that “collective” dreams are not a priority for them.
A sprinkle of exception to this pessimism came from my Australian family.
The youngest son of my Australian cousin likes to travel, both professionally and as a tourist . In one of his trips that followed a trip with his father to Poland to share my cousin’s early past, he “discovered” Wysokie Mazowieckie (WM) and the efforts that some people (local and foreign) are making to resurrect the Jewish cemetery there.
A few years after that “discovery,” my wife and I took a trip to WM and met Karol Glebocki, the teacher that, with his students, became central to this effort. Figure 1 shows both of us with the tombstone of Aaron Avigdor Tomkiewicz (AAT), a man who already was the oldest ancestor in my family tree.
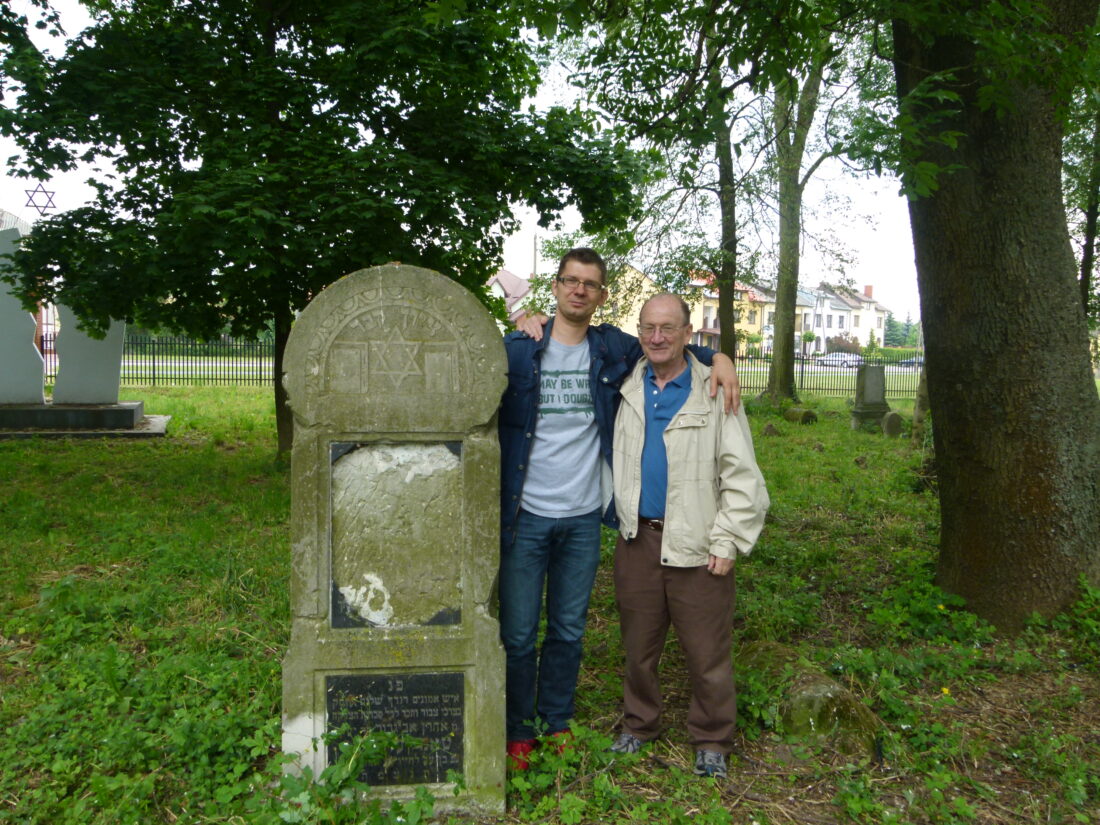
Figure 1 – Karol Glebocki and me near the gravestone of Aaron Avigdor Tomkiewicz in the newly restored Jewish cemetery in Wysokie Mazowieckie.
I didn’t start my family tree with the visit to WM. I started it a few years earlier, driven by a similar motive that drives me now in my search to move the effort to a younger generation. My uncle (younger brother of my mother) was with us through our Holocaust experiences but decided to settle in France and start his own “branch” there. At the time, he was the guy that was left with the most detailed memory of our past. I decided to construct the tree based on input from him. My objective was not to find my origin but just to be able to connect as many surviving members of my family as possible. For many years, to my knowledge, I was the only one in my family to administer the data. Two questions remained unanswered. AAT was listed with two wives. I was sure that he was not a bigamist, but I had no idea about the details. I knew of a French family that hosted me during the Israeli Independence war, but I knew nothing about the details of the links. Both questions got answered when I was able to link with David Askienazy from Paris. He is much younger than me and much more active and productive in assembling his family tree (listed in “My Heritage”). After our contact, my family tree grew considerably. The last major development went back to WM and a connection with Aaron Rotenberg, through the Jewish Record Indexing – Poland, with detailed data search in WM. I haven’t yet analyzed all the new data that he supplied me. My present family tree contains 352 members!
The “normal” dynamics of a family tree can be demonstrated with very recent developments that took place this year:
Over three months ago, a first granddaughter was born to my French cousin. We had the opportunity to enjoy the three generations on Zoom.
Natalie Leventhal,the grandmother of my wife’s two nieces, will celebrate her 100 birthday. I will bring the family tree with me to Connecticut, where she lives, so the younger generation will be able to take over administration of that branch.
Toward the end of this month, my wife and I will travel to Washington, DC to attend a Holocaust meeting and stay with my American cousin. We will bring the family tree with us.
The “ultimate” impact on my family tree took place few days after our return from Australia. I got an email from Matt Rozell (see below) saying that he found, in the US archive, a short movie clip taken by American soldiers that unquestionably describes our liberation by the American army on April 13, 1945 near the German town of Farsleben.
You can watch the clip-on YouTube.
After 78 years, this was a sensational find. Social networks were full of feedback and all the Israeli papers that I have access to, both in English and Hebrew, mentioned it. I got emails both from Israel and the US asking me if this was “my” train. It was. The Jerusalem Post, an Israeli, English language paper, probably had the fullest history of the event.
A short description taken from the article is below:
Never-before-seen footage of Holocaust survivors being liberated by US Army soldiers during the last stretch of World War II has been unearthed at the United States National Archives, according to a Wednesday report by the Independent.
On Friday, April 13th, 1945, soldiers from Tanks 12 and 13 from the US Army’s 743rd Tank Battalion led by a scouting jeep liberated a train transport with thousands of Holocaust victims who had left the Bergen-Belsen concentration camp one week before and were bound for Theresienstadt.
First, I started to do what many survivors of this event do – try to find myself or my family there. (My mother and her younger brother were also there.) A 78-year gap is no help. So, I tried to do better. I went through my mother’s small Bergen-Belsen book, whose title, translated into English, reads, “There was Life Even There” (it is shown in Figure 2), to look for a description of the event as written shortly after our liberation. Here’s her description of the liberation as written close to the end of the book:
On the 13th of April we stop next to a copse. The trees are humming, the birds are twittering, a light breeze wrinkles the surface of the river. Someone says we’re not far from Magdeburg. Pilsudski was imprisoned in Magdeburg, wasn’t he? They’re shooting at us from the planes. The Germans are shooting at us from the copse. I can’t see much from under my pillow. Mulek went on reconnaissance. When he came back he said they’d fished our Auslander documents out of the river. It turns out that our Palestinian certificates had arrived from Switzerland in February. That Kastner chap didn’t forget afterall! Why did the Germans throw the documents into the water? What will happen to us?
There are corpses lying on both sides of the train. The engine driver has made off on the locomotive. So we’re on a train with no locomotive and a German crew who beat us, spit at us and curse us in the intervals between shooting. They have an order to finish us off and throw our bodies into the Elbe, just like they’ve done with tens of thousands of concentration camp victims in the last few months. Is it now? Maybe they’ll wait another hour or two.
A handful of human spectres made it from the train to a town nearby and begged some food from the Germans. “They were completely normal, like they weren’t Germans at all,” says someone with surprise. Stas and Hela went too and got a chicken and a few potatoes in return for my broken gold watch. What luck! Renia cleans the chicken and cooks it on a Primus borrowed from the Czechs. Slawcia advises us to add what’s left of the dried potatoes. There’ll be more that way. The whole compartment participates in the feast without paying any attention to the shots and ceaseless cannonade whose threatening sounds are coming from afar, from near, no matter where from. We eat. Will they make it in time? Won’t they? “How did you get hold of so many potatoes?”
Suddenly the first American soldier appears. How inconspicuous he is! Behind him there’s a group of others. One of our wheeler dealers has already recognized the friend of a friend in America. The American soldier waves his hand. His trousers are creased. We’re free.
We’re saved. Stas throws himself to the ground and cries. Others are crying, laughing, kissing. I don’t feel like crying. I feel stupid, totally empty inside. So this is the way the war has finished for us? Without pathos. Without drama. An American soldier with creased trousers and now it’s the end after so many years. So many ages.
Magdeburg is taken and the 9th American Army has taken us into its possession. Bobus proudly brings me a rucksack containing a dirty towel and a jagged comb. The children kick the Germans, take their guns away, their bikes and rucksacks.
The adults are too weak to take revenge. They don’t feel triumphant. In fact they don’t feel anything. They throw a guard to the ground. “Kneel,” they shout. They torment him, but without conviction, as if it were a duty, mildly. They’re still completely bewildered. They don’t know what to do with him, with themselves. But yesterday this selfsame guard was hitting women in the face when they begged him for a few rusks. Except what will it achieve? The Americans offer cigarettes, hand out bars of chocolate. “Aren’t you happy?” they ask. Are we happy? We don’t dare ask ourselves that question. Mother, father, Piotr, Witek, Helenka … We’ve survived and what now? “Won’t we need these potatoes anymore?” we ask the Americans uneasily.
The girls are flirting with the soldiers. Singing. Conversations. The Americans photograph the specter-train from all sides, and us, the specters from the train. We must light a fire and boil a few potatoes. I must wash Bobus and put him to sleep. Mrs M. shrieks at the top of her voice. Her husband has just died this minute. He was already a free man. She’s left with four children just when the war has finished. A huge blonde in an American uniform brings a bottle of wine to the compartment. Do I want some silk stockings? Would I go for a walk with him? He fought for me after all. He fought. I’m as light and empty as a soap bubble. My head’s spinning from the wine. From the freedom which has arrived too late for happiness. “My little one didn’t live to see the day,” says Sonia and cries. For joy?
Next day we leave the train. They take us to beautiful Hillersleben, they’ve previously thrown the Germans out. We become “Displaced Persons of the World.”
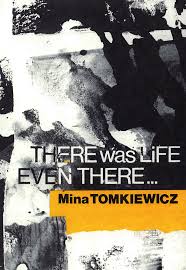
Figure 2
You have here what you need to compare my mother’s description of our liberation with that of some of the liberators. Not surprisingly, they are not the same. They are two different perspectives. To my knowledge, this is one of the few opportunities that exists to read these views. For that, I thank Matt Rozell and my mother.
The first of my blogs that describe Matt Rozell’s continuous efforts to get the liberators and survivors together was written two months after I started this blog (June 4, 2012). An important follow up came when, jointly with the people of Farlsleben, a monument was erected there that was shown in the April 12, 2022 blog. A photograph of Matt Rozell that commemorates the D-Day anniversary is shown in the June 11, 2019 blog (the guy on my left without glasses).
It is obvious (at least to me) that without this event “my” family tree wouldn’t even exist.

 (Source:
 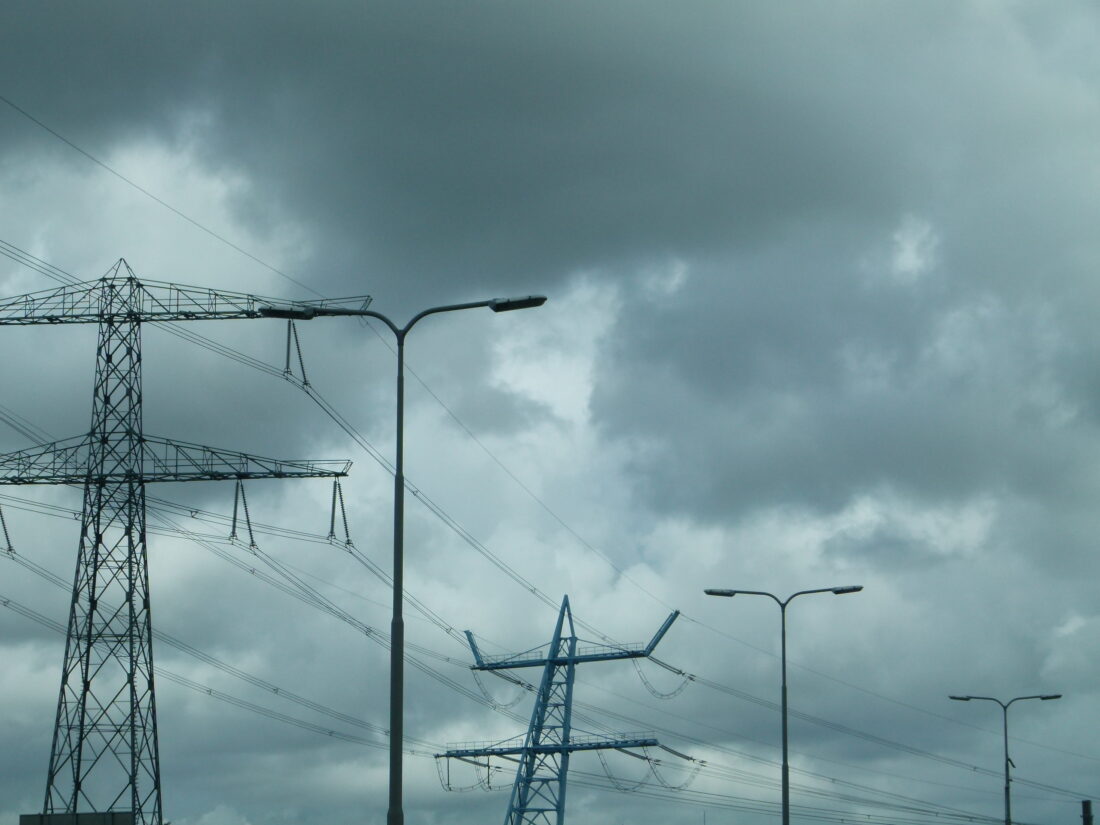 Figure 1 – Above-ground high-power lines in the Netherlands
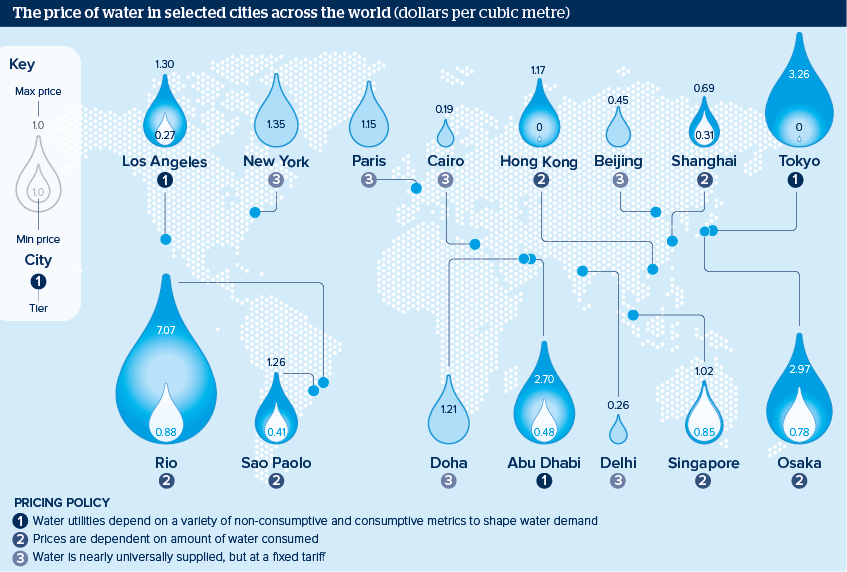 Figure 1 – The price of water in some of the world’s largest cities (Source: Municipal water utilities,
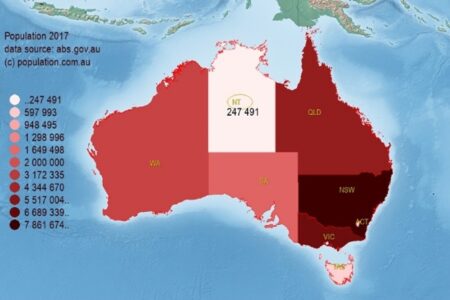
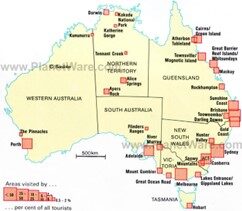

 Figure 1 – Map of Australia (Source:
 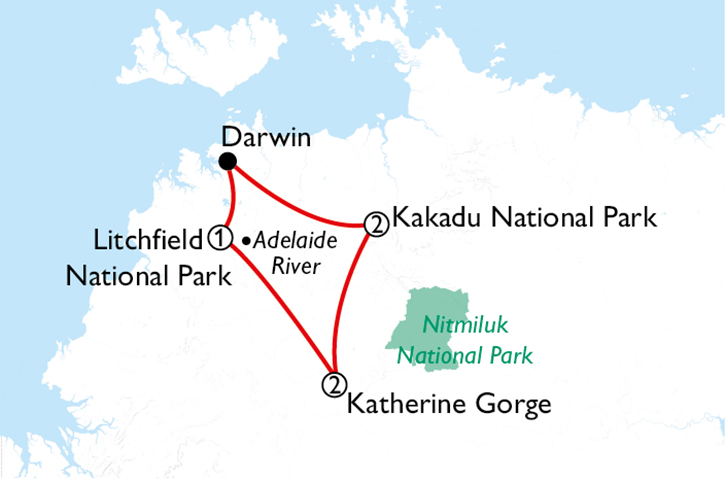 Figure 2 – The three national parks around Darwin
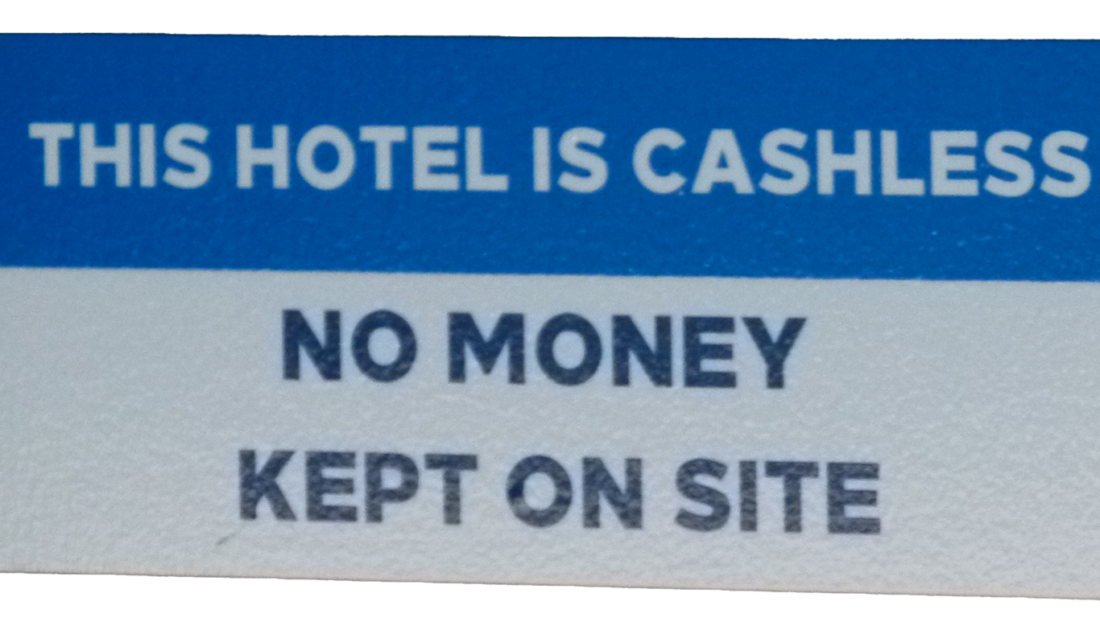 Figure 3 – The “warning” on Darwin’s Hilton door
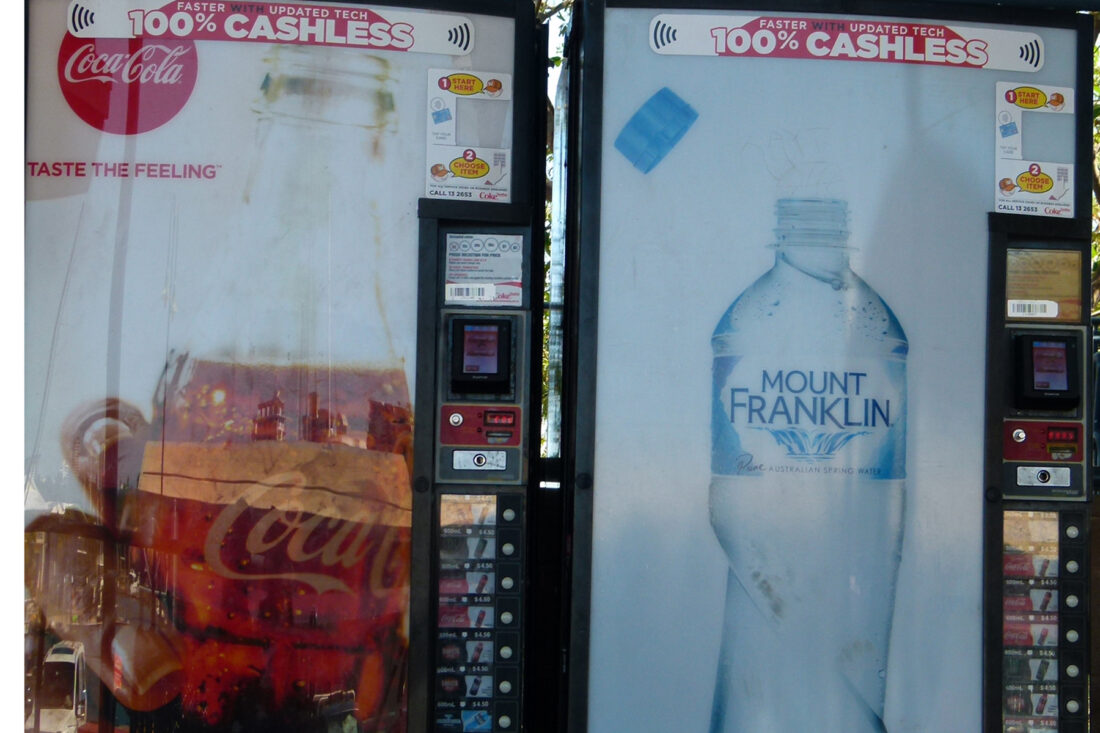 Figure 4 – Soft drink machines in Darwin.