Close to half of the country – mostly that in the low income end of the financial spectrum – does not participate in choosing our government. The courts have amplified this inequality by allowing an unlimited use of money in campaign contributions. Two billionaire brothers announced that they were planning to spend close to a billion dollars on the 2016 election. We are quickly moving from the democracy we prize to the embodiment of oligarchy.
There are other factors not directly associated with economic status that affect our collective participation in the nature of government that we have. These include gender, race, age and education. I’ll look at those next week.
Here are the data taken mostly from the “United States Election Project” site:
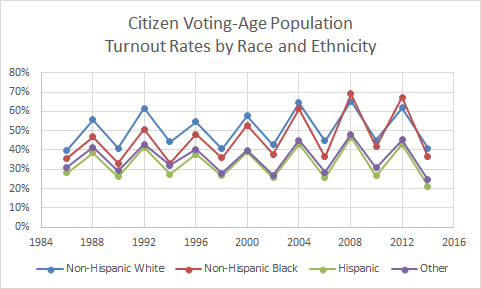
Figure 1
Figure 1 shows the trend based on race and ethnicity. The pattern is almost consistent since 1986: a low turnout throughout, with a major difference (around 20%) in attendance between presidential and midterm elections. Over that time period, we see a small but noticeable increase in the turnout of Non-Hispanic Whites but a relatively large increase in that of the Non-Hispanic Black population. The turnout of the latter group now looks identical to that of Whites while participation in the Hispanic community remains consistently low.
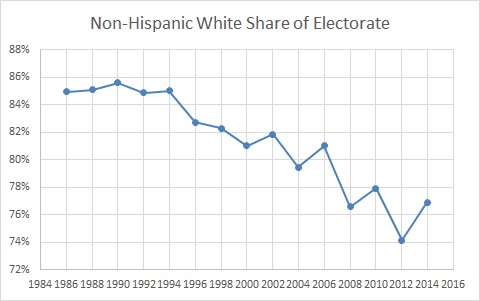
Figure 2
Figure 2 shows the relative decline of the Non-Hispanic White share of voter turnout.
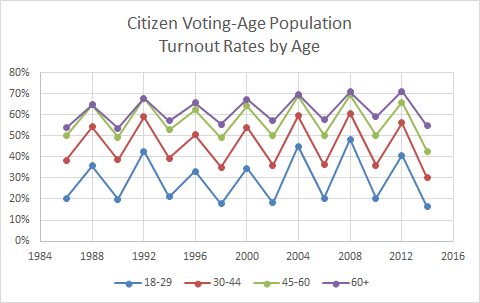
Figure 3
Figure 3 shows the voting trends by age group: respectable participation by old folks, diminishing to very low turnout by younger voters. Bernie Sanders’ campaign has said that he strongly attracts young voters and brings new voters to the table in his battle against Hilary Clinton for the Democratic nomination. That claim is likely true but we will have to wait until after the 2016 elections to see all of the numbers.
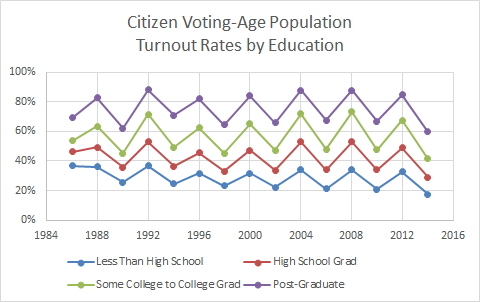
Figure 4
Figure 4 shows the trend as a function of education. Again, we see a hierarchy of turnout, with the highly educated participating far more than those with less than a high-school education and an even more prominent difference between the four groups. Many claim that Donald Trump can attribute his recent rise in popularity to his draw among Whites with less than a high-school education. Like Sanders, he asserts (probably correctly) that he is tapping a large group of new potential voters. Again, we will have to wait until the end of the present election cycle to see how many of them actually show up.
Voters overwhelmingly look for and hope for a savior of sorts – a prince on his white horse to rescue the country from everything that ails it. That some have gathered behind Trump, casting him in this role, is unsurprising, but we must remember it is not a new phenomenon.
Figures 1 – 4 show the sectorial trends from 1986. To get a better picture of the disparity between voter turnout at midterm and presidential elections, figure 5 goes all the way back to 1948 – shortly after the end of WWII. The difference in participation rates is consistent throughout this period.
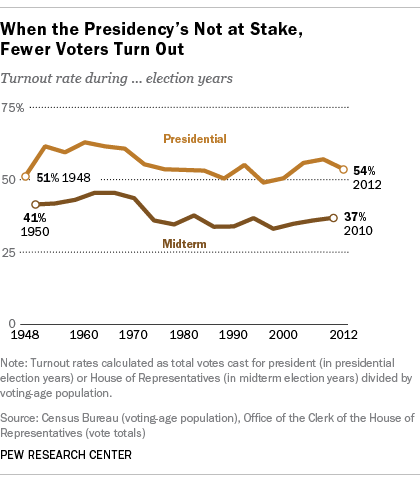
Figure 5
Next week I will start to analyze the consequences of the low turnout, some proposed remedies, and the implications of these trends on the US’ ability to lead global efforts to mitigate climate change and other man-made world perils.
