This series has looked at the progress that the US has been making in the energy transition to sustainable energy sources–specifically, the steps that might be reversed with government changes in the November election. I found a blog that ties into this theme that was recently posted by DSIRE Insight, a project associated with North Carolina Clean Energy Technology Center. Figures 1 – 4, taken from that bog, summarize important information. Figure 1 shows the number of climate actions taken in the first quarter of 2023. Only two states–Alabama and Oklahoma–took no action at all.
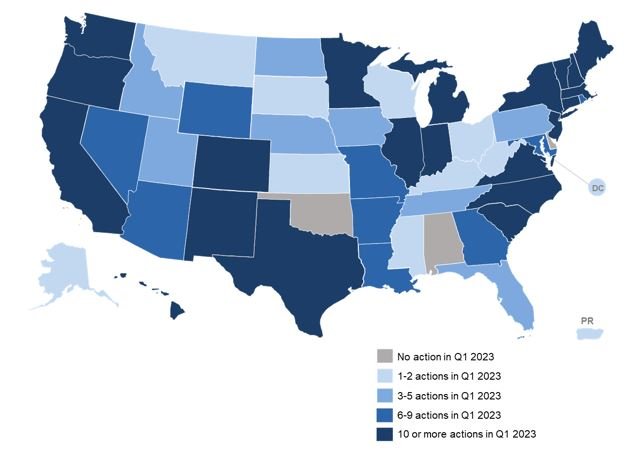
Figure 1 – Q1 2023 action on power decarbonization and resource planning
Figure 2 shows each state’s largest contributors to electricity generation.
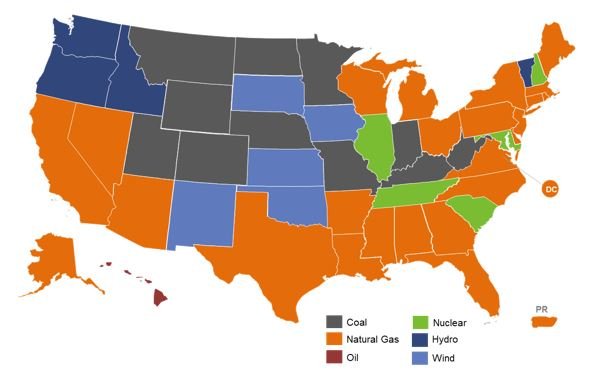
Figure 2 – Largest contributing resource to state electric generation mix (2022) Data Source: U.S. Energy Information Administration – Electric Power Monthly, Net Generation by State by Type of Producer by Energy Source (Jan. – Dec. 2022).
Coal is still the main contributor in 11 states. Most states are now generating their electricity using natural gas but many of them are shifting to various forms of solar. Figure 3 shows where they are in this process (as of 2023).
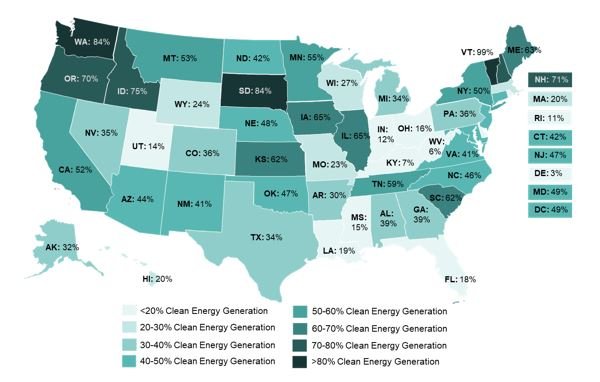
Figure 3 – Percentage of clean electricity generated by state (2022)
Data Source: U.S. Energy Information Administration – Electric Power Monthly, Net Generation by State by Type of Producer by Energy Source (Jan. – Dec. 2022). Map represents percent of total MWh generated in each state from clean energy sources (biomass, geothermal, hydroelectric, nuclear, solar, and wind).
The Biden administration has committed to bringing the US to a carbon pollution-free power sector by 2035 and a net-zero economy by 2050. The states shown in Figure 4 have also made commitments to reach net zero emissions by 2050. As we know well from experience, however, future commitments can easily change with changing leadership.
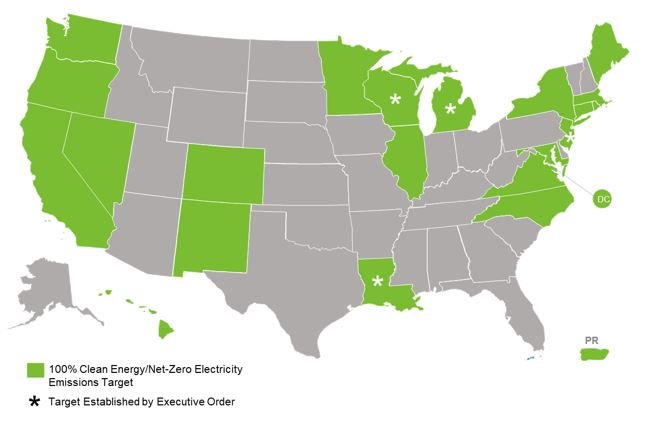
Figure 4 – 100% Clean energy or net-zero electricity sector emissions targets (May 2023)
As the maps above show, California is among the states at the forefront of the energy transition in the US. It is not surprising, then, that the energy industry is using California to emphasize some of the difficulties that the transition is facing. Some of these difficulties are summarized in the article below:
Soaring Solar Power Is Creating Challenges for the U.S. Energy Grid
By Tsvetana Paraskova – May 27, 2024, 5:00 PM CDT
- Soaring solar installations are causing distortions in the power distribution and transmission systems in top solar-producing states like California.
- Battery storage could alleviate these challenges, but it is still lagging behind solar capacity additions.
- Despite the decline in coal power generation, coal still holds a significant share of the U.S. electricity mix, more than any renewable energy source.
No other energy source has seen more rapid growth in the United States over the past half a decade than solar power. But soaring solar installations have begun to distort the power distribution and transmission systems in the top solar-producing states such as California, creating challenges for utilities and the grid.
Battery storage could help alleviate these challenges, and although it is also surging, it is still lagging behind solar capacity additions.
It is no wonder then that despite a continuous decline in U.S. coal power generation, the share of coal in America’s electricity mix is still above 15%, more than any renewable energy source.
All renewable energy sources combined—wind, solar, hydropower, biomass, and geothermal—surpassed coal-fired generation in the U.S. electric power sector for the first time in 2022. But coal still holds about a 16% share of electricity generation, more than wind’s share of around 11%, hydropower’s 6%, or solar power’s 4% share of the electric generation mix.
Solar power has now grown to account for about 6% of total U.S. electric power generation after surging by 155% between 2018 and 2023, per EIA data cited by Reuters columnist Gavin Maguire.
But while solar power has made the U.S. power-generating system greener, it has also made it more volatile, especially in the top solar market, California.
There, peak solar power generation coincides with the lowest residential electricity demand during the midday. When power demand begins to surge after 6 p.m., solar output begins to fade.
Earlier this year, the EIA estimated that solar and battery storage would make up 81% of new U.S. electric-generating capacity in 2024. Developers and power plant owners plan to add 62.8 GW of new utility-scale electric-generating capacity this year, up by 55% compared to the capacity added last year, 40.4 GW. Solar is set to account for the largest share of new capacity in 2024, at 58%, followed by battery storage, at 23%, per EIA forecasts. The growth in solar additions would be almost double last year’s 18.4 GW increase, which was itself a record for annual utility-scale solar installation in the United States.
“As the effects of supply chain challenges and trade restrictions ease, solar continues to outpace capacity additions from other generating resources,” the EIA noted.
Battery storage additions are also expected to shatter records this year, with U.S. battery storage capacity set to nearly double in 2024 as developers plan to add 14.3 GW of battery storage to the existing 15.5 GW this year. In 2023, 6.4 GW of new battery storage capacity was added to the U.S. grid, a 70% annual increase. California and Texas are in the lead when it comes to battery storage additions due to the rapid growth of variable solar and wind capacity in these two states.
“In much of the US, batteries are not yet performing that crucial load-shifting role,” Ed Crooks, Vice-Chair, Americas at Wood Mackenzie, wrote last week.
We are all experimenting and learning how best to run the energy transition. The publication above uses California’s experiences to emphasize some of the difficulties that states encounter. However, the article does not mention the steps that some of the states and the federal government are taking to rectify these difficulties.
I will start with California and Vermont and finish the blog with the federal government.
California
Previous blogs have emphasized the importance of expanding the availability of electric power beyond centralized power utilities to include distributed generation (April 2, 2024 blog). To encourage broad participation in the effort, many states are introducing net metering to store unused power from distributed generation (March 26, 2024 blog). As I mentioned in these blogs, one of the issues with net metering is who pays for the effort. California is now experimenting with ways to address the issue:
Last year, the California Public Utilities Commission (CPUC), with the active support of the state’s largest investor-owned utilities, eviscerated the existing net metering regulations. The new plan, known as NEM 3.0, slashes the amount the utilities have to pay their rooftop solar customers by 75 percent. Ouch! As a result, applications for new rooftop solar systems skyrocketed, as people sought to get in on the gravy before the new rules went into effect. After NEM 3.0, applications fell by about 50 percent. Since then, several large rooftop solar companies have gone bankrupt.
The CPUC justified the change by saying the state needed more batteries to soak up electrons during the day and send them back to the grid in the evening and in fact the number of residential batteries installed in California has jumped. But batteries are expensive and add quite a large amount to the total cost of a rooftop solar system. The amount the utilities now have to pay to access that stored electricity is hardly enough to justify the added expense, but it can lower utility bills if self-consumed by the homeowner.
Vermont
Vermont is trying to mobilize fossil fuel companies to “help”:
Vermont has passed a first-in-the-nation law that will require “Big Oil” to pay for damage caused by climate change, the long-term shift in weather patterns that is heavily influenced by fossil fuel emissions.
Vermont Gov. Phill Scott sent a letter to the state’s General Assembly on Thursday allowing the measure, which proposes to establish the Climate Superfund Cost Recovery Program, to become law without his signature. In that letter, Scott said that “taking on ‘Big Oil’ should not be taken lightly.”
“With just $600,000 appropriated by the Legislature to complete an analysis that will need to withstand intense legal scrutiny from a well-funded defense, we are not positioning ourselves for success,” he said. “I’m deeply concerned about both short- and long-term costs and outcomes.”
“Big Oil” – the world’s biggest oil and gas companies – mostly relies on fossil fuels in their businesses, which are “by far the largest contributor to global climate change,” according to the United Nations. The international group says that fossil fuels account for more than 75% of emissions of greenhouse gases, which trap heat in the atmosphere and increase global temperatures, leading to more extreme weather events.
Meanwhile, the federal government is trying to make the use of coal more difficult: The other end of these developments are the states shown in Figure 2 that are still running their electricity mainly with coal. In many of these states, much of the land is owned by the federal government. Recently, however, the federal government has been considering ending the federal leases for coal mining:
BILLINGS, Mont. (AP) — The Biden administration on Thursday proposed an end to new coal leasing from federal reserves in the most productive coal mining region in the U.S. as officials seek to limit climate-changing greenhouse gas emissions from burning the fuel. The Bureau of Land Management proposal would affect millions of acres (millions of hectares) of federal lands and underground mineral reserves in the Powder River Basin area of Wyoming and Montana. Thursday’s proposal was made in response to a 2022 court order that said two federal land management plans drafted for the Powder River Basin during former President Donald Trump’s administration had failed to adequately take into account climate change and public health problems caused by burning coal.
The upcoming November elections are not only for president. All arms of government will experience some changes. This is the essence of the democratic system that all of us enjoy. The impact of these elections on the energy transition will be a crucial test of our collective resilience.

 Figure 2 (Source: Our World in Data)
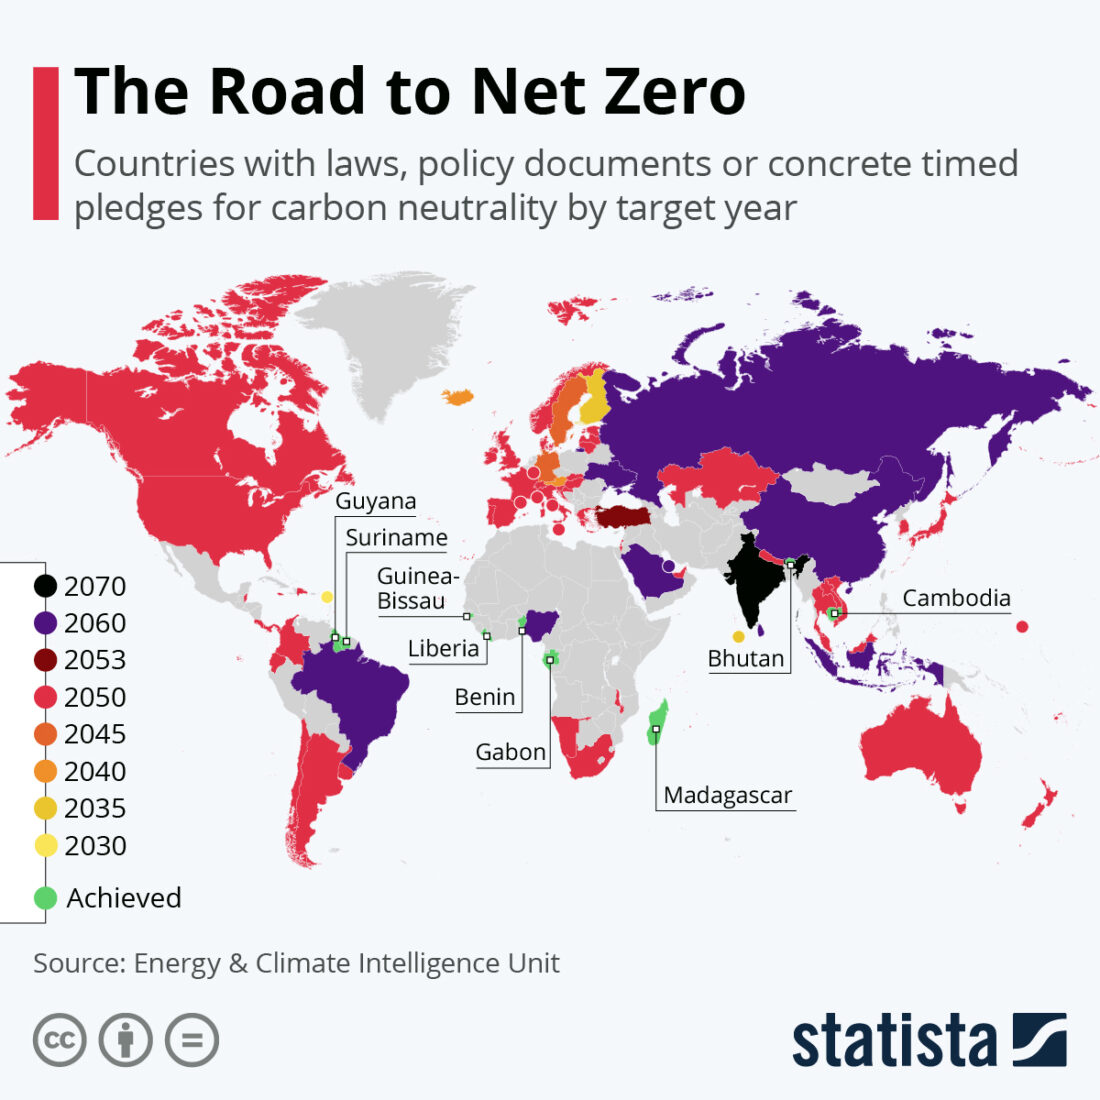
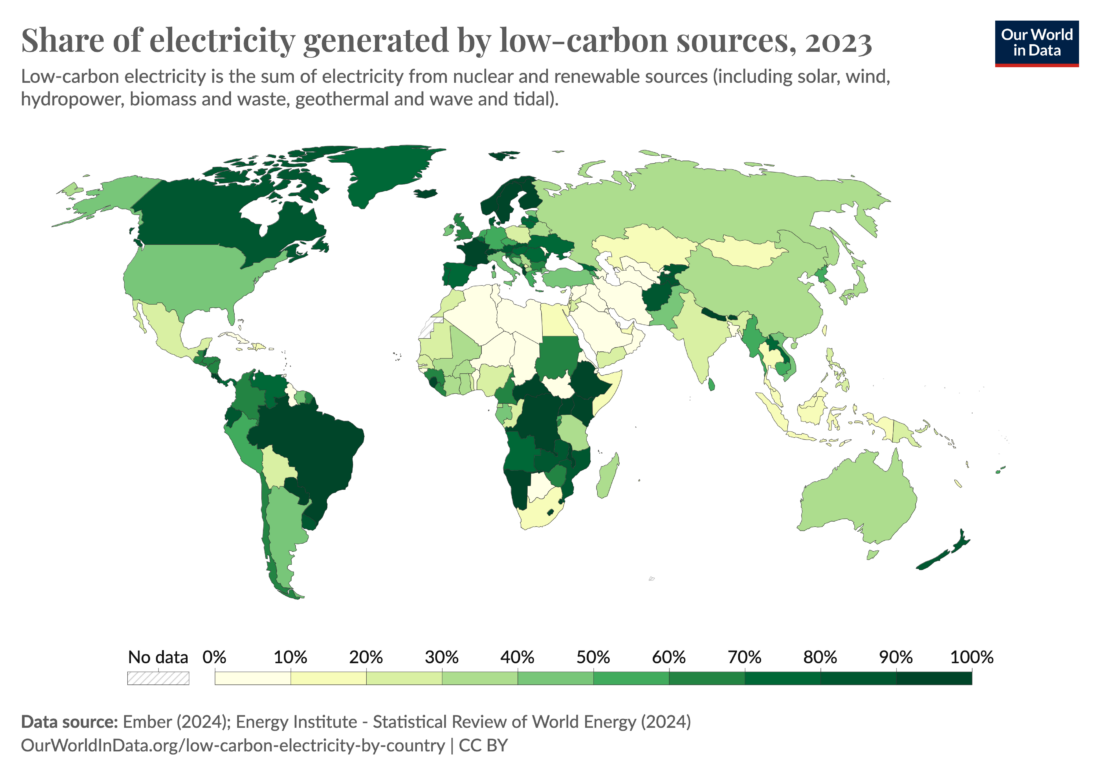
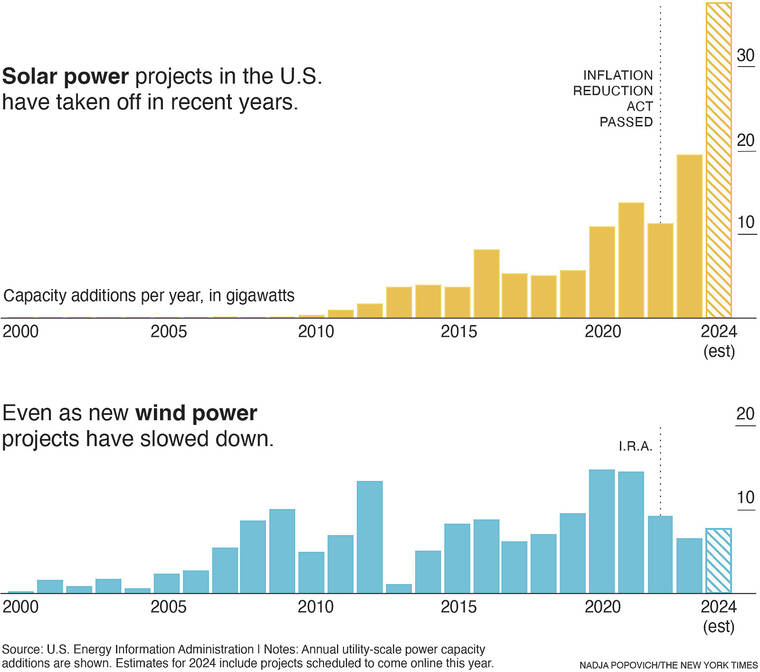

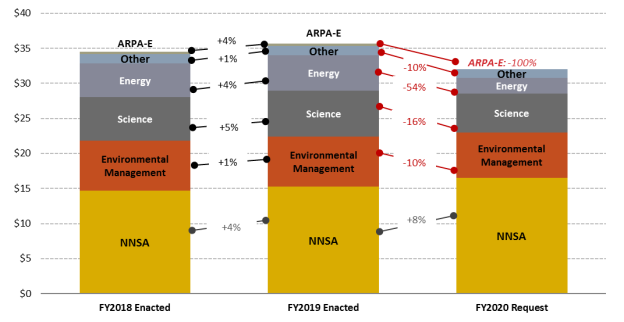 Figure 1 – FY2020 request from DOE, FY2020 Congressional Budget Request: Budget in Brief (March 2019). FY2019 enacted and FY2018 enacted from the Joint Explanatory Statement accompanying
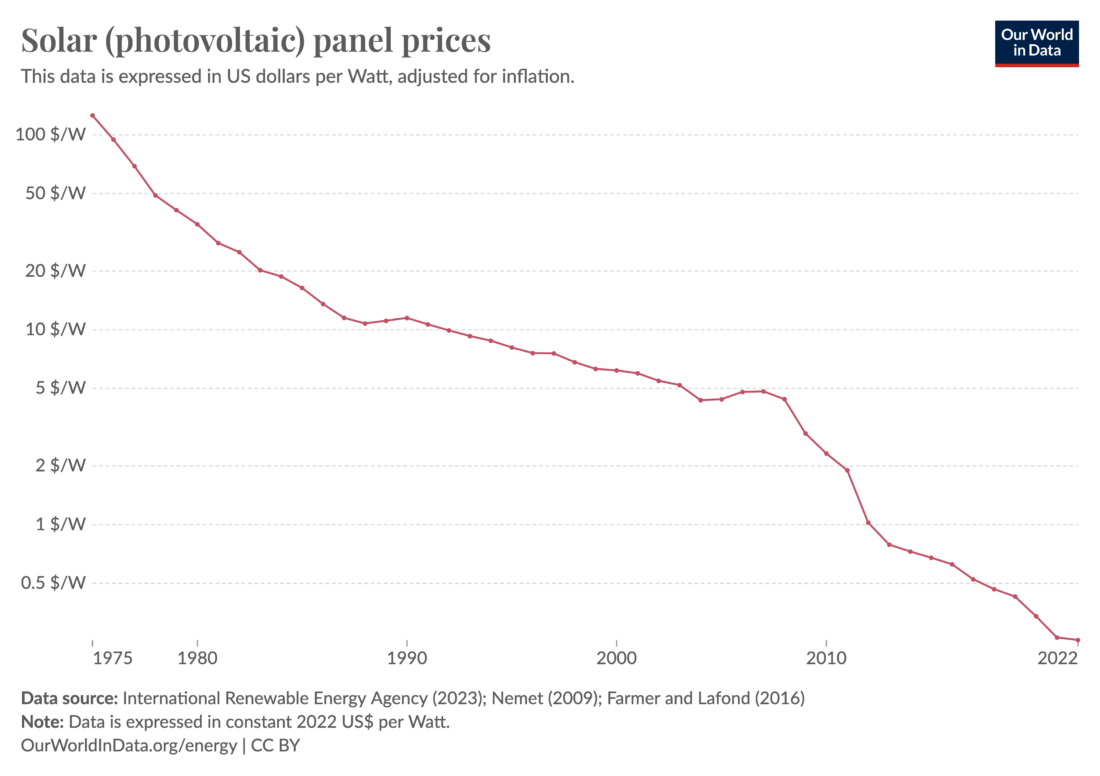 Figure 1 – Solar panel prices in US$/Watt (Source:
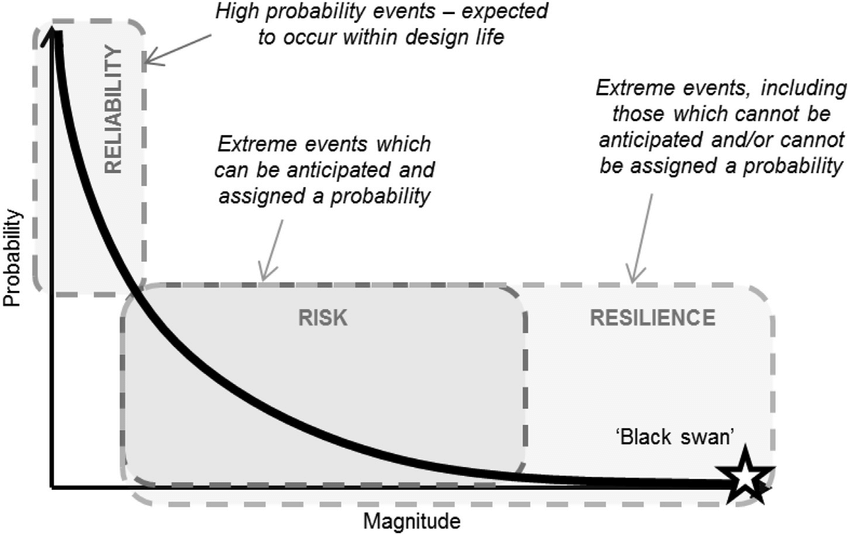
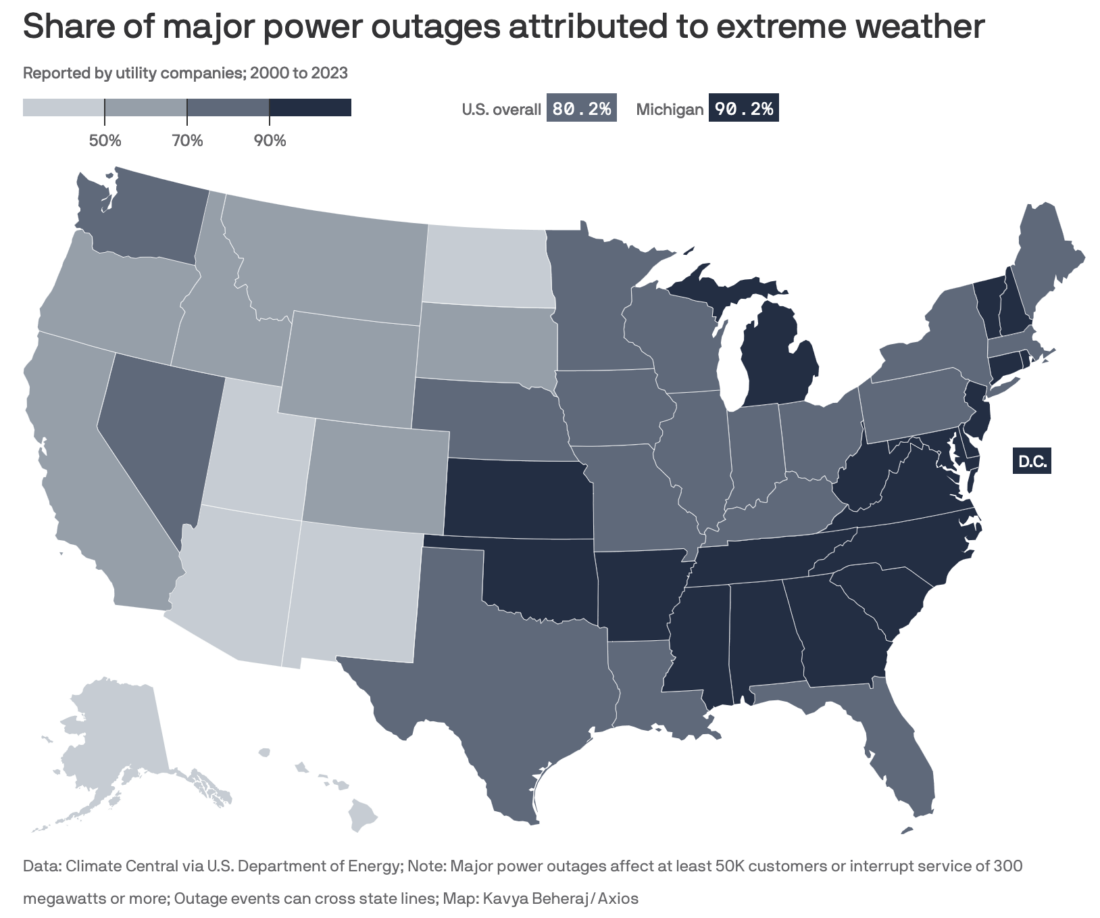 Figure 3 – Share of major power outages attributed to extreme weather
 Figure 1 – Developing countries invest more in renewable energy (Source: