COP28 Conclusions

(Source: Travis Leery on Unsplash via The Bulletin: Historic’ or ‘weak’? Parsing the climate agreement from COP28)

COP28 is over (officially December 12th, in practice, December 13th). Most modes of communication are focused on one sentence in the concluding document that will be discussed shortly. A celebratory summary of the unanimous concluding document can be found in the proud speech by the meeting’s president, Dr. Sultan Al Jaber:

Over the last two weeks, we have worked very hard to secure a better future for our people and our planet. We should be proud of our historic achievement. And the United Arab Emirates…my country… is rightly proud of its role in helping you to move this forward.

Ladies and gentlemen, the world needed to find a new way. By following our North Star, we have found that path. We have delivered a comprehensive response to the Global
Stocktake and all the other mandates. Together, we have confronted realities and we have set the world in the right direction. We have given it a robust action plan to keep 1.5
within reach. It is a plan that is led by the science. It is a balanced plan, that tackles emissions, bridges the gap on adaptation, reimagines global finance, and delivers on loss
and damage. It is built on common ground. It is strengthened by inclusivity. And it is reinforced by collaboration.

It is an enhanced, balanced, but… make no mistake… historic package to accelerate climate action. It is…the UAE Consensus Many said this could not be done. But when I spoke to you at the very start of COP, I promised a different sort of COP. A COP that brought everyone together, private and public sectors, civil society and faith leaders, youth and indigenous peoples. Everyone came together from day one. Everyone united, acted and delivered. We operationalized loss and damage… and started to fill the fund. We mobilized more than 85-billion-dollars in new financial commitments. We launched ALTÉRRA, the world’s largest catalytic private investor that is 100 percent focused on solutions to climate change. And we delivered world first after world first.

A global goal to triple renewables and double energy efficiency. Declarations on agriculture, food and health. Many more oil and gas companies stepping up for the first time on methane and emissions. And… we have language on fossil fuels in our final agreement. All of these are world firsts. And all of these are crucial actions that will help shape a better, cleaner world with greater, more equitable prosperity. And then we became the first COP to host a change-makers Majlis.

And I felt that that was the turning point in our negotiations. You reconnected with your spirit of collaboration, you got out of your comfort zones and started speaking to each other from the heart. That… made the difference.

The focus of most of the media was on the last two paragraphs, which emphasize the inclusion of language that many interpret as the “start of the end” of reliance on fossil fuels. This is especially notable because it was expressed at a global conference in a petrostate, presided over by the head of its national oil company (see last week’s blog). The occasion probably reminded many of the Nixon administration opening the door to China and Menachem Begin, the Israeli Prime Minister, opening the door (with President Anwar El-Sadat of Egypt) for a peace agreement between Israel and Egypt.

Below are a few examples of some of the press responses:

Bloomberg: COP28 Nations Reach First-Ever Deal to Move Away From Fossil Fuels

NYT: In a First, Nations at Climate Summit Agree to Move Away From Fossil Fuels

Washington Post: The world just made it clear the fossil fuel era is ending — with some wiggle room

MSN: COP28: World Agrees to Historic Climate Deal

Not everyone was happy:

MSN: COP28 climate deal ‘stab in the back’, activist Greta Thunberg says

It’s time to have a look at the agreement.

I am starting to work on this blog on Thursday (December 14th). As I write this, the agreement posted on the COP28 site is still marked as “draft” and fills 21 PDF pages. There has not yet been unanimous agreement on every word in the 21-page document; people are still working on some of the wording. However, if the president of the meeting can regard this draft as a final document, so can we.

The general structure of the agreement is summarized with the following section heads:

  • Outcome of the first global stocktake
  • Context and cross-cutting considerations
  • Collective progress towards achieving the purpose and longterm goals of the Paris Agreement, including under Article 2, paragraph 1(a–c), in the light of equity and the best available science, and informing Parties in updating and enhancing, in a nationally determined manner, action and support
    • Mitigation
    • Adaptation
  • Means of implementation and support
    • Finance
    • Technology development and transfer
    • Capacity-building
  • Loss and damage
  • Response measures
  • International cooperation
  • Guidance and way forward

The keywords, shown in italics, describe actionable verbs or nouns, including the following: recalling; Underlining; Acknowledging; Recognizing; Noting; Welcomes; Underlines; Reaffirms; Underscores; Emphasizes; Notes with alarm and serious concern; Notes with concern; Express appreciation; Commends; Further recognizes; Also recognizes; Calls on; Requests; Urges; Highlights; Decides.

Below, I am quoting in full the lines and short paragraphs that are preceded by the keyword “decides”:     

92. Decides to continue and strengthen the Sharm el-Sheikh dialogue between Parties, relevant organizations and stakeholders to exchange views on and enhance understanding of the scope of Article 2, paragraph 1(c), of the Paris Agreement and its complementarity with Article 9 of the Paris Agreement referred to in decision 1/CMA.4 until 2025 and takes note of decision -/CMA.5

97. Decides to establish the xx dialogue on implementing the global stocktake outcomes;

98. Also decides that the dialogue referred to in paragraph 97 above will be operationalized starting from the sixth session of the Conference of the Parties serving as the meeting of the Parties to the Paris Agreement and conclude at its tenth session (2028) and requests the Subsidiary Body for Implementation to develop the modalities for the work programme at its sixtieth session (June 2024) for consideration by the Conference of the Parties serving as the meeting of the Parties to the Paris Agreement at its sixth session;

99. Decides to convene a xx high-level ministerial dialogue at its sixth session on the urgent need to scale up adaptation finance, taking into account the adaptation-related outcomes of the global stocktake, and to ensure the mobilization by developed country Parties of the adaptation support pledged;

110. Decides to establish a technology implementation programme, supported by, inter alia, the operating entities of the Financial Mechanism, to strengthen support for the implementation of technology priorities identified by developing countries, and to address the challenges identified in the first periodic assessment of the Technology Mechanism, 22 and invites the Subsidiary Body for Implementation at its sixty-first session (November 2024) to take into account the technology implementation programme in its consideration of the Poznan strategic programme on technology transfer, with a view to recommending a draft decision on the matter for consideration and adoption by the Conference of the Parties serving as the meeting of the Parties to the Paris Agreement at its sixth session;

194. Decides pursuant to paragraph 8 of decision 19/CMA.1 that the information collection and preparation component of the second global stocktake shall start at the eighth session of the Conference of the Parties serving as the meeting of the Parties to the Paris Agreement (November 2026) and its consideration of outputs component will conclude at the tenth session of the Conference of the Parties serving as the meeting of the Parties to the Paris Agreement

The only sentence in the 21-page document that includes “fossil fuels” shows up in the part about Mitigation and is quoted below:

(d) Transitioning away from fossil fuels in energy systems, in a just, orderly and equitable manner, accelerating action in this critical decade, so as to achieve net zero by 2050 in keeping with the science

Posted in COP | Leave a comment

COP28

cartoon of oil & gas people asking for money at COP28(Source: Cartoons by Josh)

I had two objectives with this blog. One was to start summarizing COP28, which started on November 30th and is scheduled to close today. The second objective was to strongly encourage my students to follow up on the COP28 developments as they unfold by “promising” them that some of the figures that play a role in the meeting will be probed in the final exam that is scheduled for next week. From my perspective, the two objectives are complementary.

I asked AI through Google to define COP28; below is what I got:

Generative AI is experimental. Info quality may vary. Learn more

Here’s some data from COP28:

  • Greenhouse gas emissions: The United Arab Emirates’ (UAE) greenhouse gas emissions increased by 7.5% in 2022, compared to a 1.5% increase globally.
  • Temperature: The decade was the warmest on record, with more countries reporting record high temperatures than any other decade. The planet’s average surface temperature has risen about 2 degrees Fahrenheit (1 degrees Celsius) since the late 19th century.
  • Glaciers: Glaciers thinned by roughly 1 meter per year.
  • Sea ice: Sea ice loss was unprecedented.
  • Fossil fuel lobbyists: At least 2,456 fossil fuel lobbyists registered to attend the summit, which is more than almost every other country delegation.
  • Participants: A total of 100,446 delegates registered to attend the summit in person and virtually.

The two previous COP (Conference of the Parties) meetings that are relevant to COP28, are COP21 (also known as the meeting that framed the Paris Agreement), which was covered in a series of previous blogs (between November 2015 and January 2016), and last year’s meeting (COP27), which was covered in the November 22, 2022 blog.

The official site of COP28 is here.

The first item in the AI definition of COP28 is the obvious fact that it is being held in Dubai, the largest city in the United Arab Emirates (UAE), a country whose greenhouse gas emissions are increasing five times faster than global emissions. UAE is clearly a petrostate (see February 8, 2022 blog). AI got its “inspiration” from broader public opinion about conflicts between petrostates and the rest of the world, regarding how to mitigate and adapt to climate change.  COP28’s president is Sultan Ahmed Al Jaber. He is also the minister of industry and advanced technology of the United Arab Emirates,[2] head of the Abu Dhabi National Oil Company (ADNOC),[3] and chairman of Masdar. Some think that the future of fossil fuels could be decided in Dubai.

The next three highlights stem from the warmest probed global temperature record of 2023, based on recordings such as those shown in Figure 2.

graph of global monthly absolute temperatures from 1950s-2023

Figure 2 – 1950s-2023 global monthly absolute temperatures (Source: CarbonBrief)

The last two AI highlights are directly connected to lobbying and attendance. The number of lobbyists is enormous.

What are missing from the short AI description are important content descriptions that include intended global actions to limit methane emissions (the main component of natural gas), and the continuous issue of how much funding developed countries will provide for adaptation steps needed in the developing countries. Below, I will follow up with some details to rectify these two omissions:

Methane:

Nov 27 (Reuters) – Delegates at this year’s U.N. COP28 climate summit are anxious to boost the world’s climate change agenda with concrete plans for clamping down on the second-most prominent greenhouse gas – methane.

While more than 150 countries have promised since 2021 to slash their methane emissions 30% from 2020 levels by 2030 under the U.S.- and EU-led Global Methane Pledge, few have detailed how they will achieve this.

The extent and the sources of these steadily growing emissions are shown in Figure 3 (taken from one of the links in the article above).

graph of methane emissions sources by region

Figure 3 – Sources of methane emissions by region (Source: Reuters)

Loss and Damage Fund:

The need for a loss and damage fund was described in a previous blog (December 7, 2022). A decision was made to discuss the specifics of creating this new fund over 2023 and vote in COP28 over the proposed structure. The present situation is discussed in the following link:

Wealthy countries most responsible for the climate emergency have so far pledged a combined total of just over $700m (£556m) to the loss and damage fund – the equivalent of less than 0.2% of the irreversible economic and non-economic losses developing countries are facing from global heating every year.

In a historic move, the loss and damage fund was agreed at the opening plenary of the first day the Cop28 summit in Dubai – a hard-won victory by developing countries that they hoped would signal a commitment by the developed, polluting nations to finally provide financial support for some of the destruction already under way.

But so far pledges have fallen far short of what is needed, with the loss and damage in developing countries estimated by one non-governmental organisation to be greater than $400bn a year – and rising. Estimates for the annual cost of the damage have varied from $100bn-$580bn.

The present commitments are shown in Figure 4. The overall commitments, especially those of the United States, look pathetic.

graph of pledges to un climate funds COP28
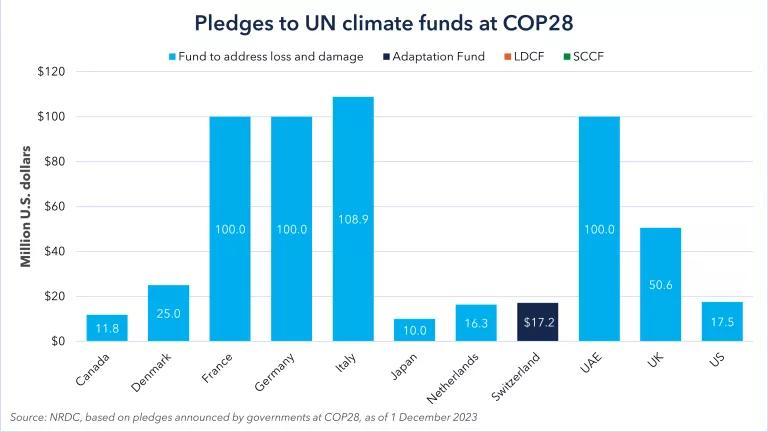
Figure 4 – Pledges to UN climate funds at COP28 (Source: NRDC)

However, close to the beginning of the meeting, VP Harris from the US made a much more adequate commitment

DUBAI, Dec 2 (Reuters) – The United States has pledged $3 billion to the Green Climate Fund, Vice President Kamala Harris said on Saturday in Dubai at the U.N. COP28 climate summit.

The fund, with more than $20 billion in pledges, is the largest international fund dedicated to supporting climate action in developing countries.

The latest pledge, which Reuters was first to report, would be additional to another $2 billion previously delivered by the United States.

It turns out that there is more than one fund dedicated to helping developing countries adapt and mitigate the impacts of climate change. The Green Climate Fund mentioned by VP Harris is the largest. The pledges to that fund as of April 2023 are shown in Figure 5; they do not include the COP28 pledge by VP Harris.

graph of countries' pledges and contributions to the Green Climate Fund

Figure 5 – Pledges and contributions to the Green Climate Fund (Source: NRDC)

Details about the activities that various funds are financing and the management of those funds will be discussed in future blogs. In next week’s blog, I will detour from this issue to address the important topic of how academic campuses are handling the current war situation in the Middle East.

Posted in Climate Change, COP | 7 Comments

My Full-Scale Global Focus

A hand holds a mini globe

(Source: Ismail Sadiron/EyeEm/Getty Images via Harvard Business Review)

Things are happening around each one of us on all scales; we better pay attention. Two weeks ago (November 21st), I started a series of blogs focused on what I can do after my approaching retirement in order to continue to be productive (for my sake–not for the sake of the world, although the two are loosely interconnected). I was hoping to get some input from you about these decisions. My focus, in my two previous blogs on the issue, was on using the IoT (Internet of Things) to help retrofit old infrastructures such as housing, schools, and hospitals in a way that aids with environmental mitigation and adaptation to climate change. When I raised such issues with colleagues and friends, I got answers in the form of  “You don’t need IoT for such use and you don’t need to give advice to anybody about how to use it; just try to improve the insulation of the structures to get more economical heating and cooling.” I think that we can do better.

Taking housing as a relatively “simple” example, actions such as improving insulation are helpful. However, better insulation doesn’t equip a building for the quick resilience needed in response to high-frequency or time-sensitive events. Depending on occupancy (leaving for the weekend or having emergency guests) and major weather events, our energy needs shift. We need economical ways to quickly and efficiently adapt to these changing circumstances. I think that the key IoT technology that can help here is “smart” energy metering. Such technology exists today, but it needs major improvements (many of which are probably already on the way). I thought that I would use this blog to focus on this technology.

However, as usual, current events intervened enough to convince me to change my plans. So, today I’m refocusing on the changing reality that affects me, and I’ll return to the issue of changing technology in future blogs when reality feels a bit more settled. In this decision I was driven by the following reality changes:

The first three subjects, with the links included, are now global events that have a major impact on me but on which I can not have any meaningful impact. I am left with a need to explain the connection between those three and the last one on the list, over which I do have influence.

The two climate-related courses that I taught this semester have a common element in their structure, resulting in an important common element in their final examinations. The first half of the semester is dedicated to the basic interdisciplinary background of climate change. Neither of these two courses has prerequisites, so it is my responsibility to fill this gap. The second part of the semester is dedicated to presenting developments based on recently published material. Recent reports probe their comprehension not through their text but through their data presentation. I give students a choice of two out of four graphs on different topics and ask them to write everything they know about the context of the data. This semester’s report is a recent one from IEA (International Energy Agency). It attracted considerable attention with its predictions that 2030 will see the peak of global fossil fuel use, after which renewable and nuclear energies will take over to complete the global energy transition. It is a long (350 pages), comprehensive report with many sections and figures. To avoid being hated by my students, I am limiting the scope of the final to only a small, manageable list of sections. The key question in such a report, on which I spend some time in class, is how the report tries to predict the future. This report uses three scenarios to try to predict the future of global energy use. The three scenarios are abbreviated as STEPS, APS, and NZE, and their  definitions are given below:

  • STEPS – The Stated Policies Scenario (takes into account the measures that have actually been put into effect or are at least being implemented in order to achieve announced energy and climate policy goals).
  • APS – The Announced Pledges Scenario(takes into account all climate commit­ments made by governments worldwide, including the Nationally Determined Contributions (NDCs)).
  • NZE – The Net Zero Emissions by 2050

The NZE scenario is self-explanatory: achieving global completion of the energy transition away from net carbon emissions.

graphs comparing use of different fuels according to scenarios

Figure 2 – Global total energy demand by fuel and scenario, 2010-2050

Figure 2, taken from the middle of the report, shows the essence of the report’s conclusions in terms of fossil fuels peaking around 2030 and the differences in using the three scenarios as predictive instruments. One concrete example of the sensitivities of the predictive tools is in territory familiar to all of us – the changes in governments and policies that have taken place between the Paris COP21 meeting in 2015 and now. At least in democratic governments, changes in governments can lead to relatively high-frequency changes in policies that often lead to starkly different futures in which changing building insulation will not help much and IoT is needed for a faster response. Future blogs will expand on this topic.

COP28 started officially last Thursday, November 30th, and is scheduled to conclude next week, on Tuesday, December 12th  (the same day as next week’s blog post). The finals for the two climate-related courses are scheduled for December 18th and 19th. The final decisions of the COP28 meetings will be adopted at the conclusion of these meetings. Almost all available public communications tools are now full of news and information about climate change and I strongly encourage my students to follow as much of it as they can. To help in this, I am modifying my rules for their final to include one graph generated through the COP28 meetings. Next week’s blog is designed to help them prepare by providing some graphs that will be among the possible choices in the final.

One of the two courses in which we discuss climate change is targeted at honor students as part of their requirements. The second half of this honors course is to research whether students can (or are willing to) help to introduce the Climate Action Plan into the now-updated College Strategic Plan in my school. To help the students in their project I wrote 4 blogs starting on October 10th, this year, that address some aspects of this issue. Such an effort is part of the more general concept of using campus changes as a laboratory for various courses that I discussed in earlier blogs (search for Campus as Lab).

On October 7th this year, an attack by Hamas on Israel resulted in 1,200 Israeli deaths (mostly in Israeli villages not far from Gaza), and the kidnapping of more than 200 Israelis. Not surprisingly, Israel has retaliated with its full force, with three stated objectives: returning the kidnapped Israelis, destroying Hamas as a military and governing organization, and restoring security to Israel. The retaliation has included massive bombardments that have killed thousands of Gazans. It is not surprising that these events have raised massive demonstrations throughout the world, with major participation on university campuses. My campus is no exception.

My background during the Holocaust has been described in earlier blogs. In September 1945, immediately after WWII, I went to Israel (British Palestine at the time) as a refugee. I grew up there, all my formal education was acquired there, and I have friends and family there. I care for Israel but I never included political discussions in my class and almost never mentioned the conflict in my classes. The distance between Gaza and NYC is close to 6,000 miles (more than 9,000 km) yet, almost every student has a strong opinion about the situation. Many of them have joined demonstrations for one side or another. The resolution of this conflict will have no direct impact on most of their lives. Mitigation and adaptation of anthropogenic climate change, on the other hand, will have a strong impact on the lives of almost all students, worldwide. My question to my students was whether they could find and mobilize some of the same political enthusiasm that they show for the remote conflict between Israel and Hamas to help minimize the impact of climate change. I will report the answer to this question after the end of the semester.

Posted in Climate Change, COP, Sustainability | 4 Comments

Retrofitting: The Internet of Things

Graphic of devices included in the Internet of Things

(Source: Global Sign)

One obvious distinction between retrofitting (see last week’s blog) and repairing or fixing, is the growing attempt to repurpose new technologies into existing infrastructure. The novelty of these emerging capabilities is not waiting until the infrastructure breaks down. In many cases, the potential benefits of incorporating emerging technologies into “perfectly” functional “old” infrastructures justify the expenses. Such incorporations have been labeled the Internet of Things (IoT). I did a Google search, and AI compiled the following:

The Internet of Things (IoT) is a network of physical objects that are connected to the internet. These objects are embedded with sensors, software, and other technologies that allow them to collect and share data. The purpose of IoT is to connect devices and objects so they can be remotely monitored and controlled.

The following examples come from the same source:

  • Connected cars
  • Smart appliances
  • Connected security systems
  • Smart agriculture equipment
  • Connected retail
  • Connected healthcare monitors
  • Connected manufacturing equipment
  • Connected cities
  • Digital personal assistants like Alexa, Siri, and Cortana

IoT devices can include mechanical and digital machines, Consumer objects, Televisions, Security cameras, Exercise equipment.

Some history of this recent concept is given below:

The main concept of a network of smart devices was discussed as early as 1982, with a modified Coca-Cola vending machine at Carnegie Mellon University becoming the first ARPANET-connected appliance,[13] able to report its inventory and whether newly loaded drinks were cold or not.[14] Mark Weiser‘s 1991 paper on ubiquitous computing, “The Computer of the 21st Century”, as well as academic venues such as UbiComp and PerCom produced the contemporary vision of the IOT.[15][16] In 1994, Reza Raji described the concept in IEEE Spectrum as “[moving] small packets of data to a large set of nodes, so as to integrate and automate everything from home appliances to entire factories”.[17] Between 1993 and 1997, several companies proposed solutions like Microsoft‘s at Work or Novell‘s NEST. The field gained momentum when Bill Joy envisioned device-to-device communication as a part of his “Six Webs” framework, presented at the World Economic Forum at Davos in 1999.[18]

The concept of the “Internet of things” and the term itself, first appeared in a speech by Peter T. Lewis, to the Congressional Black Caucus Foundation 15th Annual Legislative Weekend in Washington, D.C., published in September 1985.[19] According to Lewis, “The Internet of Things, or IoT, is the integration of people, processes and technology with connectable devices and sensors to enable remote monitoring, status, manipulation and evaluation of trends of such devices.”[20]

Often, IoT devices come with the descriptive title of “smart.” We will meet a few examples as we go along.

Recently, I did a webinar about the matter; I hope to continue involvement with the concept.

A cost benefit analysis is absolutely essential for retrofitting any well-functioning infrastructure with new technology. One good example where such an analysis was missing is the marketing of smart toasters. This toaster is listed for around $400; even so, it already has 255 ratings on Amazon.

My emphasis going forward will probably be focused on applications that adapt existing infrastructure and repurpose space and resources to further environmental efforts. This means things that help to minimize waste, minimize energy intensity (ratio of energy use to produce a desired product), and participate in the global energy transition. All of these actions and applications come under the close scrutiny of tight cost benefit analyses aimed at resilience against disasters. A good example of such an effort is the relatively recent development of smart thermostats:

Smart thermostats are Wi-Fi thermostats that can be used with home automation and are responsible for controlling a home’s heating, ventilation, and air conditioning. They perform similar functions as a Programmable thermostat as they allow the user to control the temperature of their home throughout the day using a schedule, but also contain additional features, such as sensors and Wi-Fi connectivity,[1][2] that improve upon the issues with programming.

Like other Wi-Fi thermostats, they are connected to the Internet via a Wi-Fi network. They allow users to adjust heating settings from other internet-connected devices, such as a laptop or smartphones. This allows users to control the thermostat remotely. This ease of use is essential for ensuring energy savings: studies have shown that households with programmable thermostats actually have higher energy consumption than those with simple thermostats because residents program them incorrectly or disable them completely.[3][4]

Smart thermostats also record internal/external temperatures, the time the HVAC system has been running and can notify the user if the system’s air filter needs to be replaced. This information is typically displayed later on an internet-connected device such as a smartphone.

Smart thermostats, which can be checked and adjusted from a distance, are capable of minimizing energy use, taking into account the specific needs, conditions, and limitations of the host building (regulating temperature based on how many people are there, varying weather, insulation, etc.).

Next week’s blog will explore more examples, including smart electricity meters.

Posted in Climate Change | 6 Comments

Approaching Retirement

Signpost with the word Retirement

(Source: Piermont Wealh Management)

To the followers of this blog (starting in April 2012) this title will not be a surprise. I am an old guy and I am seriously thinking about retirement, meaning that I am starting to think seriously on what I will do after retiring. All of this, provided of course, that my health allows me to remain productive. Whatever I will have the opportunity to do, I would like to continue posting about my take on reality on this blog. The difficulty is that much of my thinking and writing here has focused on my teaching and my students. The question that I am asking myself is what I will use to replace this anchor.

A quick look at the statistics of this blog since its inception gives the following numbers:

  • 610 blogs since Earth Day 2012
  • 1618 posted comments (and another 965 in my spam queue)
  • 933,416 visitors with 5,808,384 visits

These are impressive numbers that I would hate to lose. In this and future blogs, I will start, with your help, to expand on a new topic. Right now, my thinking is focused on retrofitting. Below is the Wikipedia definition:

Retrofitting is the addition of new technology or features to older systems. Retrofits can happen for a number of reasons, for example with big capital expenditures like naval vessels, military equipment or manufacturing plants, businesses or governments may retrofit in order to reduce the need to replace a system entirely. Other retrofits may be due to changing codes or requirements, such as seismic retrofit which are designed strengthening older buildings in order to make them earthquake resistant.

Retrofitting is also an important part of climate change mitigation and climate change adaptation: because society invested in built infrastructure, housing and other systems before the magnitude of changes anticipated by climate change. Retrofits to increase building efficiency, for example, both help reduce the overall negative impacts of climate change by reducing building emissions and environmental impacts while also allowing the building to be more healthy during extreme weather events. Retrofitting also is part of a circular economy, reducing the amount of newly manufactured goods, thus reducing lifecycle emissions and environmental impacts.

From my perspective, the term retrofitting has come to encompass a much broader range than what is included in the relatively narrow definition of Wikipedia. The world is fast-changing and all of us must adapt. The Wikipedia description provides useful examples of retrofitting; however, it doesn’t emphasize the important distinction between retrofitting and repairing or fixing. The distinction rests in repurposing, which is an essential element of retrofitting. I will elaborate on this issue and on the requirements in both repairing and retrofitting to be cost effective, in future blogs. However, the fast-changing climate, and other environmental impacts, constitute an important element in the Wikipedia definition that will allow me to refocus my anchor and maintain the present flavor of the blog. I will lose the immediate feedback of students but hopefully will be able to replace it with other audiences. Hopefully, focusing on retrofitting will allow me to work to scale, meaning to start (or finish) at the global scale and converge on immediate targets with expectations of some feedback.

Housing is a good starting point for such an effort. Put campus into the search box and you will get about 55 blog entries. Many of these blogs, at the time of posting, were sent to my college administrators, Faculty Council committees that I happened to serve on at the time, and my students in courses related to climate change. If you go over some of these blogs, you might see students’ comments. Changes in energy use in housing to minimize carbon emissions New York were mandated both by NY State and City (see the June 25, 2019 blog).

It is reasonable to expect that university campuses will lead the way in these efforts. One of the main problems that campuses everywhere face is that most of their buildings are old. In a blog this summer (June 6, 2023), I described a small symposium that I organized during last summer’s Faculty Day, which we celebrate every year at the end of the Spring semester. The symposium was focused on the use of Campus as a Lab in our curriculum. A faculty member from the Health and Nutrition Department gave a talk about opportunities to incorporate environmental considerations when we construct new facilities. With declining enrollment, however, new facilities are rare. To have an impact, we have to focus on standing facilities and learn how to retrofit them.

Examples of retrofitted housing emerged after global environmental disasters. These will probably stay with us, removed from environmental considerations, in the face of other disasters that can now be found hitting many cities around the world. One of the broader social consequences of the COVID-19 pandemic directly resulted from one of the widely-used adaptation tools. It was focused on major advances in computer ability to work remotely through peer-to-peer software advancement in videotelephony and chat services. The most famous company in this effort is Zoom, which took its name from the corresponding verb. The company was formed one year before I started this blog and got its name in 2012, around the same time that this blog started. To appreciate the growth of Zoom’s use, one needs superlatives that don’t exist in the English language (see this page of Zoom statistics for some numbers). Not surprisingly, video-telephoning and video-chatting hasn’t stopped with the ebbing of COVID-19. The development and omnipresence of videoconferencing has enabled a massive number of workers to work from home. The Forbes report cited below summarizes the situation in the US:

As of 2023, 12.7% of full-time employees work from home, while 28.2% work a hybrid model

Currently, 12.7% of full-time employees work from home, illustrating the rapid normalization of remote work environments. Simultaneously, a significant 28.2% of employees have adapted to a hybrid work model. This model combines both home and in-office working, offering flexibility and maintaining a level of physical presence at the workplace [1].

Despite the steady rise in remote work, the majority of the workforce (59.1%) still work in-office [1]. This percentage underscores the fact that while remote work is on an upswing, traditional in-office work is far from obsolete.

By 2025, 32.6 million Americans will work remote

Looking ahead, the future of remote work seems promising. According to Upwork, by 2025, an estimated 32.6 million Americans will be working remotely, which equates to about 22% of the workforce [2]. This projection suggests a continuous, yet gradual, shift towards remote work arrangements.

98% of workers want to work remote at least some of the time

Interestingly, workers’ preference for remote work aligns with this trend. A staggering 98% of workers expressed the desire to work remotely, at least part of the time [3]. This overwhelming figure reflects the workforce’s growing affinity towards the flexibility, autonomy and work-life balance that remote work offers.

At the tail-end of the pandemic, as much of the focus has shifted to local wars in the Middle East and Ukraine, the rich world is experiencing other difficulties. We are dealing with instabilities in the supply chain as well as in the energy markets. These have led to a major increase in inflation, together with major shortages and budget difficulties in developing countries. Central banks are fighting inflation with major increases in interest rates. These trends are being accompanied by population decreases in many developed countries and a decline in population growth in the developing world.

Owners of apartments or homes are holding onto existing real estate that they can finance with long-term low mortgages. However, most people who don’t own real estate cannot buy any because of high prices and expensive mortgages that they can ill-afford. A serious economic stress is developing between commercial and residential real estate. We need less of the first and more of the second. We have to start refocusing on retrofitting commercial real estate to make it desirable in the residential market.

To give some idea about just how much extra commercial real estate there is, one article from this month said that:“In Manhattan, 22 percent of office space was vacant last quarter, or about twice the rate of empty space before the pandemic…”

The idea of retrofitting is to make something that is no longer efficiently serving its original purpose work better in a new context. This is a different way of saying that people will benefit more from the retrofitted product than from the original and the effort should be cost-effective, meaning that the cost of the retrofitting should not exceed the benefits or profits from the action. This economic analysis doesn’t have to be restricted to the immediate parties that are involved in the process. Society can mandate the retrofitting to benefit society at large. Most environmental retrofitting falls into this category. In future blogs, I will try to come up with some quantitative examples.

Posted in Climate Change | 6 Comments

Trying Times and the Approaching Judgements: Part 2

Last week’s blog focused on the global impact of the deteriorating weather in rich and poor countries and the results that such deteriorating weather have on the most vulnerable both in the US and developing countries. This blog is focused on some of the most important financial results of such impacts.

Losses in developed countries:

When extreme weather hits, it causes destruction of property and life. After the calamity is over, we need to rebuild. Recently, the US Treasury Department published a report on the extent of the economic damage to American households expected from the accelerated impacts of climate change. The outline of this report is given below:

  • Households can experience significant financial strain through pressures to their income and expenses.

    • Reduced earning and access to employee benefits.
    • Damage and destruction to property
    • Increased spending on transportation.
    • Added healthcare costs. 
    • Higher expenditures on utilities.
  • Climate hazards can impact households’ ability to manage losses, expenses, and transactions using financial products and services such as credit, insurance, and payments.
    • Challenges accessing funds. 
    • Insurance gaps. 
    • Reduced availability and increased cost of credit. 

Across the U.S., many areas projected to have high future exposure to climate hazards also overlap significantly with areas in which the underlying populations may be particularly vulnerable to financial hardship. An analysis in the report finds that half of U.S. counties – populated by millions of Americans – face heightened future exposure to at least one of the three significant climate hazards described in the report: flooding, wildfire, or extreme heat. In addition, approximately one-fifth of all U.S. counties face both elevated vulnerability and elevated future exposure to these climate hazards.

The report profiles three regions in the country to illustrate the potential impact of major climate hazards:

  • Flood exposure in Appalachia
  • Wildfire exposure in border regions between the U.S. and Mexico
  • Heat exposure in the Mississippi Delta

If you need further details on any of these entries, you can go to the original report.

Rebuilding after the impact of a destructive weather event requires resources. The free enterprise system is based on the principle that the destructive impacts are relatively rare and random. Insurance companies generally operate on this principle, allowing them to charge a relatively small amount of money from the many, pay out large amounts of money to the impacted few, and leave some of this balance for profit. When this balance breaks down, the insurance companies lose money. If the insurance companies estimate that circumstances in the future will not get better and are likely to get worse, they close up shop. This is what is now starting to happen in some states in the US:

Faced with growing losses from hurricanes, floods and wildfires, major insurance companies are pulling out of California, Florida and Louisiana — a shift that threatens to undermine the economies of those states.

Now Senate Democrats are demanding that insurers tell them which places could be next.

On Wednesday, the Senate Budget Committee sent letters to 40 insurance companies, seeking documents that show where in the country those insurers have begun dropping customers, or are considering it. The committee, which has subpoena power, has given the companies until Nov. 17 to respond.

“Climate-caused uninsurability has the potential to trigger cascading failures that undermine our entire economy,” Senator Sheldon Whitehouse, Democrat of Rhode Island and the committee chairman, said in a statement. “With this investigation, we are seeking information about where the dominoes may fall next.”

Banks typically require insurance when writing a mortgage. If insurance becomes unavailable in a particular community, it becomes hard for most potential buyers to purchase a home, leading to a drop in real estate values.

Skeleton sits in lounge chair with a cocktail, next to a sign that says, "Just waiting for the insurance check."

(Source: Palm Beach Post)

Yet, in spite of experiencing the highest threat from climate-based destruction, and forcing the insurance industry to give up on the state, Florida is experiencing the highest population growth in the US. Miami and Tampa are experiencing the highest Case-Shiller home price rise (see November 1, 2022 blog).

Losses in Developing Countries:

When climate change causes destruction and losses in most developing countries, the situation is more complex. A year ago, immediately after the conclusion of COP27 in Egypt, I started a short series of blogs on one of the central issues that was discussed in that meeting: the loss and damage fund (November 29, 2022). That meeting decided (unanimously) that the rich, developed countries would help financially poor countries to mitigate climate damage. It was decided that this year would serve as the time to figure out the details of the payments. This preparation period is now over, and we are about to start COP28 in the UAE (United Arab Emirates). Deliberations took place and the conclusions were posted recently. Below is a brief synopsis:

BENGALURU, India (AP) — Tense negotiations at the final meeting on a climate-related loss and damages fund — an international fund to help poor countries hit hard by a warming planet — ended Saturday in Abu Dhabi, with participants agreeing that the World Bank would temporarily host the fund for the next four years.

The United States and several developing countries expressed disappointment in the draft agreement, which will be sent for global leaders to sign at the COP28 climate conference, which begins in Dubai later this month.

The U.S. State Department, whose officials joined the negotiations in Abu Dhabi, said in a statement it was “pleased with an agreement being reached” but regretted that the consensus reached among negotiators about donations to the fund being voluntary is not reflected in the final agreement. The agreement lays out basic goals for the fund, including for its planned launch in 2024, and specifies how it will be administered and who will oversee it, including a requirement for developing countries to have a seat on the board, in addition to the World Bank’s role.

Not everybody is happy. A recent op-ed from Africa, the host of the largest concentration of indebted developing countries is shown below:

When poor countries are forced to default on their foreign debt, as Ghana and Zambia have done, they pay a heavy price. Cut off from credit of any kind, spending on health, education and dealing with the damaging effects of climate change comes to a juddering halt.

Countries in the West often plead with us to invest in the kind of ambitious resilience projects we need to survive in a warming world. But in Africa, we can’t fix the climate issue unless we fix the debt issue. Of the 52 low- and middle-income countries that have defaulted on their debts or have come close to it in the last three years, 23 are in Africa. The continent’s debt burden is skyrocketing as a result of factors beyond its control: the aftershocks of the pandemic, rising fuel and food prices, higher interest rates and climate catastrophes that weaken our economies and sap our ability to repay creditors.

During the pandemic, rich countries pumped trillions of dollars into their economies to support families and businesses. African governments had no such option. Instead, their leaders kept their nations afloat by taking on more debt, which turned out to be a very expensive life raft. As a result of rising interest rates, Africa’s debt repayments will surge to $62 billion this year, up 35 percent from 2022.

To put this figure into context, Africa is now paying more in debt service than the estimated $50 billion a year the Global Center on Adaptation says it needs to invest in climate resilience. These investments are not nice-to-haves — they are vital for building roads, bridges and dams that can withstand torrential rains and floods. Failure to do so is to invite catastrophe, as the recent floods in Libya so tragically attest.

But instead of receiving funds to address the climate crisis, Africa is borrowing at a cost up to eight times higher than the rich world to rebuild after climate catastrophes. This is why Africa urgently needs a pause in debt repayments so that it can prepare for a world of ever greater climate extremes. The Annual Meetings of the International Monetary Fund and the World Bank in Marrakesh, Morocco, that begin Monday are a good place to start.

Since the COP meetings require unanimous decisions, the unhappiness of many developing countries could paralyze any new measures—to the degree that these important annual meetings could become irrelevant to mitigating global climate change, leaving both rich and poor countries in danger. Stay tuned.

Posted in Climate Change | 2 Comments

Trying Times and the Approaching Judgements: Part 1

Figures 1 and 2 show the countries and US states most affected by climate change. This blog is focused on the criteria that are used for this ranking, while the next blog will focus on some of the list’s immediate consequences.

Infographic of Top 10 countries most vulnerable to climate change: DRC, CAR, Nigeria, Chad, Ethiopia, Bangladesh, Syria, Afghanistan, Somalia, South Sudan
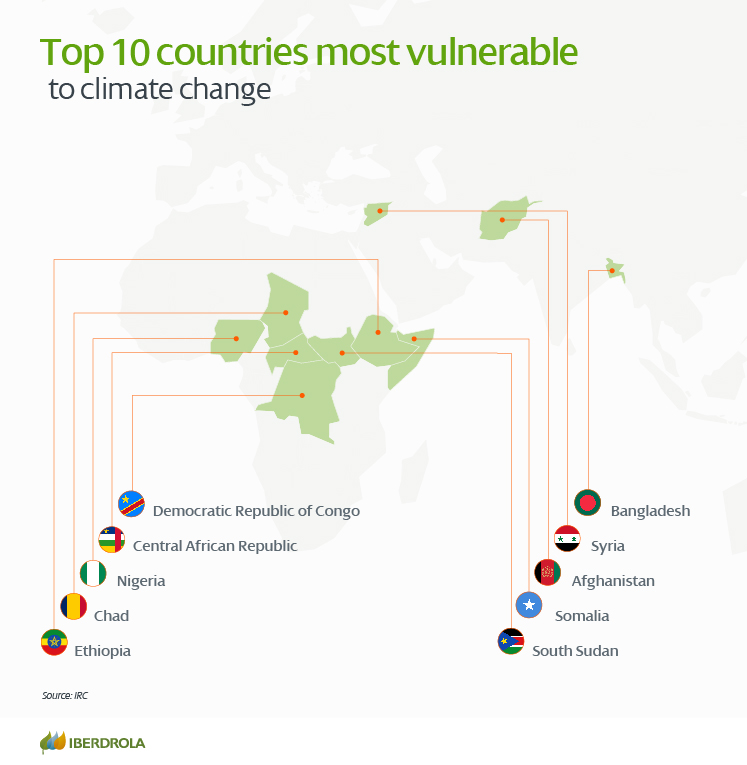
Figure 1 – The 10 countries most threatened by climate change in the 21st century (Source: IRC via Iberdrola)

The link below Figure 1 defines and describes the background of the countries’ rankings, as defined during the COP27 meeting. Defining these vulnerabilities was both difficult and controversial, as summarized in the paragraph below:

The vulnerability criteria provoked controversy between one side, consisting of China and emerging countries, and the other, consisting of the European Union. The problem stemmed from what was considered vulnerable to the effects of climate change and therefore who should receive support from the international community. Because of this debate, it is necessary to investigate which countries are most likely to be affected in the event of a climate disaster, with no chance of recovery. Cases such as the United States or Australia, where phenomena usually cause adverse effects, but because they are countries that have the capacity to respond, are ruled out by studies related to vulnerability.

Per definition, the most vulnerable countries are developing countries that have no means of mitigating the inflicted damage. Details about the specifics of the vulnerabilities of these countries can be found in the original publication.

An alternative list of the most affected countries is given by Germanwatch and is summarized in Table 1:

Table of 10 most affected countries in 2019: Mozambique, Zimbabwe, Bahamas, Japan, Malawi, Afghanistan, India, South Sudan, Niger, Bolivia
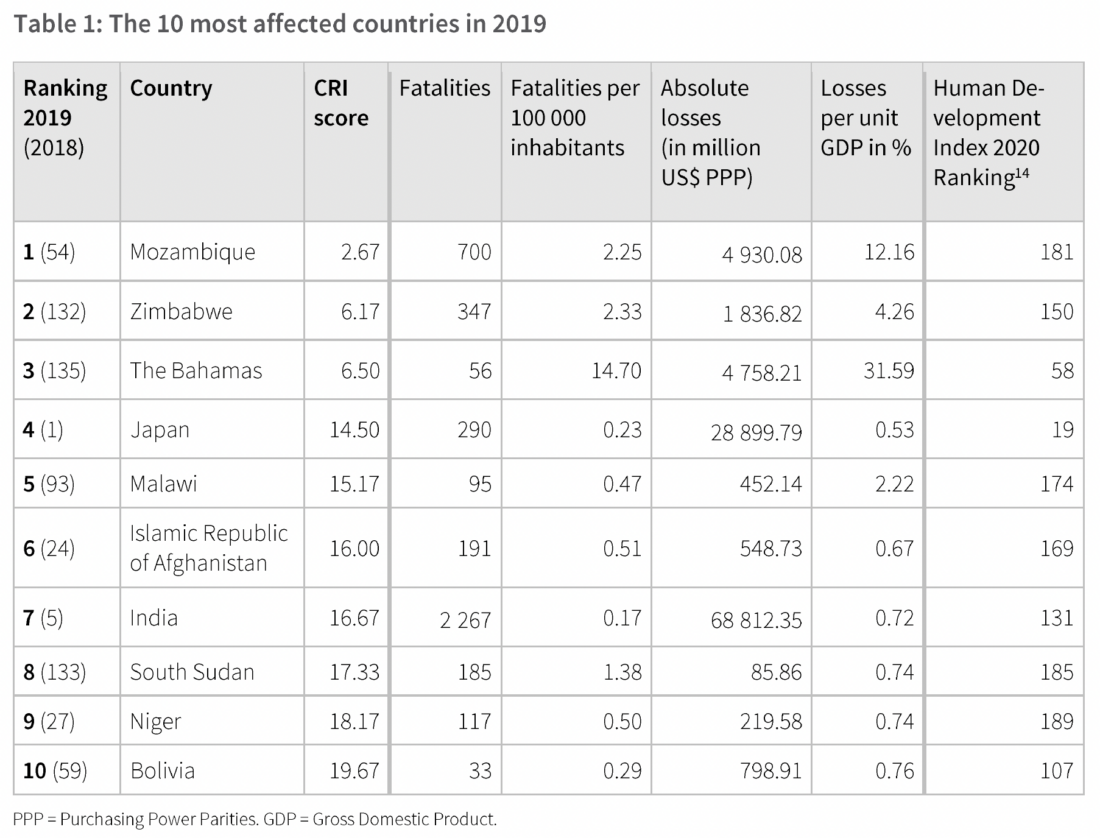
This ranking is independent of the ability to mitigate the damage, but with one exception (Japan) also includes only developing countries. This ranking is based on the Global Climate Risk Index (CRI), summarized below from the Germanwatch Global Climate Risk Index 2020:

The Global Climate Risk Index (CRI) developed by Germanwatch analyses quantified impacts of extreme weather events9 – both in terms of fatalities as well as economic losses that occurred – based on data from the Munich Re NatCatSERVICE, which is considered worldwide as one of the most reliable and complete databases on this matter. The CRI examines both absolute and relative impacts to create an average ranking of countries in four indicating categories, with a stronger emphasis on the relative indicators (see chapter “Methodological Remarks” for further details on the calculation). The countries ranking highest (figuring in the “Bottom 10”10) are the ones most impacted and should consider the CRI as a warning sign that they are at risk of either frequent events or rare, but extraordinary catastrophes.

The CRI does not provide an all-encompassing analysis of the risks of anthropogenic climate change, but should be seen as just one analysis explaining countries’ exposure and vulnerability to climate-related risks based on the most reliable quantified data available – alongside other analyses. 11 It is based on the current and past climate variability and – to the extent that climate change has already left its footprint on climate variability over the last 20 years – also on climate change.

Another ranking in the same publication is focused on long-term climate risk. The 10 most vulnerable countries in that list are also developing countries.

Map of US states average climate change risk index score by region

Figure 2 – Map of US states average climate change risk index score by region
(Source: SafeHome.org)

The methodology used in drafting Figure 2 is summarized at the end of the original article on SafeHome.org and is quoted below:

All of the data used in our analysis came from the excellent work of Climate Central and a site it maintains, States at Risk, which is a clearinghouse of data and analysis related to the impacts of climate change on the states. We excluded Alaska and Hawaii from our analysis because not enough data was available for either one to draw fair comparisons.

The site lists dozens of impacts for states and, often, multiple cities within the states, but the factors we included in our Climate Change Risk Index were:

  • Increased mosquito season days, 1980s to today
  • Dangerously hot days by 2050 (days with heat index of at least 105 degrees) in state or largest city
  • Percentage of people vulnerable to extreme heat
  • Increase in severity of widespread summer drought, 2000-2050
  • Percentage of people currently affected by inland flooding (percentage living in 100-year floodplain)
  • Increase in days with high wildfire potential, 2000-2050
  • Percentage of population at elevated wildfire risk
  • Percentage of people currently affected by coastal flooding (percentage living in 100-year coastal floodplain)

The data for each state was ranked from best to worst, and each state’s rank in all the categories were added together to create the overall ranking in which lower scores equate to lower risk from climate change.

The approaching “judgments” of these vulnerabilities will be discussed in the next blog. In a series of blogs that started on September 12th and ended on October 3rd, I focused on related issues such as developed countries’ commitments to mitigate their climate change losses and insurance companies’ adaptations to the selective vulnerabilities and losses brought about by climate change. I had to interrupt that series with a few blogs specific to academic institutions to help my students contribute to the discussions of these issues. With this blog and a few continuing blogs, I will return to the issue of global vulnerabilities.

Posted in Climate Change | Tagged , , , , , , , , , , , , , , , , , , , , , , | 8 Comments

This Might Not be the Best Answer to Our Enrollment Crisis

A poster of four students of varying races and genders sitting on a set of steps. From left to right, they hold: a tambourine, a video game controller and headset, a measuring tape, and a microphone. The text at the top says, "Find Your Club or Start Your Own. Bachata. E-Sports. Fashion. K-Pop. We've got it all. A degree for every dream. Apply Now CUNY The City University of New York"
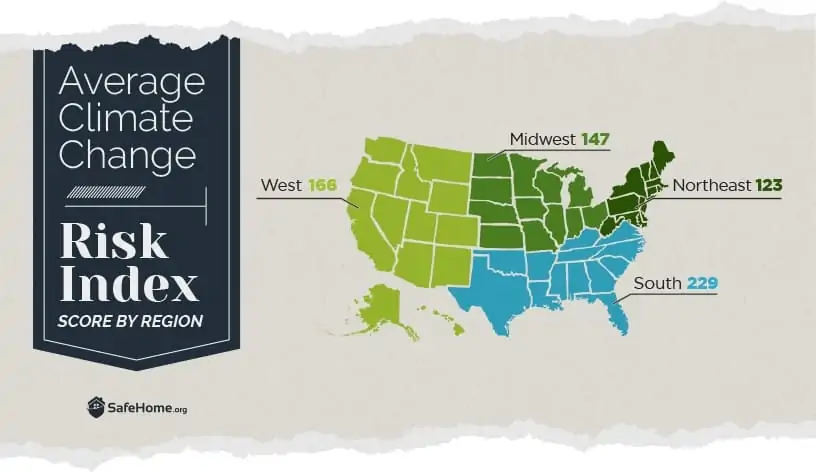
Figure 1 – A subway ad for for CUNY highlighting different clubs

The other day, on my way to work, I was staring at an ad that was posted on the wall of the train (Figure 1). I got interested and I took a photograph of it. The next day, I took the subway again to work and advertisements like that above and that shown in Figure 2 were posted throughout the car. I went to Google and checked for images matching the phrase “A degree for every dream.” I got a handful. Most of them promised a good, productive time for students attending CUNY at very competitive prices.

A female-presenting Asian student and a male-presenting African American student wear blue caps and gowns and stand in front of a series of tall buildings. The text at the top says "CUNY The City University of New York Apply Now." Below, it says, "Degrees without the debt: 2.8K+ world-class programs across 25 colleges in NYC"Figure 2 – Another subway ad specifies the number of programs that CUNY runs

A few days back, I took part in my college’s faculty council meeting, where elected members of the faculty discuss college business. At the beginning of the meeting, approximately 50 students marched in, demanding the resignation of the president in the context of her perceived attitude toward a student demonstration about the Israel-Hamas war. The students cited a list of student clubs that agreed with them. Not many people knew how many students were in these clubs but the statement was taken as representing the student population. Not surprisingly, many other schools have found themselves in a similar situation, with Harvard getting the most publicity. Harvard’s president stated that neither a single club nor even 30 clubs could speak for the university as a whole.

A bit more relevant to many universities, including my own, was the budgetary necessity to adapt to the reality of decreasing enrollment. Some universities needed to close (mostly small, private, for-profit ones, but also some public, non-profit ones). Many also had to cut program availabilities. Running a school with decreased enrollment (September 27, 2022) was part of my earlier “campus as a lab” series of blogs and the topic (how to run a school under these conditions) was also incorporated into the curriculum of our School of Education.

More general coverage can be found in a Brookings article. The intro paragraphs and some examples of “solutions,” are given below:

Is college worth it? The public is increasingly skeptical. A Wall Street Journal/NORC poll this year found 56% of adults said a four-year college was “not worth the cost,” up from 40% in 2013. This perception is perhaps unsurprising given rising media and political attention to the negative consequences of student loan debt. The labor force is also relatively strong, even for workers with no college experience, making it costlier to pause or defer employment. Political discourse around college (and education broadly) has also become more partisan, with Republicans becoming increasingly skeptical around the value of college.

However, on average, college completion still pays off. College graduates earn more, experience lower unemployment, pay more in taxes, and are less likely to engage in criminal behavior. College graduates overwhelmingly believe college was a good personal investment. Despite these benefits, college enrollment has declined for years, with more dramatic drops since the onset of the COVID-19 pandemic. This post examines the root causes of declining enrollment and what policies can effectively encourage college enrollment.

Two proposed solutions are detailed in the article:

College enrollment efforts must go beyond high schoolers.

Cost remains key barrier—and solution—to enrollment.

Both solutions require structural changes and can be competitively applied to CUNY. However, neither of them is even hinted at in the ad campaign.

Below, one can find more details written by the Pew Research Center about enrollment efforts that go beyond high schoolers:

Several policy and market-based solutions have been promoted to address the loss of employment and wages forecast by technologists and economists. A key idea emerging from many conversations, including one of the lynchpin discussions at the World Economic Forum in 2016, is that changes in educational and learning environments are necessary to help people stay employable in the labor force of the future. Among the six overall findings in a new 184-page report from the National Academies of Sciences, the experts recommended: “The education system will need to adapt to prepare individuals for the changing labor market. At the same time, recent IT advances offer new and potentially more widely accessible ways to access education.”

Jobholders themselves have internalized this insight: A 2016 Pew Research Center survey, “The State of American Jobs,” found that 87% of workers believe it will be essential for them to get training and develop new job skills throughout their work life in order to keep up with changes in the workplace. This survey noted that employment is much higher among jobs that require an average or above-average level of preparation (including education, experience and job training); average or above-average interpersonal, management and communication skills; and higher levels of analytical skills, such as critical thinking and computer skills.

A greater variety of options to confront the declining trends is described by WICHE (Western Interstate Commission for Higher Education). Some productive outcomes are mentioned, as are many consequences:

While the COVID-19 pandemic accelerated the trend, declining enrollments have been negatively impacting institutional budgets for nearly a decade. For a deeper look into the reasons why college enrollments are declining, see our earlier post, College Enrollment: Cliffs, Shifts, and Lifts. Higher education institutions are responding to the ensuing financial instability in ways that are both predictable and creative. A surprising selection of colleges and universities are thriving despite the culling of institutions and programs happening around them. Below are some of the most common responses to declining enrollments.

Cutting programs

Some schools have chosen to cut programs as a way to shore up finances. The majority of these programs are deemed low-enrollment and fall within undergraduate humanities: mostly religious studies, philosophy, English, creative writing, languages, history, fine arts, and classics. However, social sciences and natural sciences are not exempt from being cut. Several schools have slated the elimination of sociology, economics, political science, geography, mathematics, environmental studies, and geology. Outside of the liberal arts, programs in risk include business, journalism/communication, education, nursing, and family & consumer sciences. Graduate programs recommended for phasing out largely reflect their undergraduate counterparts; while certificate programs being cut often are tied to specific skills and careers such as health studies, criminal justice, gerontology, speech and communication disorders, and hospitality management.

Additional consequences covered by the same publication are headlined below:

Cutting Personnel

Institutional Closings

Institutional Mergers/Consolidation

Resource Sharing

Expanding Online Offerings

New Admissions Strategies

Additional Funding

Poaching Students/Offering Safe Haven to Students

Thriving Despite Declining Enrollments

None of them (that I saw) mentioned why students should spend time right now to make their lives more productive. The poster in the opening picture from last week’s blog, “There are no jobs on a dead planet” still holds true.

Posted in Climate Change | 4 Comments

Student Impacts on College Priorities

Protester with an Earth costume holding a sign that says, "There are no jobs on a dead planet."(Source: ABC News: Andie Noonan via Greeneration Foundation)

College strategic plans reflect colleges’ priorities (put “college strategic plans” into the search box to review prior blogs). Reflecting on my own school, when the budget becomes tight, and there is a need to prioritize, the justification for the distribution comes out through the college strategic plan. In a federated college, such as most state schools and my own NYC school (CUNY), the prioritization has to follow the strategic plans of both the central administration and the college. A Climate Action Plan (you can also put this term into the search box) is one of the central issues that every organization needs to address. There is a great deal of activity by both students and faculty in my school in addressing environmental issues. But, as was mentioned earlier, a climate action plan is nowhere to be found in the official strategic plans of either CUNY or Brooklyn College, my campus. Our Senior Vice President for Finance and Administration also chairs our committee charged with formulating our new college strategic plan. He told a group of us that this document does not (and will not) include infrastructure priorities.

Meanwhile, you cannot address a climate action plan without addressing the sources of energy that power our schools; in federated universities, these energy sources are determined by the central university. As we will see below, CUNY, in its recent strategic plan, does address infrastructure, but it doesn’t require that the infrastructure include a climate action plan[. More than that, given that all our buildings belong to the central university, we cannot establish alternative energy sources on the campus without the agreement and support of the central university. But our students belong to the individual colleges and they are supposed to be the main users of the energy.

As was mentioned in the previous blog, student attendance is a big issue for many schools, including my own. Most colleges are doing their best to attract students and we are all looking for the best way to accomplish that. If the decline in enrollment continues, many colleges will fold. The top photograph tells the whole story. “There are no jobs on a dead planet.” If there will be no jobs in the future, students are trying to get the best from the present. One common way for colleges to attract students is to make the experience of present students as productive and pleasant as possible. Safety and health are prime considerations. The world is now in an upheaval with deadly regional conflicts between Russia and Ukraine, Hamas and Israel, and others. Most colleges have many students sympathizing with specific sides in these conflicts and often the college administrators are called to take sides. Often, the map of these conflicts can change on a daily basis and large groups of students are finding themselves in a position of weakness and are upset with their administrations for what seemed like helping the other side. This is not a productive atmosphere for learning and many students prefer to stay home.

Two weeks ago (October 10, 2023) I described the situation in my college (Brooklyn College) and my university (CUNY) in drafting our strategic plans. We found that the policy of my college was to draft its strategic plan after the university posted its own. The university just did so and my college has now assembled the team charged with drafting our plan.  It was mentioned that many in the selected committee have their own pet projects to advance and on the same line, in writing on this issue, I have my own “pet project,” which is climate change. I fully admit my “guilt.”

The CUNY strategic plan is drafted for the 2023-2930 time period and specifies 5 goals and a general commitment to increase enrollment. The goals and the commitment are given below:

  1. Improve Career Outcomes

  2. Reshape Student Success

  3. Streamline Student Transfer within CUNY

  4. Advance Public-Impact Research

  5. Maintain State-of-the-Art Facilities & Technology

Increasing Enrollment and Retention

General comment on the goals and the commitment:

To meet the ambitious targets outlined in the strategic plan, CUNY will publish detailed action plans each year that identify the concrete steps, metrics and progress being achieved annually for each goal. This multi-layered approach will provide the flexibility, creativity and discipline necessary to meet this exciting, vital period of change for the University.

To me, that paragraph is all-telling. It basically addresses present issues while avoiding trying to address the long-term issues that our students are certain to face. The missing climate action plan is a good example. Students who consider coming to us are planning on a 4-5 year stay that will help them navigate changing environments. Teaching how to navigate new environments is the main job of universities. What can our students do to have an impact on college priorities while also preparing themselves for emerging job opportunities in a changing environment?

As I have mentioned often in this blog, I am an old guy on the verge of retirement. The students that we teach, and those that we want to attract, have their lives in front of them and they expect the college and the faculty to help them navigate the rest of their lives in a productive way.

Last week’s blog had AI define what students can do to advance climate action plans. The result was not satisfying. All the given examples were focused on sustainability-related parts of courses that they are taking. These kinds of examples are now common in almost all classrooms. It’s difficult to teach almost anything without using sustainability-related topics. There was no example of students exercising their influence on their own administration to form and execute a productive action plan. I wrote about it extensively this year. Just put the “student role” into the search box and see what you get.

You can find a productive example in the blog from April 18th of this year, titled “Teaching Students to be Involved in Energy Transition.” It recommends following productive practices in their community and asking the persons who initiated the practice to write a short description that will be published either on a local blog or in the student newspaper that almost every campus has available.

On the same line, students can inquire about student activities at other campuses (local and international) and publish their findings in the same venues.

I wrote before about legislation both in New York State and in NYC on reducing carbon content in the energy used in large buildings (June 25, 2019). Progress has to be significant starting next year. To handle such activities most relevant buildings are in need of “energy experts” that can coordinate the effort. This is a future job opportunity that students can be encouraged to prepare for—either as their main job or as a side gig.

I will end this blog with two important opportunities for students to get involved that were not mentioned earlier:

  1. Changing culture of the university to redirect Students Technology Fund.

 Below is the background of this fund:

Student Technology Fee Spending Plans

In 2003, the CUNY Board of Trustees adopted legislation requiring students to pay an annual technology fee. The revenues generated by the fee are to be used by the colleges to enhance opportunities for students to use current technology in their academic studies and to acquire the knowledge and skills that the modern, information-centered world requires.

Each year, a committee composed of administrators, faculty and students, chaired by the Provost , solicits suggestions from the college community and prepares a plan for the use of the technology fee funds. The plan is submitted to the Chancellor for approval. Brooklyn College’s advanced use of technology enables the committee to both pursue more advanced goals and concentrate on projects that build on mature foundations.

Approved projects are expected to further the college’s goals of: expanding student access to computing resources, improving computer-based instruction, improving support for students using college computers, improving student services, and using technology to enrich student life on campus. These goals should now only make college life more enjoyable, but also provide Brooklyn College students with an edge as they enter the job market or move on to postgraduate studies.

Over the last 20 years, computer technology has developed to underpin every educational institution. It is high time to fund the maintenance and expansion of computer technology and redirect at least part of the fund to college sustainability research that will integrate into the college action plan.

  1. Help to Enhance Climate Change Literacy in College Communities:

Below is some information on externally-funded Brooklyn College efforts with high student involvement:

Thanks to a $500,000 Environmental Literacy Grant from the National Oceanic and Atmospheric Administration’s (NOAA), the National Wildlife Federation’s NYC Eco-Schools is partnering with Professor Brett Branco of Brooklyn College, the NYCDOE, the Science and Resilience Institute at Jamaica Bay (SRIJB), and New York Sea Grant to create and launch the Resilient Schools Consortium (RiSC). The aim of the RiSC program is to prepare students to assess the vulnerabilities of their schools and communities to extreme weather events, create small-scale resiliency projects at their schools, and help draft climate resilience guidelines for the NYCDOE.

The RiSC program launches in October 2017 as both an after school and in-school pilot program and will engage up to 500 students and over a dozen teachers in seven public middle and high schools (members of the Brooklyn Marine STEAM Education Alliance) located in the vulnerable coastal community of South Brooklyn. Participating schools were either severely damaged during Sandy in 2012 or served as shelters for displaced students and their families.

“In the face of monster storms like Maria, Irma, Harvey in 2017, and Sandy in NYC, we need an entire generation of students to become climate literate as quickly as possible,” says Frank Niepold, NOAA’s Climate Education Coordinator and a RiSC Advisory Board member.

Posted in Climate Change | 4 Comments

AI’s Take on Student Input into Institutional Commitments

I asked Google for an image of “climate action plans of universities and colleges.” Below is a screenshot of what I got:

Screenshot of results from Google image search of "climate action plans of universities and colleges"

I went on and asked the same search engine (I am fully aware of the charge that Google is illegally using its dominant position in searches) to define “climate action plan,” and, as has now become usual, I got a short AI description:

AI on Climate action plans

Generative AI is experimental. Info quality may vary.

A climate action plan is a strategic framework for measuring, planning, and reducing greenhouse gas (GHG) emissions and related climatic impacts. Climate action plans generally include:

  • Greenhouse gas (GHG) emissions reduction targets
  • Actions the state can take to help meet those goals
  • Resilience strategies
  • Clean energy targets
  • Economic and social goals

Here are some examples of climate action plans: 

  • California Department of Water Resources

The Department’s plan is divided into three phases to address mitigation, adaptation, and consistency in the analysis of climate change.

  • National Climate Change Action Plan (NCCAP)

The plan outlines a long-term program and strategies for climate change adaptation.

  • S. Department of the Treasury

The plan emphasizes that U.S. leadership is required to significantly enhance global action and achieve the necessary policy outcomes on climate change.

  • S. Department of Health and Human Services (HHS)

The plan aims to improve HHS responses to the climate crisis.

  • HUD’s New Climate Action Plan

The plan provides billions of dollars in flexible funding to help communities recover from and build resilience to climate hazards and natural disasters.

33 states have Climate Action Plans.

I will include excerpts from the climate action plans of two universities below: Boston University, a private research university, and Indiana University, a federated state university:

Boston University

With input from the campus community, the Task Force drafted a Climate Action Plan, which was approved by the Board of Trustees.

The plan set an ambitious but realistic strategy that places BU in a leadership role locally and nationally, and provides the greatest opportunities for sustained environmental benefits. The plan emphasizes reducing Scope 1 and 2 emissions to become carbon neutral by 2040, a decade earlier than the City of Boston’s target to help the City meet its target.

Here is the Table of Contents from BU’s Climate Action Plan:

Executive Summary Pg. 3
I. Introduction Pg. 5
II. How Resilient Is the BU Campus? Pg. 8
III. What Do We Emit and Why? Pg. 10
IV. Recommendations for Reducing Scope 1 and 2 Emissions Pg. 13
V. Recommendations for Increasing Resilience Pg. 16
VI. Beyond Scope 1 and 2 Emissions Pg. 20
VII. Curriculum and Research Pg. 23
VIII. How Much Do These Recommendations Cost? Pg. 25
IX. How Do We Move Forward Systematically? Pg. 26
X. A Vision of Campus for the Future Pg. 27
XI. Conclusion Pg. 28
Appendix 1: BU Good and BU Better Scenarios Pg. 29
Appendix 2: Costs of Climate Action Pg. 30

Indiana University

Executive Summary

Indiana University (IU) was established in 1820 as one of just 52 degree granting colleges in the United States Today, the University comprises seven campuses across the State of Indiana, including two core campuses and fve regional campuses, each with unique degree offerings, geographies, contexts, and climates, providing a rich variety of educational experiences tailored to the diverse needs and aspirations of its students.

Strategic Alignment

The Indiana University Climate Action Plan (CAP) aligns closely with the University’s strategic plan, IU 2030: The Indiana University Strategic Plan. The strategic plan is built on three key pillars: student success and opportunity, transformative research, and service to the state. As the CAP was being developed, the strategic plan was undergoing a similar and parallel process, leading to a strong intersection between these two important efforts. The CAP serves as a complement of the strategic plan, supporting each of its core pillars. In turn, these pillars reinforce the CAP’s objectives and help ensure a comprehensive and cohesive approach to sustainability across the institution

What is a student’s role in these efforts?

Generative AI is experimental. Info quality may vary.

Campus as a Lab (CAL) is a teaching and organizational tool that allows students to use their campus as a lab. Students can contribute to sustainability projects that can advancea school’s Climate Action Plan. These projects must have measurable outcomes that help the university reach its goal of becoming carbon neutral by 2040.

Here are some examples of student contributions to CAL projects: 

  • Arizona State University students blog about “life overlooked” or non-charismatic species.
  • Students in Dr. Jed Macosko’s “Physics and Chemistry of the Environment” course worked on “Project Nightlight”. This project studied the campus’ contribution to light pollution.
  • Students in the Sustain IU internship program used applied behavioral science to encourage sustainable behavior.
  • University of Michigan students develop and test projects at the intersection of sustainability and social justice.

Other schools that use CAL projects include: 

  • University of Calgary
  • UChicago

In the next two weeks, I will gather additional examples of student input, including within the more familiar territory of my school. The previous blog summarized CUNY’s efforts in drafting the outlines of its strategic plan. That plan basically circumvented long-range goals by avoiding general assessments and replacing them with immediate objectives, to be decided on a yearly basis. Brooklyn College is just now starting its efforts to update its strategic plan. Since students are coming to us to get ready for their independent lives, the school’s long-term objectives should mirror those of its students.

Posted in Climate Change | 5 Comments