Summer is about to end and school will start soon. In a few days I will be going on a short trip to Israel to give two talks – one at the Weizmann Institute about water management and climate change, and the other at my high-school reunion. The one at the Weizmann Institute will focus on attempts to ensure that 75 years from now the world will be safe for our grandchildren and their grandchildren. The talk at my school reunion will focus instead on my own attempts to facilitate communication between my generation and that of our grandchildren, using my family as an example. There will be three days between the talks, and the subject matter will cover a span of about 150 years. It makes me feel like a mini Methuselah (according to the Bible he died age 969), which makes life interesting. I have often focused here on the issue of connecting the distant past with an equally distant future, and I will continue to do so.
In the next few blogs before my trip I would like to focus on an issue that is especially important presently – income inequality. I have addressed the subject before, specifically in the February 4, 2013 blog in connection with sustainable economic growth, and the January 7, 2014 blog as it relates to population growth. However, this year the issue took on a new dimension. On the political side it started with the election Bill de Blasio as New York City’s new mayor, and his campaign cry to try to address the city’s growing inequality. The publication of Thomas Piketty’s book, Capital in the Twenty-First Century, (translated to English by Arthur Goldhammer), only served to amplify the importance of the issue.
I am a physicist (trained as a physical chemist), and I teach two courses in which income inequality plays an important role: climate change and “Physics and Society.” In both courses whenever I mention inequality, my students’ typical response is: “Why should we care? We are here to end up on top.” Both courses are highly interdisciplinary and deal with subjects that I never studied in school; instead, I have tried to self-educate myself throughout the years. Economics is probably the most important of these disciplines. In the more than two years that I have been writing this blog, it has surfaced repeatedly. As a result, I decided to spend part of my recent vacation-work trip to Europe (June 10, 24, 2014 blogs) trying to read Piketty’s book in full. I did it (all 700 pages worth 🙁 )! When I came back I read Joseph Stiglitz’s new book, The Price of Inequality (W.W. Norton & Company, 2013). I also found that “Science” magazine, one of the most prestigious scientific journals, dedicated a significant fraction of its May 23rd issue to articles about inequality. In a sense, this summer was the summer of inequality for me and I want to share some of it with you.
I will start with Piketty’s book, continue through some of the many public reviews and comments that have shown up on an almost daily basis since its publication (April 2014), follow up with highlights from the Science issue and finish with attempts to correlate all of this with sustainability and climate change. Throughout this series of four blogs I will intersperse my own takes on these issues. To put it into perspective, Frank Rich in an article in New York Magazine (August 12, 2014; page 46 ) titled “Good Hillary, Bad Hillary” described a new statistical tool called, “The Hawking Index,” which examines readership. It was created by Jordan Ellenberg, a Wisconsin Mathematician. The index is named after Stephen Hawking’s book, A Brief History of Time, about the beginning of the Universe in the Big Bang. The index is supposed to compute how thoroughly best sellers are being read (For example, Donna Tart’s Goldfinch scored a whopping 98.5%). At the bottom of the index, breaking Hawking’s previous low of 6.6%, came Thomas Piketty’s Capital in the Twenty-First Century with a score of 2.4%.
Regarding Hawking’s book, I still remember an episode in London when I tried to buy the book as a present for my stepfather. I went to a reputable book store and asked for the book; they sent me to the History section. I immediately realized, (this was many years before the creation of the “Hawking Index”), that popularity and readership are not necessarily the same.
Piketty bases his analysis on detailed examination of data and the argument that capitalism is based on two fundamental laws. This sounds similar to Physics, where significant parts of the macroscopic physical environment are based on the 1st and 2nd laws of thermodynamics (you can use the Search button on the side to see previous mentions of thermodynamics in this blog). The laws are very simple and are given in a form of two formulas:
- α = r×β
- β = s/g
α is the share of income that comes from capital; β is the ratio of capital to the national income; r is the rate of return from capital; s is the savings rate and g is the growth rate.
To use two numerical examples from the book: in equation 1 if β = 600% and r = 5% it follows that α = 30%. Likewise, in equation 2, if we say that the savings rate (s) is 12% and the growth rate (g) is 2%, it implies that β = 600%. Significantly, the second law implies that a country that saves a lot but grows slowly accumulates large capital (relative to its income). Piketty places the two laws at the heart of the central contradiction of capital. Put simply, if the return on capital is greater than the general growth of the economy, then this will inevitably lead, over time, to those with capital increasing their wealth in relative terms, until they eventually own all capital and thus put an end to capitalism itself. With the return increasing over time, when given access to various assets, capital will get a larger share of income. In fact, when wealth is inherited and can be diversified, the returns are higher than in case of an individual who has limited wealth and prefers safer avenues which earn lower returns.
A typical data set on which his analysis is based, is given below:
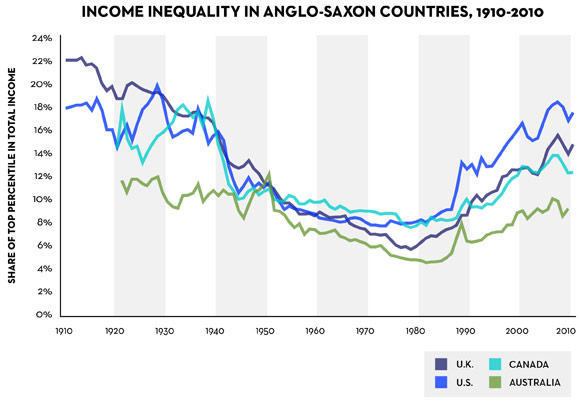
The figure is in the book but in a bit less attractive form at least in my version of the book (the electronic version). I took this version from Google images instead.
The figure depicts the share of total national income held by the top percentile of the population in four Anglo-Saxon countries over the 20th Century. Similar trends can be seen in the French data. It is obvious from the graph that over most of this time, the share of income does not obey the “basic laws of capitalism,” because the share of income held by the top percentile is actually decreasing, not increasing as the laws would predict. Piketty claims that the laws are not obeyed over this period because the period was dominated by the two World Wars in which massive capital was destroyed. This is certainly true in France and Germany, which are not shown here, but the claim is a bit questionable, to a variable degree, for the four countries shown in the graph. Regardless, for what it is worth, based on the two laws, the claim itself that capital grows considerably faster than income makes sense (at least to me).
Another important issue is that the claim of global behavior, which he uses as a predictor for the future, is based mainly on three countries: France, England and the USA. The analysis and the predictions are based on analysis of historic data and Piketty was not able to find similarly extensive data sets for other countries. This is problematic for numerous reasons.
Be that it as it may, I return to my students’ recurring question – so what? If some guys are getting richer and the standard of living (in real $) for most of the rest of the 99% remains approximately the same (and we belong to the 99%), why should we care? Why not just strive to join the 1% and let the magic of the free market work its way?
I will try to address some of these questions and how they relate to the book in the next three blogs. Meanwhile, I’d like to finish here with an observation unique to the US. A recent US Supreme Court decision, which passed by a margin of 5:4, started with the following paragraph:
In the Court’s plurality opinion, Chief Justice John Roberts wrote, “The right to participate in democracy through political contributions is protected by the First Amendment, but that right is not absolute. Our cases have held that Congress may regulate campaign contributions to protect against corruption or the appearance of corruption. See, e.g., Buckley v. Valeo, 424 U.S. 1, 26-27 (1976) (per curiam).”
The resolution states that spending money on an election is protected by the First Amendment, as is free speech. The only exception is that Congress may regulate campaign contributions to protect against corruption or the appearance of corruption. This means that the ever-increasing share of capital owned by the top 1% of the population – a resource that provides this group with the unopposed ability to sway elections – cannot be limited by Congress. Using such monetary expenditure to gain more and more influence on the political process, resulting (for example) in the lowering of taxes, modification of antitrust legislation or reduction of welfare payments, is not considered “quid pro quo,” meaning that it is not considered corruption or appearance of corruption, and thus cannot be limited.
* As always, I welcome questions and comments about my blog, my book, and my work in general. In an effort to reduce the influx of spam, and in the interest of spending my time addressing actual messages (instead of sorting through junk), I ask that you please send any questions to one of the following addresses, with the title, “Comment about CCF blog.”
micha (no space) tom (at) brooklyn (dot) cuny (dot) edu
or info (at) lcgcommunications (dot) com. Thank you for your continued readership and your feedback.
 On his own, with a big message: “Good Planets Are Hard to Find”
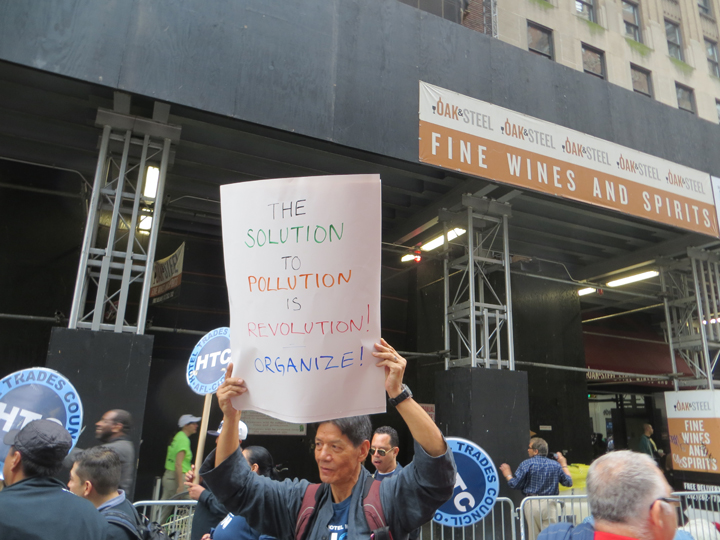 “The Solution to Pollution is Revolution – Organize” was a bit on the fringe but it rhymes.
 “Not Blind Opposition to Progress but Opposition to Blind Progress” Couldn’t have said it better, especially since it marched with the trade unions.
 Science was at the center of the effort, and the emphasis on the need to “Teach Science” was everywhere.
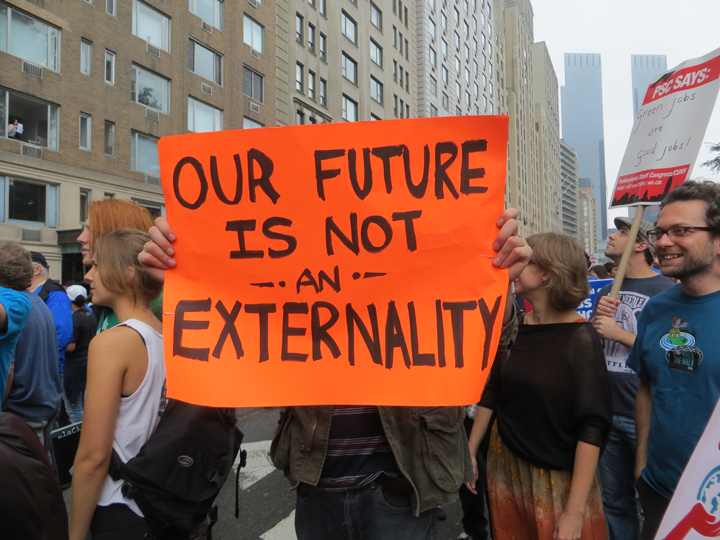 Directed at economists – In economics, an externality is the cost or benefit that affects a party who did not choose to incur that cost or benefit
 “Stop Pretending, Start defending,” “Windmills Not Weapons,” “Have the Nerve to Conserve.” (This photo, courtesy of my editor, Sonya Landau of LCG Communications)


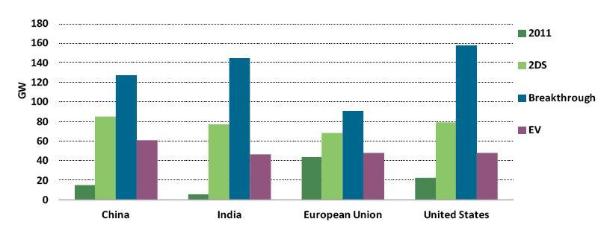
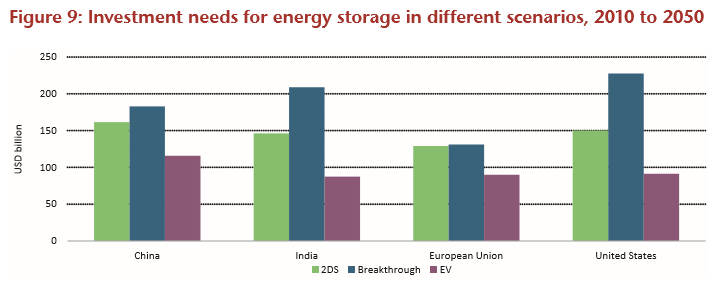 These figures need some brain tutoring enforcements. The second figure is self-explanatory – we all understand how much $1 billion is, and all 4 regions need to spend around $150 billion (each) – based on the 2DS scenario – to satisfy their storage needs, and that constitutes big money. It is worth noting here that the same amount is about 50 times bigger for India than it is for the US and Europe as compared with present GDP.