The first part of the IPCC’s (Intergovernmental Panel on Climate Change) 5th report (AR5) came out on Friday. This part consists of the Summary for Policymakers of Working Group I (WGI) that focuses on the physical science basis. The full WGI report is available as of yesterday.
Meanwhile, however, conservative think tank and well known denier group The Heartland Institute didn’t wait for the full report, and has already published its own rebuttal to the WGI report. This rebuttal to the WGI, published by the Heartland-founded NIPCC (Nongovernmental International Panel on Climate Change) contains 1023 pages. I have yet to read them, but promise to do so, as I am going to discuss the AR5 with my class and on my blog. Since at the time I wrote this, the full AR5 WGI report hadn’t been published yet, I was unable to read it, but I promise to read it and share it with my students and readers as soon as I can.
In order to forestall any arguments that I am picking and choosing sections of the report, I am instead including all of the highlights that were collected in the Summary for the Policymakers report of the WGI report:
Warming of the climate system is unequivocal, and since the 1950s, many of the observed changes are unprecedented over decades to millennia. The atmosphere and ocean have warmed, the amounts of snow and ice have diminished, sea level has risen, and the concentrations of greenhouse gases have increased (see Figures SPM.1, SPM.2, SPM.3 and SPM.4). {2.2, 2.4, 3.2, 3.7, 4.2–4.7, 5.2, 5.3, 5.5–5.6, 6.2, 13.2}.
Each of the last three decades has been successively warmer at the Earth’s surface than any preceding decade since 1850 (see Figure SPM.1). In the Northern Hemisphere, 1983–2012 was likely the warmest 30-year period of the last 1400 years (medium confidence). {2.4, 5.3}.
Ocean warming dominates the increase in energy stored in the climate system, accounting for more than 90% of the energy accumulated between 1971 and 2010 (high confidence). It is virtually certain that the upper ocean (0−700 m) warmed from 1971 to 2010 (see Figure SPM.3), and it likely warmed between the 1870s and 1971. {3.2, Box 3.1}.
Over the last two decades, the Greenland and Antarctic ice sheets have been losing mass, glaciers have continued to shrink almost worldwide, and Arctic sea ice and Northern Hemisphere spring snow cover have continued to decrease in extent (high confidence) (see Figure SPM.3).{4.2–4.7}.
The rate of sea level rise since the mid-19th century has been larger than the mean rate during the previous two millennia (high confidence). Over the period 1901–2010, global mean sea level rose by 0.19 [0.17 to 0.21] m (see Figure SPM.3). {3.7, 5.6, 13.2}.
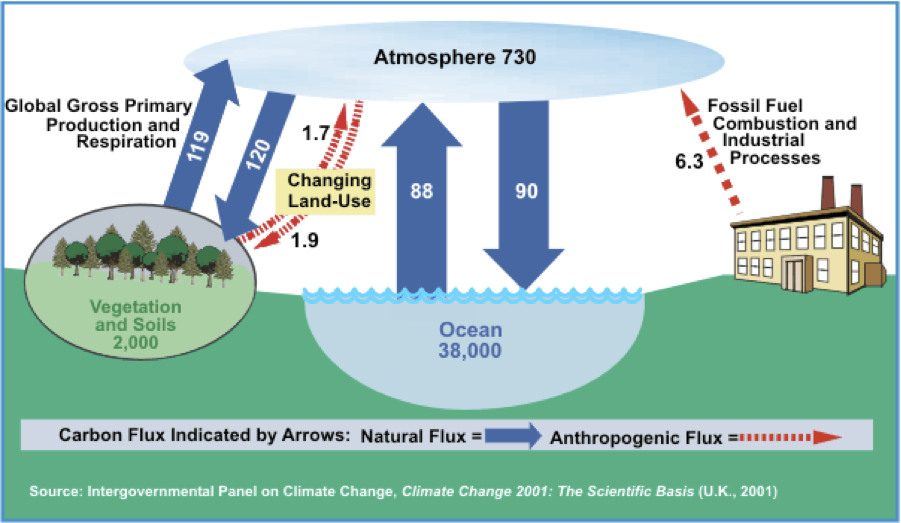
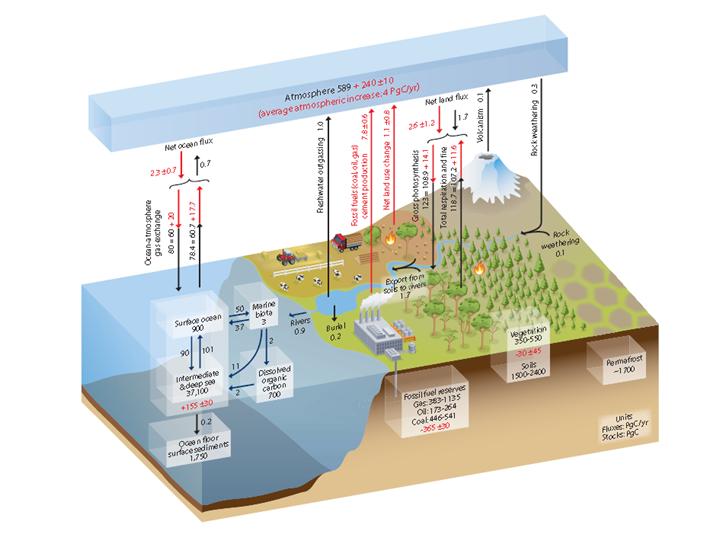
The atmospheric concentrations of carbon dioxide (CO2), methane, and nitrous oxide have increased to levels unprecedented in at least the last 800,000 years. CO2 concentrations have increased by 40% since pre-industrial times, primarily from fossil fuel emissions and secondarily from net land use change emissions. The ocean has absorbed about 30% of the emitted anthropogenic carbon dioxide, causing ocean acidification (see Figure SPM.4). {2.2, 3.8, 5.2, 6.2,6.3}.
Total radiative forcing is positive, and has led to an uptake of energy by the climate system. The largest contribution to total radiative forcing is caused by the increase in the atmospheric concentration of CO2 since 1750 (see Figure SPM.5). {3.2, Box 3.1, 8.3, 8.5}.
Human influence on the climate system is clear. This is evident from the increasing greenhouse gas concentrations in the atmosphere, positive radiative forcing, observed warming, and understanding of the climate system. {2–14}.
Observational and model studies of temperature change, climate feedbacks and changes in the Earth’s energy budget together provide confidence in the magnitude of global warming in response to past and future forcing. {Box 12.2, Box 13.1}.
Human influence has been detected in warming of the atmosphere and the ocean, in changes in the global water cycle, in reductions in snow and ice, in global mean sea level rise, and in changes in some climate extremes (Figure SPM.6 and Table SPM.1). This evidence for human influence has grown since AR4. It is extremely likely that human influence has been the dominant cause of the observed warming since the mid-20th century. {10.3–10.6, 10.9}.
Continued emissions of greenhouse gases will cause further warming and changes in all components of the climate system. Limiting climate change will require substantial and sustained reductions of greenhouse gas emissions. {Chapters 6, 11, 12, 13, 14}.
Global surface temperature change for the end of the 21st century is likely to exceed 1.5°C relative to 1850 to 1900 for all RCP scenarios except RCP2.6. It is likely to exceed 2°C for RCP6.0 and RCP8.5, and more likely than not to exceed 2°C for RCP4.5. Warming will continue beyond 2100 under all RCP scenarios except RCP2.6. Warming will continue to exhibit interannual-to-decadal variability and will not be regionally uniform (see Figures SPM.7 and SPM.8). {11.3, 12.3, 12.4, 14.8}.
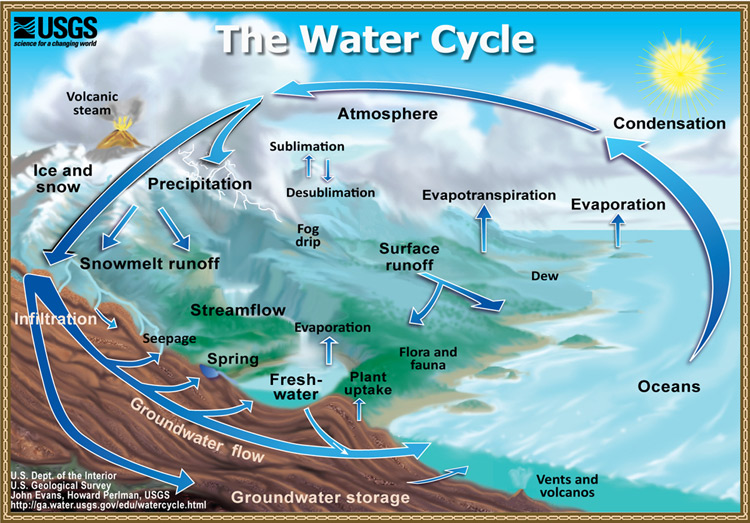
Changes in the global water cycle in response to the warming over the 21st century will not be uniform. The contrast in precipitation between wet and dry regions and between wet and dry seasons will increase, although there may be regional exceptions (see Figure SPM.8). {12.4, 14.3}.
The global ocean will continue to warm during the 21st century. Heat will penetrate from the surface to the deep ocean and affect ocean circulation. {11.3, 12.4}.
It is very likely that the Arctic sea ice cover will continue to shrink and thin and that Northern Hemisphere spring snow cover will decrease during the 21st century as global mean surface temperature rises. Global glacier volume will further decrease. {12.4, 13.4}.
Global mean sea level will continue to rise during the 21st century (see Figure SPM.9). Under all RCP scenarios the rate of sea level rise will very likely exceed that observed during 1971–2010 due to increased ocean warming and increased loss of mass from glaciers and ice sheets. {13.3–13.5}
Climate change will affect carbon cycle processes in a way that will exacerbate the increase of CO2 in the atmosphere (high confidence). Further uptake of carbon by the ocean will increase ocean acidification. {6.4}.
Cumulative emissions of CO2 largely determine global mean surface warming by the late 21st century and beyond (see Figure SPM.10). Most aspects of climate change will persist for many centuries even if emissions of CO2 are stopped. This represents a substantial multi-century climate change commitment created by past, present and future emissions of CO2. {12.5}.
Prior to the release of this latest report, most of the media focused on the two main points that were released early:
Human influence has been detected in warming of the atmosphere and the ocean, in changes in the global water cycle, in reductions in snow and ice, in global mean sea level rise, and in changes in some climate extremes (Figure SPM.6 and Table SPM.1). This evidence for human influence has grown since AR4. It is extremely likely that human influence has been the dominant cause of the observed warming since the mid-20th century. {10.3–10.6, 10.9}.
Changes in the global water cycle in response to the warming over the 21st century will not be uniform. The contrast in precipitation between wet and dry regions and between wet and dry seasons will increase, although there may be regional exceptions (see Figure SPM.8). {12.4, 14.3}.
Both of these statements are in direct response to deniers. The first one addresses the degree of certainty that humans bear major responsibility to climate change. In the IPCC terminology it is “extremely likely” that humans are responsible. The IPCC translates “extremely likely” to around 95% certainty.
The second point addresses the often heard claim that during the last 15 years carbon dioxide emission has continued unabated, while the temperature hardly budged. The argument here was that this behavior shows a disconnect between the carbon dioxide and the temperature rise. A quantitative comparison of model predictions by the IPCC and by various deniers is available on a recent Skeptical Science blog.
With regards to the meaning of 95%, here is what Seth Borenstein wrote on this topic under the title “What 95% certainty of Warming Means to Scientists.”
There’s a mismatch between what scientists say about how certain they are and what the general public thinks the experts mean, specialists say.
That is an issue because this week, scientists from around the world have gathered in Stockholm for a meeting of a U.N. panel on climate change, and they will probably release a report saying it is “extremely likely” — which they define in footnotes as 95 percent certain — that humans are mostly to blame for temperatures that have climbed since 1951.
One climate scientist involved says the panel may even boost it in some places to “virtually certain” and 99 percent.
Some climate-change deniers have looked at 95 percent and scoffed. After all, most people wouldn’t get on a plane that had only a 95 percent certainty of landing safely, risk experts say.
But in science, 95 percent certainty is often considered the gold standard for certainty.
Yes – most of us would avoid boarding a plane knowing that it has 95% chance of landing safely (or 5% chance crashing on landing). We have an obvious choice of staying home or choosing an airline with a better safety record. This airline will probably be out of business well before we will have to decide whether to fly.
The other side of this issue is that if a fire inspector were to find a 95% chance that our house would catch fire, he would tell us to fix the vulnerability immediately, especially given that no insurance company in the world would be willing to insure us. The only time that we can be 100% certain that the house is going to catch fire is after the house is already aflame. At that time the only thing left to do is to try to get out as fast as possible. Presently we can not get out of this planet – we have no place else to go.
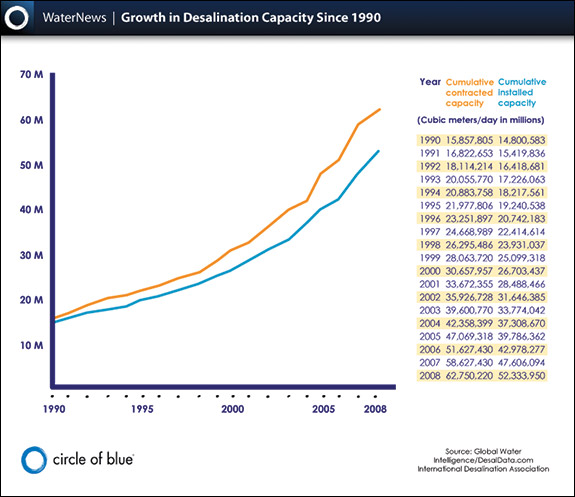
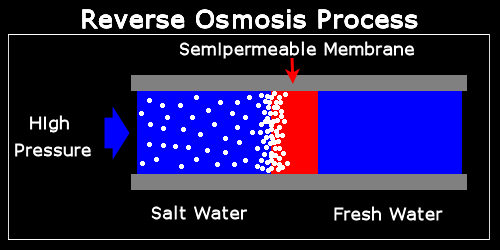
 The map below shows the “hot spots” for the use of this technology. Unfortunately, the height of the bars is not normalized to any parameter that scales with the size of the country (population, GDP or water consumption) so the visual might be a bit misleading. For obvious reasons (abundance of oil money, great shortage of water) South Arabia and the Gulf States are leading the effort. The effort is visible in almost every continent but, as is so often the case with activities in which available money plays an important role, it is dominated not necessarily by need, but rather, by the ability to allocate the necessary resources.
 In future blogs, I intend to elaborate upon the other impediments that stand in the way of desalination becoming a more prominently used solution to water stress; some of these obstacles come from unexpected sources.