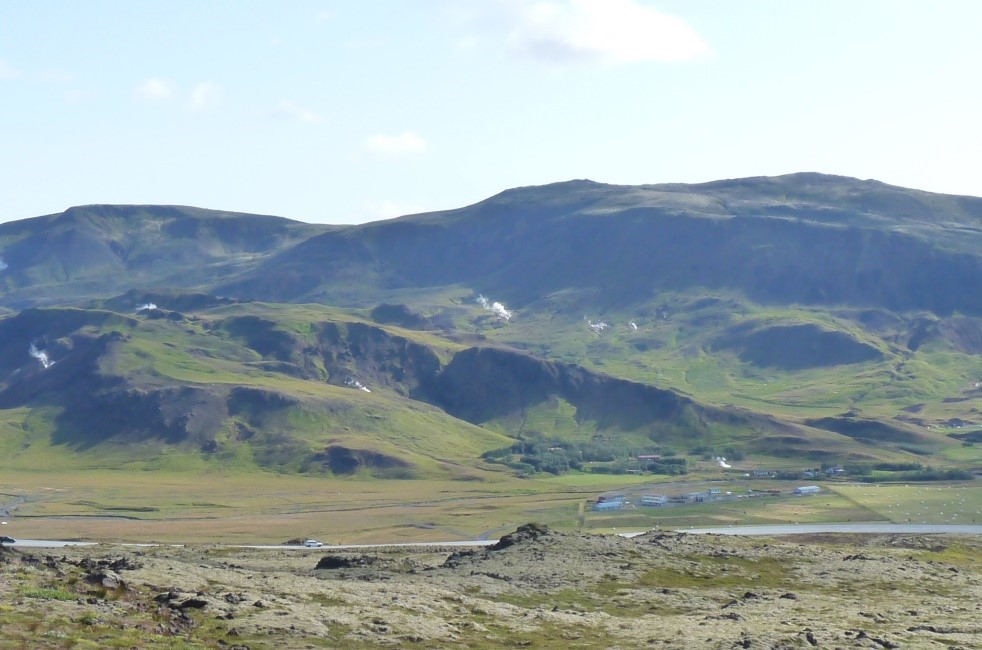
By the time that this blog is posted I will be in England on my way to the Netherlands and France, ending up in Reykjavik, Iceland. In Iceland I will attend the Sixth International Conference on Climate Change. This is the same conference that I attend every year (see the July 16, 2012 blog about the Fourth Conference in Seattle and the July 2, 2013 blog about the Fifth Conference in Mauritius). I like this series of conferences because the attendance is limited to about 200 participants, but includes active participant from all corners of the world. It addresses both the science and social science aspects of the most important issues, and as an added bonus, the meetings take place in great places that make them convenient excuses to combine work with vacation.
As I have done following the previous conferences, I will share some highlights upon returning home.
Meanwhile, I am including the full schedule of the conference below:

An Inconvenient Sleuth: Engagement Framework to Identify and Overcome Adaptation Barriers and Perverse Incentives
Katherine Beckmann, School of the Built Environment / Climate Change, Herriot-Watt University, Edinburgh, UK
Overview: Based on policy-focused adaptation work in Scotland, this workshop guides participants through tested frameworks for stakeholder engagement: to identify key adaptation barriers and enablers, and to generate policy-relevant recommendations.
Climate Change Mindset: Understanding, Identifying and Transforming the Race, Class and Gender Mindset that Has Brought Us to this Climate Emergency
Dr. Heather W. Hackman, Hackman Consulting Group, Minneapolis, USA
Overview: This workshop addresses how race, class and gender power dynamics have contributed to this climate emergency, and offers specific tools for identifying and redressing those dynamics in our current work.
The Concept of Marine Ecotourism: A Case Study in a Mediterranean Island
Fani Sakellariadou, Faculty of Shipping and Industry Department of Maritime Studies, University of Piraeus, Athens, Greece
Overview: Marine ecotourism, its principles, benefits and potential negative environmental impacts is the topic of this paper.
Assessing Adaptive Capacity to Climate Change in Agriculture: The Case Study of the Ontario Wine Industry.
Kerrie Pickering, Environmental Sustainability Research Centre, Brock University, St Catharines, Canada
Dr. Ryan Plummer, Environmental Sustainability Research Centre, Brock University, St Catharines, Canada
Dr. Tony Shaw, Dept of Geography, Brock University, St Catharines, Canada
Prof. Gary Pickering, Environmental Sustainability Research Centre, Brock University, St Catharines, Canada
Overview: A tool for assessing the adaptive capacity to climate change of the Ontario wine industry was developed and applied.
Psychological Barriers to Climate Change Mitigation in Canada
Prof. Gary Pickering, Environmental Sustainability Research Centre, Brock University, St Catharines, Canada
Overview: The psychological barriers influencing inaction on and attitudes towards Climate Change are characterized for the first time in a large population-based survey of Canadians.
Adaptation Responses to Climate Impacts by the Mining Industry: A Critical Review of Current Trends and Needs
Francisco Gonzalez, Australian Centre for Sustainable Mining Practices, School of Mining Engineering, University of New South Wales, Sydney, Australia
Prof. Roslyn Taplin, Australian Centre for Sustainable Mining Practices, School of Mining Engineering, University of New South Wales, Sydney, Australia
Overview: An overview of the mining industry’s perceptions of climate change, potential for adaptive responses to climate change impacts and extreme weather by the industry, and links with sustainable mining practices.
The Feasibility of Ocean Thermal Energy Conversion: Northern Equatorial Pacific as Case Study
Arianna Abram, Sea Education Association, Boston, USA
Joshua Sturtevant, Sea Education Association, Boston, USA
Overview: Ocean Thermal Energy Conversion, a renewable energy technology, utilizes the ocean’s thermal energy to produce electricity. Environmental impacts are assessed to determine feasibility of this technology to mitigate climate change.
Effects of Warming and Precipitation on Photosynthetic in Stipa Breviflora
Dr. Xiliang Song, Institute of Botany, Institute of Botany, Beijing, China
Overview: A greenhouse experiment simulating hydrothermal interactions was conducted to investigate how the interactions of climatic warming and precipitation change influence the photosynthesis of Stipa breviflora.
A Dynamical Mechanism for Climate Shifts
Prof. Anastasios Tsonis, Department of Mathematical Sciences, University of Wisconsin-Milwaukee, Milwaukee, USA
Overview: The central point of this study is that a network of coupled nonlinear subsystems may at times synchronize which often may lead to a climate shift .
The Evaluation of UTCI Index for Summer Beaching in Baltic Sea
Dr. Justas Kažys, Department of Hydrology and Climatology, Vilnius University, Vilnius, Lithuania
Ieva Malūnavičiūtė, Department of Hydrology and Climatology, Vilnius University, Vilnius, Lithuania
Overview: Universal Thermal Climate Index (UTCI) is used for the evaluation of summer beaching potential around the Baltic Sea. Temporal and spatial climate change effects are already noticeable in the region.
The Port of Houston’s Turning Basin Terminal Development Project: How Climate Change is Factored
Liza T. Powers, School of Urban Planning and Environmental Policy, Texas Southern University, Houston, USA
Overview: Research was conducted to determine how the Port of Houston has factored climate change, sea level rise and intense storms, in its ten year renovation of the Turning Basin Terminal.
Australian Political Responses to Coastal Impacts of Climate Change
Prof. Nick Harvey, School of Social Sciences, The University of Adelaide, Adelaide, Australia
Overview: Political impetus for Australian national inquiries into climate change impacts on the coast is separate from the politics of state governments, which have their own different legislative and policy responses.
An Ecovillage as a Solution for the Border: San Cristobal
Prof. Sandra Acosta, University of La Salle Faculty of the habitat sciences Architecture and urbanism, University of La Salle, Bogota, Colombia
Overview: In Bogota, a quickly growing city, the borders are more and more diffused. There is an interest in solving the transition between the consolidated city and the rural environment.
Moss Houses in the Circumpolar North: Architectural Traditions and Innovations That Respond to Climate Change
Dr. Nancy Mackin, Ethno-ecology, Wilp Wilxo’oskwhl Nisga’a and University of Northern British Columbia, Gitwinksihlkw, Canada
Overview: In the Canadian Arctic, we reconstructed traditional moss houses, an Indigenous peoples’ sustainable technology of increasing relevance as climate changes escalate. We discuss similar structures from across the circumpolar north.
The Environmental Impacts of Canadian Waste Transportation: From a Risk and Uncertainty Perspective
Cassandra Elizabeth Kuyvenhoven, School of Environmental Studies, Queen’s University, Kingston, Canada
Overview: The transportation of waste requires substantial amounts of energy and a reliance on nonrenewable fossil fuels. The environmental risks associated with this transportation are inherently indeterminate.
The Many Faces of Water Use
Micha Tomkiewicz, Dept. of Physics, Brooklyn College of CUNY, Brooklyn, USA
Gurasees Chawla, Department of Physics, Brooklyn College, Macaulay Honors College, Brooklyn, USA
Overview: Influence of Life Cycle Assessment on the location of production and ability to use some of the waste products differentiates between production in rich and poor countries.
Climate Change and Fisheries in Ghana: Trends and Adaptive Strategies by Small-scale Fishers
George Freduah, Sustainability Research Center, University of the Sunshine Coast, Australia., Sunshine Coast, Australia
Overview: This study examines multiple stresses confronting small-scale fisheries in Ghana, how climate change compounds these stresses, and the capacity of fishers to respond to these stresses.
Love Not the Wind: Anthropogenic Climate Change in Near-future Science Fiction
Prof. David Moton, English Department, Bakersfield, USA
Overview: By analyzing anthropogenic climate change in near-future science fiction, I will explore the social and technological responses to a disastrous climate.
An Analysis of Crop Diversification: Climate Change Adaptation in Agriculture, Bangladesh
Monir Shaikh, Grantham Research Institute& Department of Geography and Environment, London School of Economics (LSE), London, UK
Overview: This research looks into how the households of Bangladesh diversify crops to adapt to climate change and how this diversification may change with different climate change scenarios over time.
Using Self-Sustaining Decentralised Utility Services to Adapt Regional Urban Development to Changing Climatic Conditions
Assoc. Prof. Peter Waterman, Faculty of Science, Health, Education and Engineering, University of the Sunshine Coast, Slacks Creek, Australia
Overview: I discuss integrating decentralised community utility services for water supply, sewage treatment and renewable energy as a climate change adaptation strategy for decentralised urban development in rural and remote regions.
Regional Climate Action Planning: Los Angeles, California as a Case Study
Bryan Moy, Department of Environmental Health Sciences, UCLA Fielding School of Public Health, Los Angeles, USA
Dr. Hilary Godwin, Department of Environmental Health Sciences and the Institute of the Environment and Sustainability, UCLA Fielding School of Public Health, Los Angeles, USA
Dr. Angelo Bellomo, Department of Environmental Health, Los Angeles County Department of Public Health, Los Angeles, USA
Overview: Los Angeles, California presents a unique challenge and is an interesting case study for Regional Climate Action Planning, due to the county’s large population, demographics, geography, microclimates, and jurisdictions.
Potential Influence of Climate Change on Food Webs of ChelydraSerpentina in Mid-Atlantic Highland, USA Wetlands
Dr. James T. (Jim) Anderson, Division of Forestry and Natural Resources Environmental Research Center, West Virginia University, Morgantown, USA
Overview: I present conceptual models of climate change impacts on common snapping turtles (Chelydraserpentina), the top predators in wetlands of the Central Appalachian Mountains.
The Climate and Energy Strategy of Tampere Region, Finland
Prof. Tom Frisk, Responsibility Area for the Environment and Natural Resources, Environment Impacts Unit, Centre for Economic Development, Transport and the Environment for Pirkanmaa, Tampere, Finland
Overview: The climate and energy strategy for Tampere region, Finland, was developed in order to mitigate climate change by regional and local actions, and to promote planning of adaptation measures.
Are Headwater Catchments Resilient to Warming Climate? An Ecohydrological Case Study from the Central Appalachian Mountains, USA
Dr. Nicolas Zegre, Forestry & Natural Resources, West Virginia University, Morgantown, USA
Jothiganesh Shanmugasundaram, Department of Geology & Geography, West Virginia University, Morgantown, USA
David Young, Forestry & Natural Resources, West Virginia University, Morgantown, USA
Carson Wright, Forestry & Natural Resources, West Virginia University, Morgantown, USA
Dr. Eungul Lee, Geology & Geography, West Virginia University, Morgantown, USA
Overview: This study examines whether catchments show ecohydrologic resiliency to warming climate, and if warming climate differentially affects hydrology in catchments with different disturbance histories.
Energy We Need: Calculate Your Impact and Savings
Alexander Frantzen, Royal Realty Corporation, New York, USA
Overview: Energy We Need is an at-your-fingertips Project to aggregate collective energy savings performed by people worldwide – to reduce our impact – and creates key data visualizations for leverage.
Technological Risks in Environmental Change Due to Climate
Sedat Cereci, Fine Arts Faculty, University of Batman, Batman, Turkey
Overview: Technological improvements convey lives of people, world changes, climate changes and environment has damage recently.
Polar Bears in Antarctica? An Analysis of Treaty Barriers
Madison Hall, Department of Fisheries and Wildlife, Michigan State University, East Lansing, USA
Overview: The Assisted Colonization of Polar Bears to Antarctica requires an analysis of treaties to understand existing legal barriers to Ursus maritimus transport and movement, currently preventing Antarctic access.
Health Risks of Increasing Water Salinity and Potential Adaptation Strategies in Coastal Areas of Bangladesh
Dr. Mohammad Radwanur Rahman Talukder, Centre for Environment and Population Health, School of Environment, Griffith University, Australia, Nathan, Australia
Overview: Health impacts of climate-induced sea level rise and increasing water salinity in low-lying coastal areas, and potential adaptation strategies to respond to this change in water quality.
Assessing Impacts
The Effect of Warming and Grazing on Apparent Soil Dissolved Organic Nitrogen (DON) in Tibet
Prof. Shiping Wang, Laboratory of Alpine Ecology and Biodiversity, Institute of Tibetan Plateau Research, Chinese Academy of Sciences, Beijing, China
Prof. Yanfen Wang, College of Life Science, University of the Chinese Academy of Sciences, Beijing, China
Lili Jiang, Laboratory of Alpine Ecology and Biodiversity, Institute of Tibetan Plateau Research, Chinese Academy of Sciences, Beijing, China
Overview: We discuss the effect of warming and grazing on apparent soil dissolved organic nitrogen in a Tibet alpine meadow.
Attenuation of TRMM Channel over Salem
Dr. Rajasri Sen Jaiswal, Physics Centre for Study on Rainfall and Radio wave Propagation, Sona College of Technology, Salem, India
Sunakshi Jaiswal, Electronics and Communication Engineering, Sona College of Technology, Salem, India
Overview: In this paper attenuation of high frequency signal used in the TRMM due to rainfall is estimated. Moreover, hourly to one-minute rainfall conversion technique is presented.
Fishes and Sharks from the Eocene Canadian Arctic Greenhouse: A “Deep Time” Perspective on Climate Change in High Arctic Marine Environments
Dr. Michael David Gottfried, Department of Geological Sciences Michigan State University Museum, Michigan State University, East Lansing, USA
Overview: Recently discovered 50 million-year-old fishes and sharks from Banks Island in the Canadian Arctic expand our knowledge of the “Greenhouse” Arctic marine environment during the Eocene climate optimum.
Finding Signature of Climate Change in Meteorological Elements: Study of Cloud Liquid Water, Precipitation Water, Latent Heat, Temperature and Rainfall
Dr. Rajasri Sen Jaiswal, Physics Centre for study on Rainfall and Radio wave Propagation, Sona College of Technology, Salem, India
Neela Vus, Physics CRRP, Sona College of Technology, Salem, India
Sonia Fredrick, CRRP Physics, Sona College of Technology, Salem, India
Rasheed Mohamed, Sona College of Technology, Salem, India
LeenaZaveri, Sona College of Technology, Salem, India
Overview: A knowledge in the process of climate change probably may help the community to fight against it, therefore we embarked on this study.
Random Acts of Unpredictability: Scenario Planning in Environmental Crisis Management
Miriam Matejova, Department of Political Science, University of British Columbia, Vancouver, Canada
Overview: This paper presents an innovative approach to understanding climate change effects. Rather than focusing on data gathering and risks within the realm of probability, it examines broader and extreme possibilities.
Taiwan’s CCS Policy: A Survey to Its Impact, and Development
Chien-Yu Kao, Graduate School of Law, National Chung Cheng University, Kaohsiung, Taiwan
Overview: This research focuses on Taiwan’s policy and administration that reduces CO2. Further expansion of reducing CO2 will be discussed with its impact and development.
Does Urban Governance in Bangladesh Consider Climate Induced Migration and its Aftermath?
Bipasha Dutta, University of Groningen, Groningen, Netherlands
Dr. Kazi Maruful Islam, Department of Development Studies, University of Dhaka, Dhaka, Bangladesh
Overview: Lack of separate units in urban governance to address the need of climate induced migrant in Bangladesh make their health status even worse than that of the rural poor.
Combining Urban Fragmentation and Urban Vulnerability for Developing Local Adaptation Options in Megacities
Dr. Kerstin Krellenberg, Department of Urban and Environmental Sociology, Helmholtz Centre for Environmental Research GmbH-UFZ, Leipzig, Germany
Overview: This paper focuses on the local level and offers an approach that combines urban fragmentation and vulnerability in order to end up with context-specific adaptation options for individuals and municipalities.
Climate Studies
Uncertainty in Climate Change Impact Studies: A Review of Developments and Limitations
Teang Shui Lee, Department of Biological and Agricultural Engineering Faculty of Engineering, Universiti Putra Malaysia, Sri Serdang, Malaysia
HadiGalavi, Department of Civil and Environmental Engineering Faculty of Engineering, Universiti Putra Malaysia, Sri Serdang, Malaysia
Dr. Yuk Feng Huang, Department of Civil engineering, Universiti Tuanku Abdul Rahman, Kuala Lumpur, Malaysia
Overview: A review of limitations, successes, and developments in analyzing and modeling the uncertainties involved in climate change impact studies is provided in this article.
The Self Fulfilling Prophecy of Climate Change: Evangelical Christian Ethics in the Face of American Environmentalism
Ryan Smith, The Department of Religious Studies, University of California, Riverside, Riverside, USA
Overview: The evangelical theology of the “second coming” of Christ may be responsible for people voting against environmental legislation in the United States; thereby having an effect on global warming.
Climate Change: Where Are the Real Terrestrial Environment Threats?
Prof. Ronaldo Viana Soares, Forest Fire Laboratory, Federal University of Paraná, Curitiba, Brazil
Prof. Antonio Carlos Batista, Forest Fire Laboratory, Federal University of Paraná, Curitiba, Brazil
Prof. Alexandre França Tetto, Forest Fire Laboratory, Federal University of Paraná, Curitiba, Brazil
Overview: The climate of the earth alternates between cold and warm periods, independently of human activities. The main threat to the terrestrial environment is the pollution of the oceans and rivers.
Climate Change Mitigation in the Building Sector: Towards Net-zero Energy Buildings (nZEB)
Dr. Lazaros Mavromatidis, Building and Civil Engineering Laboratory (LGCB), Ecole Nationale des Travaux Publics de l’Etat (ENTPE), Vaulx-en-Velin, Lyon, France
Dr. Mohamed El Mankibi, Building and Civil Engineering Laboratory (LGCB), Ecole Nationale des Travaux Publics de l’Etat (ENTPE), Vaulx-en-Velin, France
Dr. Gilles Fraisse, Laboratoire optimisation de la conception et ingénierie de l’environnement (LOCIE)/ UMR 5271, Université de Savoie, Le Bourget du Lac, France
Overview: This paper reviews actions and technical solutions to increase the number of buildings that consume nearly zero energy, in the framework of climate change mitigation in the building sector.
Bias on Climate Change Trend Assessment: Comparison of Two Strategies of Data Gap Management
Dr. Luciano Massetti, Institute of Biometeorology – National Research Council, Firenze, Italy
Overview: Gaps in temperature series can introduce a bias in global warming assessment. This study evaluates the uncertainty introduced by two methods of dealing with missing data on temperature trend analysis.
Thermal Performance Improvement of Lightweight Transportable Buildings: Testing Energy Saving Properties of an Industrial Ceramic Coating
David Goodfield, School of Engineering and Information Technology, Murdoch University, Murdoch, Australia
Dr. Martin Anda, Department of Environmental Science Division of Science and Engineering, Murdoch University, Perth, Australia
Goen Ho, School of Engineering and Information Technology, Murdoch University, Murdoch, Australia
Overview: Maintaining thermal comfort levels in lightweight transportable buildings, in all climate zones, consumes large amounts of energy. This can be substantially reduced without modifying the current form of construction.
Global Warming: Housing in Bangladesh Delta Area During Floods and Tidal Surges
Mustakima Hussain, Department of Architecture, Lund Institute of Technology, Lund University, Lund, Sweden
Overview: Due to climate change 45 cm rise in sea level could lead to the destruction of 75% of the Sundarbans mangroves. A sustainable construction method is proposed here.
Accelerating Climate Adaptation in the Lake Superior Watershed: Lessons from the World’s Fastest Warming Lake
Carl Lindquist, Climate Adaptation and Watershed Protection, Superior Watershed Partnership, Marquette, USA
Overview: Lake Superior is the fastest warming lake on the planet. Learn how coastal communities are accelerating the pace of climate planning and implementing adaptation projects that really make a difference.
Felt Knowledge: Using Critical Pedagogy and Bioregionalism to Form an Empathic and Practical Understanding of Climate Change Consequences
Matthew McKinney, Department of English -PhD Candidate -Emphasis in Rhetoric and Composition, The University of Nevada, Reno, Reno, USA
Overview: My paper proposes an educational model for cultivating an empathic and practical understanding of climate change. This educational model, in turn, draws from critical pedagogical methodology and bioregional literature.
Visualizing Climate Change: Bringing Meaning to Climate Change Science through Local Engagement and Visual Learning Processes
Dr. Stephen Sheppard, Collaborative for Advanced Landscape Planning (CALP) Dept. of Forest Resources Management/School of Architecture and Landscape Architecture, University of British Columbia, Vancouver, Canada
Dr. Olaf Schroth, Department of Landscape, University of Sheffield, Sheffield, UK
Overview: We summarize findings from climate change studies using visualization-based approaches to engage Canadian communities; then describe action research applying visual media through neighborhood climate change tours and educational video games.
Responding to Climate Change through Joint Partnership: Small Farmers and Scientists Seek Ways of Combating Climate Change and Variability in the Okavango Delta of Botswana
Dr. Oluwatoyin Dare Kolawole, Okavango Research Institute, University of Botswana, Maun, Botswana
Overview: Resource-poor African farmers are already feeling the impact of climate change. Small farmers and weather scientists in the Okavango Delta were brought together to devise means of overcoming the challenges.
Women and Climate Change Adaptation in Bangladesh
Mumita Tanjeela, Centre for Governance and Public Policy School of Government and International Relations, Griffith University, Queensland, Australia., Brisbane, Australia
Overview: Climate vulnerability in Bangladesh is strongly associated with gender relations. Women take responsibilities of climate dependent activities like agriculture, water and food management. Gendered experiences are significant for climate response.
Health and Climate
Climate Change and Health: Implications for Small Communities in Arid Regions of Australia
Dr. Meryl Pearce-Churchill, School of the Environment, Flinders University, Adelaide, Australia
Prof. Eileen Willis, Flinders University, Adelaide, Australia
Dr. Ben Wadham, Flinders University, Adelaide, Australia
Prof. Lynne Eagle, James Cook University, Townsville, Australia
David Low, James Cook University
Overview: The impact of extreme climate conditions similar to those predicted under climate change scenarios, on human wellbeing is outlined. Those whose livelihood is linked to climate will be most affected.
The Association between Meteorological Variables and Hospitalizations for Heat Stroke, Heat Syncope, and Heat Exhaustion: Hong Kong from 2002-2011
Dr. William Goggins, School of Public Health and Primary Care, The Chinese University of Hong Kong, Hong Kong, Hong Kong
Prof. Emily YY Chan, School of Public Health and Primary Care, The Chinese University of Hong Kong, Hong Kong
Overview: This is a time-series analysis of the association between environmental variables including temperature, relative humidity, wind speed, solar radiation and pollutants and hospitalizations for heat stroke/heat syncope/ heat exhaustion.
Nutrition-related Health Impacts of Droughts in LMICs: A Review of Literature
Kristine Belesova, Department of Social and Environmental Health Research, London School of Hygiene and Tropical Medicine, London, UK
Prof. Paul Wilkinson, Department of Social and Environmental Health Research, London School of Hygiene and Tropical Medicine, Lonson, UK
Overview: The review of literature demonstrates negative impacts of droughts on human health and nutrition in the developing world. These impacts vary with levels of exposure, vulnerability, and with contextual factors.
Alternative Media Counterbalancing Mainstream Media? Alternative Media as Distributors of a “Sense of Urgency”
Renée Moernaut, Department of Applied Linguistics, Vrije Universiteit Brussel, Brussels, Belgium
Overview: Based on a qualitative framing analysis, we argue that alternative media are remodeling the media discussion on climate change, counterbalancing, as such, the hegemonic frames distributed by the mainstream press.
Pesticide Fate in a Changing Climate: A Danish Case Study
Signe Rasmussen, Faculty of Science Department of Plants and Environment Section of Environmental Chemistry and Physics, Copenhagen University, Copenhagen, Denmark
Overview: This is a risk assessment of pesticide leaching from agricultural soils in the context of climate change.
Climate Change Vulnerability and Affordable Housing in Queensland
Andrew Venning, Sustainable Research Centre, The University of the Sunshine Coast, Maroochydore, Australia
Overview: An approach to minimise inequities on the vulnerable in climate change, is the legal regime that formulates/engages society to adapt to environmental and societal change (McDonald 2011, Ruhl 2011,Craig 2010).
Mitigating Climate Change through Photovoltaic Adoption: An Integrated SWOT-AHP Analysis
Kathrin Reinsberger, ISIS – Institute for Systems Sciences, Innovation & Sustainability Research, University of Graz, Graz, Austria
Overview: Based on innovation and decision theory, the aim is to gain insights into strengths, weaknesses, opportunities and threats of photovoltaic technology.
States of Change: Climate Change Threats to the States of the South Pacific
Dr. James Pasley, Park University, Parkville, USA
Overview: This paper examines the threat climate change poses to microstates in the South Pacific. It then assesses the political response from the impacted countries as well as the international community.
Development of an Interactive Videogame to Determine the Impact of Decision Variables in a Lake’s Water Balance Model
Sebastian Mesa Marin, Grupo GAIA/University of Antioquia, Medellín, Colombia
Julio Eduardo Canon Barriga, Grupo GAIA/University of Antioquia, Medellin, Colombia
Overview: Tropical lakes are influenced by fluctuations associated with climatic and anthropogenic drivers, to simulate the anthropogenic interventions we decided to develop a video game that will provide people’s attitude and strategies.
Comparing Climate Change Perception of Heterogeneous Farm Households in Semi-arid Region of Ghana
Biola K. Badmos, West African Science Service Center on Climate Change and Adapted Land Use (WASCAL), Civil Engineering Kwame Nkrumah University of science and technology, Kumasi, Ghana
Dr. Grace B. Villamor, Bonn, Germany
Prof. Sampson K. Agodzo, Kumasi, Ghana
Prof. Samuel N. Odai, Kumasi, Ghana
Samson O. Awopeju, United Nations Convention to Combat Desertification (UNCDD), Germany
Overview: This paper identified household types based on their assets (human, natural and financial). Perceptions of climate change were compared, thus providing information that could inform policy.
CO2 Emission Reduction from Blast Furnace by Iron-reducing Microorganisms
Prof. Motonori Tamura, Center for Industrial and Governmental Relations, The University of Electro-Communications, Chofu, Japan
Overview: Microbial reduction of Fe(III) influences the biogeochemical cycles of carbon, and can greatly reduce CO2 Emission in steel making process. Geobacter, Anaeromyxobacter and Proteobacteria were identified as iron-reducing microorganisms.
Climate Change Adaptation in the Forests of Western Newfoundland: Using Structured Decision-Making to Elicit Expert Opinion
Liam Matthew Miller, Environmental Policy Institute, Memorial University of Newfoundland, Corner Brook, Canada
Dr. Micheal van Zyll de Jong, Environmental Policy Institute, Memorial University of Newfoundland, Corner Brook, Canada
Overview: This research explores how climate changes is expected to affect forests in Western Newfoundland, what adaptation strategies should be used, and the current capacity to implement the strategies.
Reducing the Embodied Carbon of Construction Projects through the Development of a Product-based Carbon Labelling Scheme
Prof. S. Thomas Ng, Department of Civil Engineering, The University of Hong Kong, Hong Kong
Christopher To, Construction Industry Council, Hong Kong, Hong Kong
Overview: A product-based carbon labeling scheme has been developed to delineate low carbon construction materials which facilitates decision-makers building low carbon construction facilities and assists manufacturers reducing the carbon footprint.
Galvanising Climate Ethical Action through Environmental Policies and Multilateral Agreements: Climate Ethics Linked to Environmental Policies
Kalpana Murari, Self-Employed, Chennai, India
Overview: Climate change requires ethical and collective action from nations, individual states, reinforced by modified lifestyle patterns of individuals. Efforts can be galvanized by developing effective, innovative and strategic environmental policies.
Resilience Webs: Climate Change and Food Sovereignty in Southeast New South Wales Australia
Dr. George Bell, Research School of Management, College of Economics and Commerce, The Australian National University, Canberra, Australia
Dr. Karin Geiselhart, Canberra, Australia
Overview: Interlocking community networks working on climate change and food sovereignty illustrate resilience-building webs. Blending theory from sustainable marketing and complex adaptive systems suggests a universally applicable approach.
The Changes in Japanese Media Coverage of Climate Change Policy
Monika Ostrowska, Osaka School of International Public Policy, Osaka University, Osaka, Japan
Overview: Scale and content analysis of major national newspapers shows how the attention to climate change policy options has changed over time. Characteristics of Japan’s policy-making and media’s attention are examined.
Theme: Technical, Political and Social Responses
The Financial System Impediment To Emission Reductions
Roger Boyd, B.C. Alberta Social Economy Research Alliance, Toronto, Canada
Overview: The current global financial system provides a major impediment to the required greenhouse emission reductions, and will require a fundamental redesign and reorientation.
Operationalising Ecological Modernisation Theory
Peter J. Glynn, Institute of Sustainable Development, Bond University, Gold Coast, Australia
Overview: This paper discusses how ecological economics can be used to develop ecological modernisation from a framework to a structured model for policy development.
Economic Consequences of the Climate Change Impacts on Ground Transportation in Atlantic Canada: General Equilibrium Approach
Yuri Yevdokimov, Department of Economics, University of New Brunswick, Fredericton, Canada
Overview: Climate change impacts on regional ground transportation network and their economic consequences are analyzed within dynamic General Equilibrium Model is the topic of this paper.
Could the UK Economy Be Impacted by an Increase in Tornado Occurrence: A Consequence of Climate Change in the 21st Century
Komali Kantamaneni, Faculty of Applied Design and Engineering School of Built and Natural Environment, University of Wales, Trinity Saint David, Swansea, UK
Prof. Mike Phillips, Faculty of Applied Design and Engineering School of Built and Natural Environment, University of Wales Trinity Saint David, Swansea, UK
Dr. Rhian Jenkins, Faculty of Applied Design and Engineering School of Built and Natural Environment, University of Wales Trinity Saint David, Swansea, UK
Judith Oakley, Faculty of Applied Design and Engineering School of Built and Natural Environment, University of Wales Trinity Saint David, Swansea, UK
Kelechi Obinna Ibeabuchi, Faculty of Applied Design and Engineering School of Built and Natural Environment, University of Wales Trinity Saint David, Swansea, UK
Overview: The aim of this research report is to assess and investigate the recent UK tornadoes’ destruction costs and their impacts on national economy.
A Devil’s Advocacy for Carbon Dioxide: A Minor Effect on World Temperature but a Major, Positive Effect on Vegetation
Prof. Joseph Gale, Institute of Life Sciences, The Hebrew University of Jerusalem, Jerusalem, Israel
Prof. Nir Shaviv, Rakach Institute, The Hebrew University of Jerusalem, Jerusalem, Israel
Overview: Recent studies indicate that the effect of CO2 rise will be much less than models promoted by the IPCC. The rise in CO2 may have already increased vegetation production.
Greenhouse Gas Emissions: Contributions Made by Football League Clubs in England
Adekunle Dosumu, School of Biological Sciences, University of Essex, UK
Overview: Waste management is one of the major environmental burdens, resulting in greenhouse gas (GHG) emissions. This study estimates GHG emissions from football clubs in the UK.
Are Protected Areas an Effective Way to Help Mitigate Climate Change? Carbon Sequestration Model Comparison of Protected Area versus Traditional Forestry in a Temperate Forest
Robert Cameron, Protected Areas and Ecosystems Branch, Nova Scotia Department of Environment, Halifax, Canada
Overview: Carbon forest model results for existing and proposed protected areas were compared to results if these areas were managed using traditional forestry.
Earth 2075: Challenges for Restoring 280 ppm CO2 in the 21st Century
Dr. Kenneth Klabunde, Climate Restoration Technologies, Inc., Omaha, USA
Dr. Robert C. Fry, Climate Restoration Technologies, Inc., USA
Madeline Ison, Climate Restoration Technologies, Inc., USA
Dr. SambhudasChaudhuri, Climate Restoration Technologies, Inc., USA
Dr. Gregory Fry, Climate Restoration Technologies, Inc., USA
Barry Wroobel, Climate Restoration Technologies, Inc., USA
Dr. Michael Routh, Climate Restoration Technologies, Inc., USA
Overview: Revised CO2 emissions and capture targets will be reviewed for restoring 280 ppm by 2075. Accumulation impact (ppm CO2) of both hitting and missing these targets will be projected.
The Risk Perception of Coastal Officials as a Determinant of Adaptive Action
Brian Bulla, Department of Forestry & Environmental Resources in the College of Natural Resources, North Carolina State University, Raleigh, USA
Overview: This study examines the risk perception of North Carolina coastal officials, and questions how those perceptions influence the willingness or reticence of officials to initiate adaptive action regarding climate change.
Achieving Low Emissions Growth in Vietnam Agriculture: Mitigation Technology Adoption Constraints
Dr. Anna Belova, Environment and Resources Division, Abt Associates Inc., Bethesda, USA
Dr. Tulika Narayan, International Economic Growth, Abt Associates Inc., Bethesda, USA
Overview: To support Vietnam’s Low Emission Development Strategies in agriculture, we analyzed emissions-relevant characteristics, costs, and adoption constraints for rice and livestock production technologies using representative farmer surveys in three provinces.
The Epidemic of Human Adiposity and Its Impact on the Environment
Dr. Jianhong Xue, Department of Agricultural Economics, Northwest A&F University, Yangling, China
Jieqiong Wei, Department of Agricultural Economics Department of Applied Mathematics, Northwest A&F University, Yangling, China
Wenjing Zhang, Department of Agricultural Economics, Northwest A&F University, Yangling, China
Dr. Khadim Hussain, Department of Agricultural Economics, Northwest A&F University, Yangling, China
Overview: While delineating the pathways linking overweight and obesity to environmental problems, the proposed study estimates the environmental impact of adiposity in terms of greenhouse gas emission for a given population.
Super Typhoon Haiyan: Global Warming Concerns, Resource Loss, and Psychological Distress among Survivors in the Philippines
Dr. David Sattler, Western Institute for Social Research, Department of Psychology, Western Washington University, Bellingham, USA
Richard Atienza, Department of American Ethnic Studies, University of Washington, Seattle, USA
Overview: Super Typhoon Haiyan devastated the Philippines. We interviewed 335 survivors in coastal villages. Concerns about global warming’s contribution to typhoon intensity and future typhoon threats were associated with posttraumatic stress.
Implications of Climate Change Impacts in Rural Coastal Communities with Aging Populations: Cases from Nova Scotia, Canada
Dr. Patricia Manuel, School of Planning, Dalhousie University, Halifax, Canada
Prof. Eric Rapaport, School of Planning, Dalhousie University, Halifax, Canada
Dr. Janice Keefe, Department of Family Studies and Gerontology, Mount Saint Vincent University, Halifax, Canada
Overview: Rural coastal communities with aging populations have special challenges of vulnerability to flooding. We identify infrastructure, design and policy challenges and opportunities for age-friendly coastal communities facing climate change impacts.
The Association between Meteorological Parameters and Salmonella, Norovirus and Rotavirus Infection in Hong Kong
Pin Wang, School of Public Health and Primary Care, The Chinese University of Hong Kong, Hong Kong, Hong Kong
Overview: This is a time-series analysis on the association between several meteorological parameters and salmonella, norovirus and rotavirus infection in Hong Kong from 2002 to 2011 using generalized additive models.
Climate Change Certification: Be Part of the Start
Simon Cavendish, Climate Change Special Interest Section, Environment Institute of Australia and New Zealand (EIANZ), Brisbane, Australia
Maia Cavendish, Brisbane, Australia
Tess McGahan, Brisbane, Australia
Rosemary Lancaster, Brisbane, Australia
Overview: As climate change practice evolves, the community needs assurance that practitioners are competent. Australian and New Zealand professionals have developed a certification scheme. Proficiencies need refinement from practitioners like you!
Climate Justice Activism: A Visioning Workshop
John Foran, Department of Sociology, University of California, Santa Barbara, Santa Barbara, USA
Overview: Workshop participants will be guided through a conversation on the nature and ends of climate justice, and the best practices of global climate justice movement activists in achieving it.
Integrating Ecological Genetics and Population Dynamic Modelling to Evaluate Persistence of Endangered Swamp Orchids in a Changing World
Laura Simmons, GeneCology Research Centre, University of the Sunshine Coast, Sippy Downs, Australia
Dr. Alison Shapcott, GeneCology Research Centre, University of the Sunshine Coast, Sippy Downs, Australia
Overview: Our case study is an endangered Australian orchid species with narrow ecological tolerances and use of integrated population dynamic studies and ecological genetics to model coastal ecosystem climate change transitions.
Projected Impacts of Climate Change on Grizzly Bear Habitat in Canada
David Laskin, Dept. of Geography, University of Calgary, Calgary, Canada
Overview: A combination of climate-controlled growth chamber experiments, ground-camera network observations, and satellite-derived phenology models were used to predict the impact of climate scenarios on grizzly bear habitat in Alberta, Canada.
Adaptation Pathways for Coastal Settlements in Victoria, Australia
Murray Herron, School of Architecture and Built Environment, Faculty of Science Engineering and Built Environment, Deakin University, Geelong, Australia
Phillip B. Roös, School of Architecture and Built Environment, Faculty of Science Engineering & Built Environment, Deakin University, Geelong, Australia
Overview: The Victorian coastline is in peril due to population growth and future climate change impacts. This paper identifies adaptation pathways for sustainable development planning with visualisation models of coastal recession.
Permafrost Thaw, Biogeochemical Cycling, and Plant Biology in the Alaskan Taiga
Rebecca Finger, Department of Biology and Wildlife, University of Alaska Fairbanks, Fairbanks, USA
Dr. Eugenie Euskirchen, Institute of Arctic Biology, University of Alaska Fairbanks, Fairbanks, USA
Dr. Merritt Turetsky, Department of Integrative Biology, University of Guelph, Guelph, Canada
Overview: Climate change is creating widespread permafrost thaw and drastically changing the boreal forest landscape. This study investigates the effects of permafrost thaw on biogeochemical cycling and local plant communities.
Representing Climate Data Visually: Inquiry-based Lessons about Climate Science and Climate Change for K-12 Students Using Local, Online Climate Data for Spatial and Graphical Analysis
Dr. Lawrence Rudd, School of Education, Nevada State College, Henderson, USA
Overview: Student visualization of climate science and climate change is emphasized in inquiry-based lessons created using online data. Weather, climate, and vegetation are studied using graphs, imagery, and Google Earth.
Climate Shocks and Human Capital: The Impact of Natural Disasters on Students’ Performance on Standardized Tests
Mauricio Giovanni Valencia-Amaya, Universidad de Antioquia, Medellín, Colombia
Overview: Using a difference-in-difference approach, this paper investigates the impact of climate shocks on qualitative measures of human capital, such as test scores results.
Environmental Art as Medium for Climate Change Communication: A Festival’s Impact on Its Audience
Megan Marks, Faculty of Arts and Business, University of the Sunshine Coast, Marcus Beach, Australia
Overview: Environmental art can provide an imaginative format for delivering climate change messages. This quantitative/qualitative research explored the impact of a government-initiated environmental art festival in changing people’s environmental behaviours.
Theme: Technical, Political and Social Responses
The Climate Change Controversies on a Global Scale: Sciences and Its Ideologies, 1992-2012
Dr. Ricardo M. Figueiredo F., Federal University of Minas Gerais (History Post-Graduation Program)., University Of Minas Gerais, Belo Horizonte, Brazil
Overview: Despite what the IPCC has been asserting on a global climate change it isn’t a consensus among the climatologists. In this matter, this paper analyzes some of these controversies.
Sequestration and Substitution: How Do Stakeholders in the UK Woodland Sector View Their Role in Climate Change Mitigation?
Dr. Clare Hall, Research Division, SRUC, Edinburgh, UK
Overview: This research aims to investigate UK woodland sector stakeholder views, awareness and experience of carbon sequestration and substitution activities and the variables that may influence such views and awareness.
Greenpeace, Climate Change, and the Battle for the Arctic
Dr. James Everett Hein, Media and Communication, Erasmus University Rotterdam, Rotterdam, Netherlands
Overview: In this paper I report the innovative online and offline communication tactics used by Greenpeace in their climate change campaign against Royal Dutch Shell’s plans to drill in the Arctic.
Developing Adaptation Pathways for NRM in Southern Australia: A Research-practice Collaboration
Dr. Karyn Bosomworth, Centre for Risk and Community Safety Climate Change Adaptation Program, RMIT University, Melbourne, Australia
Dr. Andrew Harwood, Geography and Environmental Studies, University of Tasmania, Hobart, Australia
Nooshin Toorabi, Global, Urban and Social Studies, RMIT University, Melbourne, Australia
Dr. Peat Leith, Tasmanian Institute of Agriculture, University of Tasmania, Hobart, Australia
Dr. Philip Wallis, Monash Sustainability Institute, Monash University, Melbourne, Australia
Overview: This paper is an action-research project that draws on the concept of adaptation pathways to support natural resource managers in developing and implementing adaptive climate change plans.
There is No Place Like Home: Pacific Islanders and Relocation
Brook Meakins, Drowning Islands, Berkeley, USA
Overview: This paper analyzes two historic, forced relocations from the Pacific, and contrasts these relocations with a modern, voluntary relocation in Fiji.
The Justification Of Negative Impacts On Climate Change: An Exploration Of Discursive Strategies Used By Industrial Emitters
David Talbot, Département de Management, Université Laval, Quebec, Canada
Dr. Olivier Boiral, Département de Management, Université Laval, Québec, Canada
Overview: The paper explores the impression management tactics used by industrial companies to justify the impact of their operations on global warming.
Laughing All the Way to the Apocalypse: The Rhetorical Effects of Satire on Climate Change Activism and Awareness
Luke E. Kingery, English Department Composition and Rhetoric, University of Nevada, Reno, Reno, USA
Overview: Humor theorists have shown that humor/satire can both cathartic, societal release as well as promote apathy. I will explore the rhetorical and societal effects of climate-change satire on awareness campaigns.
The Social Responses to Impacts of Climate Change in Thailand: A Preliminary Study of Adaptive Strategies Used by Communities Affected by Landslides and Flooding Since 2011
Somporn Khunwishit, Department of Public Administration, Faculty of Management Sciences, Prince of Songkla University, Hat Yai, Thailand
Overview: This paper examines how Thai communities develop environmental policies, disaster management measures and social mechanisms to deal with natural disasters, given their experience in facing landslides and flooding in 2011.
Social Costs of Industrial Growth: Which American States Manufacture More Efficiently in Terms of Air Pollution?
Dr. James Tanoos, Business & CIS Dept., Saint Mary-of-the-Woods College, Terre Haute, USA
Overview: Using economic data and recent toxic release findings, this paper describes which American states and which region of the country manufacture products in the most sustainable, green efficient fashion.
Agreements on Climate Change between the South and North Korea
Dr. Misun Park, Research Institute for Agriculture and Life Sciences, Seoul National University, Seoul, South Korea
Prof. Hyowon Lee, School of Law, Seoul National University, Seoul, South Korea
Overview: This study aims to review environmental agreements between the South and North Korea and provide some instructions for protocol of agreements on climate change between the South and North Korea.
Earth 2075: Energy and Transportation as Primary Engines for Climate Restoration and Ocean Revitalization
Dr. Robert C. Fry, R&D, Climate Restoration Technologies, Inc., Omaha, USA
Dr. SambhudasChaudhuri, R&D – concept development, Climate Restoration Technologies, Inc., USA
Dr. Kenneth Klabunde, R&D, Climate Restoration Technologies, Inc., Manhattan, USA
Madeline Ison, R&D, Climate Restoration Technologies, Inc., Omaha, USA
Dr. Michael Routh, Board of Directors, Climate Restoration Technologies, Inc., Boulder, USA
Barry Wroobel, R&D, Climate Restoration Technologies, Inc., Moorpark, USA
Dr. Steven Fry, R&D, Climate Restoration Technologies, Inc., Merida, Mexico
Dr. Gregory Fry, Director, Climate Restoration Technologies, Inc., Omaha, USA
Dr. Steven Hughes, R&D, Climate Restoration Technologies, Inc., Littleton, USA
Grant Gower, Administration, Climate Restoration Technologies, Inc., Newbury Park, USA
Benjamin Fry, R&D, Climate Restoration Technologies, Inc., Omaha, USA
Overview: Fossil fuel consumption may be transformed from global warming and ocean acidification culprit into a primary means of climate restoration and ocean revitalization by driving two-stage ocean algal blooming.
Impact of the Scaling Behavior of Global Sea Surface Temperature
Yee Leung, Department of Geography and Resource Management, The Chinese University of Hong Kong, Hong Kong, China
Ming Luo, Department of Geography and Resource Management, The Chinese University of Hong Kong, Hong Kong, China
Overview: This paper discusses the temporal scaling behaviors of the monthly sea surface temperature (SST) anomalies from January 1856 to December 2011 and their impacts on climate dynamics.
 For reference, the compounds above are as follows: H2SO4 – Sulfuric Acid, PbO2 – Lead Oxide, PbSO4 – Lead Sulfate, H2O –Water, Pb – Lead.
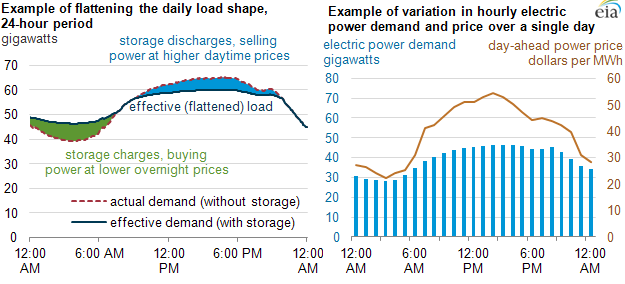
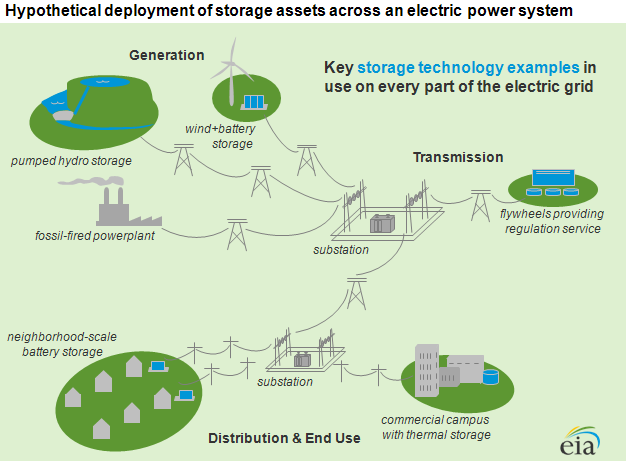
 For storage we use electrical power to pump water to a reservoir uphill and when we need the extra power we use the stored water to run the power station below like a regular hydroelectric generation.