I am back to focusing on water (you can use the search engine here to find the previous related blogs) for two important reasons:
- On Wednesday (tomorrow) I am participating in Bard College’s Bi-Weekly National Climate Seminar and will be discussing desalination. The audio file of the conversation will be posted here (in addition to the posting on the Bard site – I am thankful to the Bard College Center for Environmental Policy for facilitating the talk). I invite you to continue the conversation through comments here.
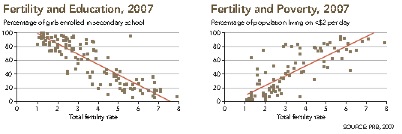
- My last few blogs looked at various attempts to achieve demographic stability, as implemented by China and Israel. Unfortunately, the efforts of both countries were found to be wanting, so I am shifting back to water as I continue the search for policies that will achieve sustainable long-term human development.
Here I would like to shift to water management, using the example of Israel once again, since it has become a figure for emulation in the United States. Through its efforts in water management, Israel, which sits in a historically water-thirsty region, has gone from a country in severe water stress to one that can actually export significant amounts of water to its neighbor to achieve policy objectives. Israel is now receiving almost universal praise for its efforts in this area. I will elaborate later on the meaning of “almost.”
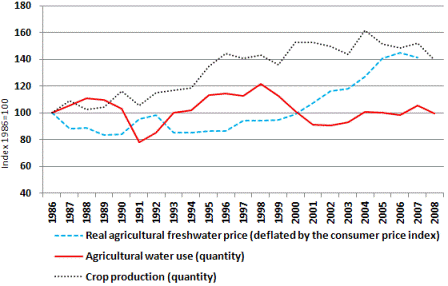
The graph above is probably one of the best testaments to the success of this water management policy. Over the last 20 years or so, water use for agriculture has been kept steady, even while crop production increases. As we will see shortly, one of the main tools for this accomplishment has been an increase in the price of the water. The graph was posted by an objective arbiter, and I am using it so as to avoid any potential political (pro-Israeli) bias.
I will introduce the Israeli water management system with the use of two documents: the first is a 2006 PowerPoint presentation by Gilad Fernandes, who served as Deputy Director-General of the Water Authority, while the second document is an article from the Israeli newspaper, Haaretz that describes the present situation.
The Water Authority Document:
To make the presentation readable I have converted it into an outline in document form.
Management of the Water Section in Israel:
- Legal Basis – The Water Law 1959:
- Water availability is insufficient for needs.
- Water is owned by the public and managed by the Government (as trustee) for the benefit of the people and the development of the country.
- Administrative control over all aspects of water use (Consumption, Allocations, Productions, Pollution…).
- The Water Law created a balance between water scarcity and the need to provide water for the most important needs.
- Physical Infrastructure – The National Grid.
- Institutional Infrastructure – The Water Authority.
 Water Authority responsibilities:
- Water Authority strengthened and regulation decreased.
- Water Authority provides efficient organizational solutions: economic management of water system, supply and demand criteria, cancel allocation system.
- Water prices – express real cost.
- State of reservoir and supply area determine utilization limits.
- Stabilizing the water sector – the produced water resources are of steady production rate, the scope of utilization from natural resources depends on the status of the reservoir.
- Guaranteeing water supply at fixed quality for drinking and industrial needs.
- Efficient integration of the water resources in the regional systems while referring to development and operation considerations.
- Desalinated water as the source for urban and industrial provision – an examined option – while detaching networks.
- Establishing an operational layout – operating all water resources according to the hydrological situation, their transfer and distribution to the consumers.
Economic Background:
- Usable water from all sources – natural, salinated, desalinated and even effluents – are rear public resources and therefore should be regulated, using Hydrological operational and economical measures.
- The economic regulation is based on tariffs that cover the recognized costs of various water supply services and therefore creates an efficient use of this resource.
- The economic regulation is subjected to sectarian and political agreements such as the agreement with the agricultural sector and the water supply agreements with Jordan & the PA (Palestinian Authority).
- Unrealistic tariffs è Enhanced Demand èrisk of water supply crisis.
- Realistic cost based tariffs è efficient allocation of water.
- In the future – significant increase in water supply costs (Desalination) and therefore an increase in cost based tariffs.
Economic Policy: Methodology for recognized costs of water supplies:
- The Goal – creating a “transparent” methodology for analyzing recognized costs that enable an efficient supply of water.
- Providing resources for infrastructures needed for water supply (separate component in the tariff, separate designated fund).
- Defining normative expenses components (& profit) essential for providing services whilst enhancing efficiency.
- Creating regulatory environment that enables non-discriminatory (consumers, competition).
- Creating regulatory environment that encourage the use of efficient water technologies.
- Representing the cost (and derived tariff) methodology alternatives to the Water Authority board (Inc. public hearing if necessary).
- Implementing the Water Authority board decisions.
The main trend – Increase in costs & tariffs
- Potable water-production and transfer:
- Increase in Desalination increase in production costs. Currently the annual production of Desalinated water is 290 MCM (Million Cubic Meter) (= 10 billion ft3) (20% of total potable water (drinking water)). In 2013 the annual production of Desalinated water will be 600MCM (40% of total potable water).
- Results:
- Increase in water costs – Desalinated water cost about 0.6 – 0.8 US$/meter cube (1.7 – 2 US$/ft3).
- Investment in connecting the desalination plants to the national grid.
- Investments in adopting the transfer system.
- Creating a regulation system for Mekorot (the main water supplier) that will enable an efficient investment plan.
- Increase in Desalination increase in production costs. Currently the annual production of Desalinated water is 290 MCM (Million Cubic Meter) (= 10 billion ft3) (20% of total potable water (drinking water)). In 2013 the annual production of Desalinated water will be 600MCM (40% of total potable water).
- Potable water-Agricultural Sector:
- Decrease in allocated annual quantities – a decrease from 1000 MCM a decade ago to 480 MCM today (the agricultural potable water tariffs are about 0.14US$ lower than the supply costs).
- Results:
- Increase effectiveness of potable water usage in agriculture.
- Increase of other water – treated sewage water (400 MCM) drainage and salinated water (250MCM).
- Increasing agricultural potable water tariffs to the average water supply cost (in 7 years span according to the agreement).
- Municipal water supply – Municipal authorities:
- The water supply system wasn’t based on authentic finance economy è ability to use water revenues for other municipal services..
- The municipal authority as a customer (for instance in water in parks & gardens) doesn’t pay a realistic tariff (Mekorot tariff, excluding distribution).
- Creating incentives for new water service corporations & creating a tariff basis similar to the municipal corporations.
- Municipal water supply – Water & sewage corporations:
- Defining tariffs that reflect recognizing water & sewage services costs.
- Using corporate revenues for maintenance & development of the municipal water system including additional investments in water distribution & sewage collection.
- Construction/upgrading sewage treatment facilities.
- In accordance with government policy-creating regional corporations for water distribution, sewage collection & treatment whilst enhancing economy of scale advantages.
Water Supply Costs:
- Natural water supply costs range from 0.15 – 0.45 US$/m3.
- Seawater desalination costs at the distribution system range from 0.6 – 0.8 US$/m3 (excluding connection to the main system).
- The average cost of the National Water Supply System is about 0.35 US$/m3.
- This cost will raise in the following years in 40% – 50% (grate investments).
- Distribution costs range from 0.4 – 0.75 US$/m3.
- Based on recognized costs to every Corp.
Tariffs (per cubic meter (CM)):
- Domestic:
- Corp./Municipality: $1.15
- Consumers:
- $2.4 per first 7 cubic meters
- $4 per additional cubic meter.
- Corp./Municipality: $1.15
- Industrial:
- Potable water (in addition to sewage tariff) – $1.35
- Treated effluent 20% less than potable
- Saline water 15% less than potable.
- Inferior quality water 20% less than potable.
- Agricultural:
- Potable Water
- 1st. Tranche (50% of allocation) – $0.5
- 2nd. Tranche (30% of allocation) – $0.6
- 3rd. Tranche (20% of allocation) – $0.75
- b. Treated Effluent
- About $0.35 (varies with the treatment plant)
- c. Saline Water
- Gradual reduction from composite tariff for potable water based on salinity level.
- Potable Water
Excerpts from the Haaretz article about the present situation:
In ancient times and even during the years of the British Mandate (1917-1948), the shortage of water in Palestine, as well as among its neighbors in the Middle East, had a decisive influence not only on the area’s economic development, but also on the political strife between Jews and Arabs. Technology has changed all this. Now, the ability to produce all the water that’s needed, whether for human consumption or for agriculture, may soon change our way of life and perhaps even, if our neighbors agree, bring peace closer.
There is now a surplus of water in Israel, thanks largely to the opening of several new desalination plants – and the development of natural-gas fields that can power them cheaply. Since water is the source of life, the well-known Israeli imperative to “save every drop” should still be respected. But the price the Israeli population is charged for its water supply should be reduced by more than the 5 percent drop announced on January 1 of this year.
Desalination in Israel began in 1973, when Mekorot built facilities that operated by reverse osmosis; these supplied the Dead Sea, Eilat and communities not served by the National Water Carrier. It was only 35 years later, in 2008, that the government decided to establish five large desalination plants along the Mediterranean coast, with the aim of providing 505 million cubic meters of water a year by 2013 (a forecast met in full) and 750 million cubic meters a year by 2020. However, since 2008, two technological revolutions – both of which also have far-reaching political implications – have radically altered the water situation in Israel.
The first revolution is the immense decrease in the cost of desalination – from $1 per cubic meter to 40 cents, and even less than that in desalination plants built in Hadera, Palmahim, Ashkelon and at Sorek. The savings will grow further thanks to the use of Israeli natural gas instead of electricity to power the plants. The second revolution is the success of the plants used to purify sewage water that were built adjacent to Israel’s cities and towns. Thanks to efficient usage, this water now irrigates most of the country’s field crops
There are at least three explanations for this uncharacteristic silence, in the face of success and the concomitant abundance of water Israel now enjoys. One is that even though the cost of desalination has fallen considerably, the government promised the investors a high price for the water. The government can reduce the amount of water it buys from the desalination facilities, but it cannot pay less than what it promised.
In the next blog I will compare the situation in Israel to the one in the US, focusing specifically on California.
For now, let’s revisit the “almost” qualifier that I mentioned in the beginning of the blog. Two related events took place recently. One is the water situation in Gaza, for which Israel is partially responsible. The Gazans don’t have the power to clean their sewage and are forced instead to dump it in the Mediterranean. The northern border of Gaza is only a few miles from the large Israeli city of Ashkelon, where one of the largest Israeli desalination facilities is located. Ashkelon will not be isolated from the sea dumping for long. I detailed this situation in a previous blog (December 2, 2013), which was based on an Op-Ed in the New York Times. The article was co-authored by Alon Tal, who teaches at Ben-Gurion University of the Negev and is a visiting professor at the Center for Conservation Biology at Stanford University, and Yousef Abu-Mayla, a water expert at Al Azhar University in Gaza.
The second issue is more recent. The President of the European Parliament came to visit Israel. He was heckled during his speech in the Israeli Parliament for saying that he had heard that “Palestinians get 17 liters of water for every 70 Israelis get,” and his comment prompted the Economic Minister and his entire Bayit Yehudi (Jewish Home) party to leave in protest. The strong prevailing impression is that while the water management system is great for the Jewish population, it is not disconnected from the Israeli-Palestinian conflict. The Israeli water management system’s success can serve as an encouraging example of how to handle human development indicators for long term sustainability – provided that it is combined with a clear non discrimination policy. On the face of it – in terms of theory – the system is disconnected from short term politics. This disconnection needs to be extended to the implementation stage. More on this in future blogs.