The IPCC, the Burning House, and the 100% Tipping Point

Following the publication of the IPCC Working Group I’s 5th assessment report (AR5), I posted my own response (October 1). I addressed the issue of raising the confidence level of significant human contributions to climate change to 95% – or “extremely likely.” Deniers have made the claim that 95% confidence is not enough to necessitate that we all engage in a massive effort to minimize the impact by changing behavior. They require 100% certainty before they are willing to take preventative actions. I took a rather dim view of that position, which I have summarized as follows:

The other side of this issue is that if a fire inspector were to find a 95% chance that our house would catch fire, he would tell us to fix the vulnerability immediately, especially given that no insurance company in the world would be willing to insure us. The only time that we can be 100% certain that the house is going to catch fire is after the house is already aflame. At that time, the only thing left to do is to try to get out as fast as possible. Presently we cannot get out of this planet – we have no place else to go.

Here I would like to expand on this issue.

Malcolm Gladwell defines Tipping Point as: “the moment of critical mass, the threshold, the boiling point.” The term has become a central feature in the climate change debate (often identified as a “large scale discontinuity”).  I have used it repeatedly on this blog site (just use the search facility for access). I consider the transition from 95% to 100% certainty to be the mother of all tipping points – it is a threshold jump from future to past: the jump from having some ability to affect future data to the inevitable eventuality where the only available option is to try to minimize the effects of events that have already occurred.

When I Google “Physics of the Future,” I mostly turn up entries from Michio Kaku’s (a fellow faculty member at the City University of New York) recent book by that title. His book describes the wonders that we might or might not discover in the distant future as we explore the boundaries of Physics. But the term has another description that is shown in a famous diagram given below.

The diagram describes the path that a flash of light, emanating from a single event (localized to a single point in space and a single moment in time) and traveling in all directions, would take through spacetime. It derives from Einstein’s Special Theory of Relativity. The double cone is anchored on the premise at the heart of the theory, which postulates that although the speed of light is the fastest speed that can be attained, it is still a finite speed. It can be generalized to our ability to gather information by postulating that the only way that we can gather information is through shining light on the object that we are interested in and analyzing the light that comes back. Since light travels at a finite speed, it takes time for the light to move to the object and get back reflected to us. Based on such an interpretation, the two cones in the figure represent the maximum information that we can attain. The walls of the cones are presented on a scale of the time multiplied by the speed of light. The upper cone represents the future, while the lower cone represents the past. In the middle, we have the present – the here and now. We have no available information about the present because it takes time to gather the information.

Light Cone Theory of Relativity

(From “Brief History of Time” by Stephen Hawking; Ch.2, 1988, Bantam Dell Publishing.)

The transition from a 95% probability of our house catching fire to the 100% certainty that our house is actually on fire fits Gladwell’s definition of a tipping point probably better than any other phenomenon – we move from predicting an event to either observing or (if the event itself has a finite duration) having just observed said event.

As I have mentioned before (June 18, 2012 blog)

I subscribe to the Popperian definition of the scientific method that is based on refutability and denies the existence of “general truths.”  A theory is “true” until it is refuted by observations; if it cannot be refuted – it is not science.

Refutability is a statement about our ability to make predictions of the future and then observe whether those predictions are coming true or not. 100% certainty doesn’t exist in science.  As a rule, if something is 100% certain, it is not science.

I will finish this blog with a quote that I used in a previous blog (September 3, 2012) from an address by Luiz Inácio Lula da Silva, the former (2003-2010) president of Brazil, in a reported comment on the European fiscal crisis: “Let’s be frank: if Germany had resolved the Greek problem years ago, it wouldn’t have worsened like this. I’ve seen people die of gangrene because they didn’t care for a problematic toenail.”

The problematic toenail was a predictor of what might have happened in the future. Once a serious gangrene takes over, there is very little that we can do. Between gangrene and a burning home, we have indicators of an impending disaster (or series thereof) – why should we wait for an eventuality to become an actuality?

Posted in Climate Change | Tagged , , , , , , , , , , , , , , , , , , | 1 Comment

Desalination: The Science

I discussed the effects of climate change on the water cycle in a previous blog (September 3). I focused on the fact that while the water cycle is not a perfect cycle, our planet, whose surface consists of 70% water, cannot experience shortage of water. Instead, I posited, (August 27, September 3, 10 and 24 blogs) the planet experiences severe shortages of fresh water; a problem that is bound to become worse. Fresh water is essential to survival for almost all of the land species on the planet – including humans. This shortage needs to be addressed. Previous blogs have dealt with addressing the shortage through recycling (September 10) and the better management of use (September 24). This blog and a subsequent blog will try to address the issue through increase in supply.

My previous blog (September 3) included the USGS (United States Geological Survey) version of the water cycle. It looks very scientific and somewhat confusing, so this week I’m giving you a much simpler version that was drawn to teach the cycle to young students. It still includes the most important elements, without providing so much information that the viewer is overwhelmed:

Water Cycle Simple

It emphasizes the way in which the sun-induced evaporation from the ocean separates fresh water from saltwater. By applying this theory on a larger scale, it becomes apparent that if we want to increase the supply of fresh water we will need to increase this separation in a controlled way and therefore must engage in water desalination. To accomplish that, we need to use energy, which means that the issue of addressing water stress is also inherently tied with the need to transition the energy sources that we use.

To start the discussion, we need to have a short look at the science of desalination (Sorry! I know you think Science is boring…).

In another previous blog (June 4, 2012) I mentioned thermodynamics without going into details. Thermodynamics is the area of science that describes the relationship between heat, energy and work. Its two basic laws are arguably the most essential tenets upon which the rest of science is built. If someone were able to refute one of these laws in a credible way, much of science would have to be reformulated. (Obviously, scientists take this definition of “credible way” very seriously). One of these laws is equivalent to the law of the conservation of energy and it tells us that energy cannot be created or destroyed but only converted from one form to another (chemical energy of burning a fuel to mechanical energy of the moving car, as an example). The second of these laws tells us that if a system is left on its own, it will tend to maximize its disorder. When I am discussing this topic in a class with students who have no prerequisites in science, I always make the analogy of a small child lucky enough to have a room of its own. Leave him (or her – gender makes no difference here) alone and the room will quickly get messy. His clothes will be everywhere, his toys will be everywhere and so will everything else that he gets his hands on. The state of the room can obviously be fixed – but not without some effort (i.e. work and expenditure of some energy) either by the parents or, after appropriate bribing, by the old enough kid. The physical reason for the “natural” state of the messy room is that there are simply many more ways for each of his items to find their way into a messy configuration rather than an orderly one. This law is also responsible for, among other things, heat’s tendency to move spontaneously upon contact, from hot object to cold object instead of the other way around; and energy costing approximately three times more to deliver from electricity obtained by burning fuel than from directly burning the fuel.

Back to desalination – if I take a cup of concentrated salt water and dump it into a container of fresh water, the salt will spread around very quickly through the entire sample, making a larger amount of diluted salt water (you can safely try it). The reverse process will never take place on its own because there will be many more ways to distribute the salt particles in a homogeneous solution than any segregation can provide. If we want to mimic the water cycle by separating the fresh water from the salt water we will have to put energy into the system. Nature does this by using solar energy to evaporate vapor of fresh water from the salty ocean. We can mimic the natural process by simply boiling water and collect the resulting steam. This process is used commercially in some places, but is gradually being replaced by the much more efficient process of Reverse Osmosis.

A schematic representation of the Reverse Osmosis process is shown below.

The salt water is “simply” being pushed against a semipermeable membrane that allows the pure water to pass through while retaining the salt particles.

Reverse Osmosis

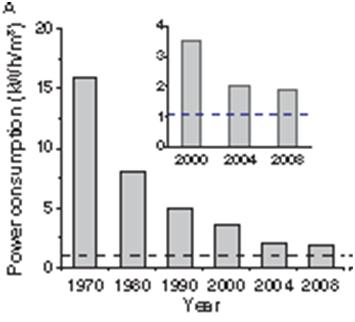
The recent improvements in the power consumption needed for this separation are shown below (from “The Future of Seawater Desalination: Energy, Technology and the Environment” by Menachem Elimelech and William A. Phillip; Science 333, 712 (2011):

Power ConsumptionSuch an improvement in power consumption gives almost everybody hopes for a practical way to address the global water stress. The next few blogs will explore the ways in which this technology has already penetrated our daily lives, as well as how it will continue to do so in the future, and some of the issues that need to be resolved as we progress further.

Posted in Climate Change | Tagged , , , , , , , , , , , , , | 7 Comments

The IPCC, the NIPCC and the Meaning of 95% Certainty

The first part of the IPCC’s (Intergovernmental Panel on Climate Change) 5th report (AR5) came out on Friday. This part consists of the Summary for Policymakers of Working Group I (WGI) that focuses on the physical science basis. The full WGI report is available as of yesterday.

Meanwhile, however, conservative think tank and well known denier group The Heartland Institute didn’t wait for the full report, and has already published its own rebuttal to the WGI report. This rebuttal to the WGI, published by the Heartland-founded NIPCC (Nongovernmental International Panel on Climate Change) contains 1023 pages. I have yet to read them, but promise to do so, as I am going to discuss the AR5 with my class and on my blog.  Since at the time I wrote this, the full AR5 WGI report hadn’t been published yet, I was unable to read it, but I promise to read it and share it with my students and readers as soon as I can.

In order to forestall any arguments that I am picking and choosing sections of the report, I am instead including all of the highlights that were collected in the Summary for the Policymakers report of the WGI report:

Warming of the climate system is unequivocal, and since the 1950s, many of the observed changes are unprecedented over decades to millennia. The atmosphere and ocean have warmed, the amounts of snow and ice have diminished, sea level has risen, and the concentrations of greenhouse gases have increased (see Figures SPM.1, SPM.2, SPM.3 and SPM.4). {2.2, 2.4, 3.2, 3.7, 4.2–4.7, 5.2, 5.3, 5.5–5.6, 6.2, 13.2}.

Each of the last three decades has been successively warmer at the Earth’s surface than any preceding decade since 1850 (see Figure SPM.1). In the Northern Hemisphere, 1983–2012 was likely the warmest 30-year period of the last 1400 years (medium confidence). {2.4, 5.3}.

Ocean warming dominates the increase in energy stored in the climate system, accounting for more than 90% of the energy accumulated between 1971 and 2010 (high confidence). It is virtually certain that the upper ocean (0−700 m) warmed from 1971 to 2010 (see Figure SPM.3), and it likely warmed between the 1870s and 1971. {3.2, Box 3.1}.

Over the last two decades, the Greenland and Antarctic ice sheets have been losing mass, glaciers have continued to shrink almost worldwide, and Arctic sea ice and Northern Hemisphere spring snow cover have continued to decrease in extent (high confidence) (see Figure SPM.3).{4.2–4.7}.

The rate of sea level rise since the mid-19th century has been larger than the mean rate during the previous two millennia (high confidence). Over the period 1901–2010, global mean sea level rose by 0.19 [0.17 to 0.21] m (see Figure SPM.3). {3.7, 5.6, 13.2}.

The atmospheric concentrations of carbon dioxide (CO2), methane, and nitrous oxide have increased to levels unprecedented in at least the last 800,000 years. CO2 concentrations have increased by 40% since pre-industrial times, primarily from fossil fuel emissions and secondarily from net land use change emissions. The ocean has absorbed about 30% of the emitted anthropogenic carbon dioxide, causing ocean acidification (see Figure SPM.4). {2.2, 3.8, 5.2, 6.2,6.3}.

Total radiative forcing is positive, and has led to an uptake of energy by the climate system. The largest contribution to total radiative forcing is caused by the increase in the atmospheric concentration of CO2 since 1750 (see Figure SPM.5). {3.2, Box 3.1, 8.3, 8.5}.

Human influence on the climate system is clear. This is evident from the increasing greenhouse gas concentrations in the atmosphere, positive radiative forcing, observed warming, and understanding of the climate system. {2–14}.

Observational and model studies of temperature change, climate feedbacks and changes in the Earth’s energy budget together provide confidence in the magnitude of global warming in response to past and future forcing. {Box 12.2, Box 13.1}.

Human influence has been detected in warming of the atmosphere and the ocean, in changes in the global water cycle, in reductions in snow and ice, in global mean sea level rise, and in changes in some climate extremes (Figure SPM.6 and Table SPM.1). This evidence for human influence has grown since AR4. It is extremely likely that human influence has been the dominant cause of the observed warming since the mid-20th century. {10.3–10.6, 10.9}.

Continued emissions of greenhouse gases will cause further warming and changes in all components of the climate system. Limiting climate change will require substantial and sustained reductions of greenhouse gas emissions. {Chapters 6, 11, 12, 13, 14}.

Global surface temperature change for the end of the 21st century is likely to exceed 1.5°C relative to 1850 to 1900 for all RCP scenarios except RCP2.6. It is likely to exceed 2°C for RCP6.0 and RCP8.5, and more likely than not to exceed 2°C for RCP4.5. Warming will continue beyond 2100 under all RCP scenarios except RCP2.6. Warming will continue to exhibit interannual-to-decadal variability and will not be regionally uniform (see Figures SPM.7 and SPM.8). {11.3, 12.3, 12.4, 14.8}.

Changes in the global water cycle in response to the warming over the 21st century will not be uniform. The contrast in precipitation between wet and dry regions and between wet and dry seasons will increase, although there may be regional exceptions (see Figure SPM.8). {12.4, 14.3}.

The global ocean will continue to warm during the 21st century. Heat will penetrate from the surface to the deep ocean and affect ocean circulation. {11.3, 12.4}.

It is very likely that the Arctic sea ice cover will continue to shrink and thin and that Northern Hemisphere spring snow cover will decrease during the 21st century as global mean surface temperature rises. Global glacier volume will further decrease. {12.4, 13.4}.

Global mean sea level will continue to rise during the 21st century (see Figure SPM.9). Under all RCP scenarios the rate of sea level rise will very likely exceed that observed during 1971–2010 due to increased ocean warming and increased loss of mass from glaciers and ice sheets. {13.3–13.5}

Climate change will affect carbon cycle processes in a way that will exacerbate the increase of CO2 in the atmosphere (high confidence). Further uptake of carbon by the ocean will increase ocean acidification. {6.4}.

Cumulative emissions of CO2 largely determine global mean surface warming by the late 21st century and beyond (see Figure SPM.10). Most aspects of climate change will persist for many centuries even if emissions of CO2 are stopped. This represents a substantial multi-century climate change commitment created by past, present and future emissions of CO2. {12.5}.

Prior to the release of this latest report, most of the media focused on the two main points that were released early:

Human influence has been detected in warming of the atmosphere and the ocean, in changes in the global water cycle, in reductions in snow and ice, in global mean sea level rise, and in changes in some climate extremes (Figure SPM.6 and Table SPM.1). This evidence for human influence has grown since AR4. It is extremely likely that human influence has been the dominant cause of the observed warming since the mid-20th century. {10.3–10.6, 10.9}.

Changes in the global water cycle in response to the warming over the 21st century will not be uniform. The contrast in precipitation between wet and dry regions and between wet and dry seasons will increase, although there may be regional exceptions (see Figure SPM.8). {12.4, 14.3}.

Both of these statements are in direct response to deniers. The first one addresses the degree of certainty that humans bear major responsibility to climate change. In the IPCC terminology it is “extremely likely” that humans are responsible. The IPCC translates “extremely likely” to around 95% certainty.

The second point addresses the often heard claim that during the last 15 years carbon dioxide emission has continued unabated, while the temperature hardly budged. The argument here was that this behavior shows a disconnect between the carbon dioxide and the temperature rise. A quantitative comparison of model predictions by the IPCC and by various deniers is available on a recent Skeptical Science blog.

With regards to the meaning of 95%, here is what Seth Borenstein wrote on this topic under the title “What 95% certainty of Warming Means to Scientists.

There’s a mismatch between what scientists say about how certain they are and what the general public thinks the experts mean, specialists say.

That is an issue because this week, scientists from around the world have gathered in Stockholm for a meeting of a U.N. panel on climate change, and they will probably release a report saying it is “extremely likely” — which they define in footnotes as 95 percent certain — that humans are mostly to blame for temperatures that have climbed since 1951.

One climate scientist involved says the panel may even boost it in some places to “virtually certain” and 99 percent.

Some climate-change deniers have looked at 95 percent and scoffed. After all, most people wouldn’t get on a plane that had only a 95 percent certainty of landing safely, risk experts say.

But in science, 95 percent certainty is often considered the gold standard for certainty.

Yes – most of us would avoid boarding a plane knowing that it has 95% chance of landing safely (or 5% chance crashing on landing). We have an obvious choice of staying home or choosing an airline with a better safety record. This airline will probably be out of business well before we will have to decide whether to fly.

The other side of this issue is that if a fire inspector were to find a 95% chance that our house would catch fire, he would tell us to fix the vulnerability immediately, especially given that no insurance company in the world would be willing to insure us. The only time that we can be 100% certain that the house is going to catch fire is after the house is already aflame. At that time the only thing left to do is to try to get out as fast as possible. Presently we can not get out of this planet – we have no place else to go.


Posted in Climate Change | Tagged , , , , , , , , , , , , , , | 1 Comment

Water as a Commodity

Recently, I have been writing a lot about water- I feel honored that one of the local papers here in Brooklyn, Our Time Press, picked up one of my posts in its entirety to republish. I am trying to get my ideas out into the world, and it is gratifying to know that some people are listening.

In previous blogs (August 27, September 3 and September 10), I have made the case that Earth is not dealing with water shortage, but rather with water stress. Given that 70% of the planet’s surface is covered with deep oceans, and that the global water cycle accounts for the water’s flow through land, sea and the atmosphere, we will not have an actual shortage of water so long as the planet remains a habitable environment. On the other hand, there is a serious water stress that results from the imbalance between supply and demand of fresh water. My September 10 blog focused on one way of trying to alleviate the stress in fresh water: recycling used water, thus forming a smaller, separate fresh water cycle within the global one.

In this and the next blog, I will explore the “classic” economics of dealing with imbalances between supply and demand. This blog focuses on the demand side. Economists tell us that there are two conventional ways to reduce demand of any commodity: either use less or find alternative commodities that will function in a similar way. Unfortunately, water is distinct from other commodities on two levels. First, both physics and biology tell us that liquid water is unique in its ability to support life – no substitutions are possible. Additionally, the adequate availability of fresh water is now being regarded as an element of international human rights law.

Like any other commodity, there is no question that if we raise the price of water we will reduce consumption. The figure below, taken from a study on the effects of water pricing and wealth profiles on water use demonstrates the impact clearly.

Water as a Commodity GraphThe study was carried out by four Florida water management districts. The decline in use shown with the increased price is general. The price-induced changes in water consumption vary according to the property value. Profile 1 represents the properties with the lowest assessed values, while profile 4 shows those with the highest. It is clear from the graph that the properties with the highest assessed values had the correspondingly highest consumption of water while it was offered at a fixed price. However, these properties also reflected the largest price-induced changes. This is likely due to the fact that a significant portion of their consumption was for discretionary uses, which are not difficult to adjust. We must, however, bear in mind that this study was done in Florida –a rich American state in a rich country. It was also confined to single family houses, a distinction that further classifies the residents as belonging to an above average wealth bracket.

The table below tries to account for the global picture. It shows the water tariffs in various cities in the world that represent most global income levels. The United Nation defined water scarcity as water availability below 1000m3 (35,300ft3) of fresh water per year. The table compares the price of this quantity of water to the country’s Gross Domestic Product (GDP) per person. The water tariff data for the various cities is taken from The Pacific Institute and the GDP from the World Bank database.

Country

City

Water Tariff (in US$/m3) (2008)

GDP/Person (in US$) (2008)

Tariff Calculated for 1000m3(US$) of Water

Percentage of the GDP/Person That Goes Toward the Water Tariff for 1000m3

Madagascar

Antananarivo

0.49

471

490

104

Kenya

Nairobi

0.34

786

340

43

India

Kolkata

0.15

1042

150

14

Egypt

Cairo

0.07

2157

70

3

China

Beijing

0.54

3414

540

16

Jordan

Amman

0.49

3797

490

13

Brazil

Rio de Janeiro

0.97

8623

970

11

Mexico

Acapulco

0.50

9508

500

5

Turkey

Istanbul

2.44

10379

2440

23

Venezuela

Caracas

0.21

11223

210

2

Russia

Moscow

0.82

11700

820

7

Japan

Tokyo

1.81

37972

1810

5

New York

USA

2.11

46760

2110

5

San Diego

USA

4.10

46760

4100

9

Copenhagen

Denmark

8.69

62596

8690

14

It is clear from the table that if an average resident of Madagascar (a lovely country that I visited for a few weeks) tries to pay his part of the tariff for this amount of water, he will end up paying more than his average share of the country’s GDP. He cannot do it. The same holds for much of Africa and even India. Meanwhile, an American that lives in New York ends up paying less than 5% of his share of the GDP, since New York doesn’t suffer from a shortage of fresh water, but an American in San Diego, which does suffer such a shortage, ends up paying about twice that. The water tariffs are not based merely on the costs of fresh water –instead, they usually include the costs of water treatments, water storage, transportation, collecting and treating waste water, billing, and in the case of privately run water companies, return on investment. In most cases the tariffs are regulated and should include recovery and maintenance of the water system and environmental criteria such as incentive to conserve. The large disparity between the tariffs is an indication that political considerations and ability to pay are important components of the mix. Since availability of water is essential for both the rich and poor, many of the basic requirements of sustainable systems of water supply and sanitation are either nonexistent or not being met.

A recent example from Venezuela illustrates some of these issues: Andre Soliani, a reporter from Bloomberg News wrote the following on September 4:

The carcass of a dead dog floats on the lake that supplies tap water to 750,000 Venezuelans. Witch doctor Francisco Sanchez has just dumped the previous night’s sacrifice from a cliff, contaminating the resource that has become more scarce than gasoline in Caracas.

The water from Lake Mariposa, polluted by sacrifices and garbage from a local cult,is pumped to a 60-year-old treatment plant that lacks the technology to make it safe for drinking, said Fernando Morales, an environmental chemistry professor at Simon Bolivar University in Caracas who has visited the site.

Eight kilometers (five miles) away from the lake, in Caracas, sales of bottled water are booming, with families paying the equivalent of $4.80 for a five-gallon jug, twice the price of gasoline.

“The treatment process has not adapted to the steady degradation of the water source,” Morales said in an interview at the university campus Aug. 22. “I wouldn’t use this water at home.”

Venezuela is an oil rich country that sits somewhere in the middle of the table in terms of GDP/person. Its water tariff is among the lowest in the table. Lower than Madagascar. Even so, 1000m3 of water amounts to approximately 50,000 five-gallon jugs that will cost $240,000 a year. This is way out of the average Venezuelan’s ability to pay – it is obvious that not every Venezuelan is taking part in the shift towards bottled water. Neglect has consequences.


Posted in Climate Change | Tagged , , , , , , , , , , , , , , , , , , | 3 Comments

Syria and the Meaning of “Self”

Before the Jewish New Year, I got the following message from a friend:

On Rosh Hashanah, it is written… On Yom Kippur, it is sealed. May it be written and may it be sealed that you and all your loved ones have a new year that brings fulfillment and happiness, peace and prosperity. Have a Happy, Healthy New Year, – L’Shana Tova!

It was a lovely message of well wishes. I thanked her and took the message to heart. For Jews, this is a time of the year for reflections. Following tradition, I did a personal accounting of my own doings and undoings, and since I am not religious, the sealing was my own. I have found myself to be far from perfect but I was ok to my family and friends, and for the most part did what I am “supposed” to do (the perspectives of family and friends notwithstanding :(), with the knowledge that any aspirations for  “perfection” are unrealistic. My mind drifted to my role as a member of humanity, and not surprisingly, considering my background, my mind drifted to Syria.

I make my living teaching, writing and doing research on the dangers and challenges of climate change. This blog is one of my outlets. I stirred up a great deal of commotion by using every forum that I had at my disposal to compare climate change with the Holocaust. The comparison was based on defining climate change as a “self inflicted genocide” – a collective suicide.

Here is what I wrote in my May 14, 2012 blog to justify the comparison:

Many thoughtful comments on this blog (thanks!!) have focused on my so-called “dragging” the Holocaust into the climate change debate.  The claims were that I am “cheapening” the Holocaust, that I am not able to distinguish between deniers and skeptics and/or that I am accusing climate change deniers of using “Nazi methods” simply by using the term deniers in the context of climate change. First of all, I could not and would not “cheapen” a genocide that killed most of my family and deprived me of my childhood between the Warsaw Ghetto and Bergen-Belsen.  I was born three months before the start of this genocide in which we were targeted for annihilation because we belonged to a group that the Germans did not think had a right to exist. But, of course, I am using the term “denier” to make a point.  In 1933, very few people believed that Hitler would seriously try to accomplish what he preached and almost no one could imagine the consequences of his deadly reign.  Although there was evidence available – Hitler was clear about what he wanted to do in Mein Kampf – why did people not pay attention?  These “deniers” might as well have been called skeptics in their day.

My definition of climate change as “self inflicted genocide” was anchored on the dictionary definition of genocide as “the deliberate and systematic destruction of racial, political or cultural groups” (See my first post on April 22, 2012). Climate change is not a documented genocide like the Holocaust; it is a projected genocide. Any phenomenon projected for a distant future is uncertain. The call for action to prevent climate change is based on the premise that it can be prevented or at least minimized. Past genocides are unchangeable – history cannot be prevented after the fact.

Now we have Syria.

By almost every account, there is a genocide taking place in Syria. The over two years of conflict have resulted in more than 100,000 dead and countless wounded. More than 2 million of Syria’s 23 million residents have left the country as refugees, while another 4 million were displaced from their homes. A United Nations commission of inquiry presented a report with the following quote:

Bolstered by weapons and money from regional and global powers waging a proxy war, Syria’s government and rebel forces have committed murder, torture, rape and indiscriminate attacks on civilians, without fear of future punishment.

 On August 21st the atrocities breached an important threshold (red line?): poison gas was used in large scale on a suburb of Damascus that was under the control of the government opposition forces. Photographs of the innocent victims that were killed in their sleep circulated throughout the world. In an assertion supported by the Russian government, the Assad regime has claimed that it was the opposition forces that released the gas, as a call for the outside world to intervene. Almost everybody else has blamed the government, arguing that the opposition doesn’t have the means to carry out such an attack.

It is clear who the victims of this genocide are: the Syrian people – but who are the perpetrators?  In the absence of better identification, we have to say that the Syrian people are also playing that role. This is a self inflicted genocide taking place now –one which could be stopped by outside intervention. It is obvious here that the “self” does not include every individual. Most of the people are the victims. It is a cruel civil war. Of course, all wars are cruel, but I have come to believe that most civil wars are better characterized as self inflicted genocides. The distinction between such wars and the possible consequences of climate change by the end of the century is that in most civil wars, there is an outside world. The outside world can intervene and try to stop the collective suicides. In the case of a planetary conflict with our physical environment, there is no outside world.

For two years, nobody has lifted a finger to try to stop the Syrian conflict, and the UN was paralyzed. President Obama has declared the use of poison gas a red line and after it was crossed he called for the use of American power to hit Syria and deter the government from further use of poison gas. While most of the American public and the rest of the world didn’t want to have anything to do with any direct involvement, the threat was enough to lure the Russians to join in an effort to at least eliminate the very real danger that the Syrian government might again make use of chemical weapons. Meanwhile, the brutal civil war continues.

President Obama declared the use of poison gas as a red line because it violates the Chemical Weapons treaty – an international norm that prohibits the use of chemical weapons. However, America’s threats to use force in deterring Syria from further usage also speaks to the violation of an international law – one which allows the use of force between sovereign countries only under explicit authorization by the United Nations Security council or for self defense. Neither condition was satisfied here. Syria is not a signatory to the Chemical Weapons treaty (it has now offered to join under some conditions as a part of the Russian initiative to solve the issue without the use of force). So now we have reached a situation where one brutal violation of international law is being addressed by the threat to violate another international law.

The United States doesn’t have great credibility in ratifying international agreements. The table below lists the status of some of the most important international laws, as of 10 years ago:

Updated July, 2003

Convention on Discrimination against Women (CEDAW) Signed July 17, 1980, never ratified The US remains one of a handful of countries, including Iran and Sudan, not to ratify CEDAW. Although Bush has called the treaty “generally favorable,” the treaty faces resistance from US conservatives.
Convention on the Rights of the Child Signed Feb. 16, 1995, never ratified At the UN, only the United States and Somalia, which has no functional government, have not ratified the Convention. Conservatives who favor the death penalty for minors strongly oppose the treaty.
International Covenant on Economic, Social, and Cultural Rights (CESCR) Signed Oct. 5, 1977, never ratified The US maintains that economic, social and cultural rights are “aspirational,” not inalienable or enforceable. 142 countries have already ratified the Covenant.
UN Framework Convention on Climate Control (UNFCCC) and the Kyoto Protocol Ratified UNFCCC Oct. 15, 1992 Signed Kyoto Protocol Nov. 12, 1998, never ratified Although President Clinton signed the Kyoto Protocol, mandating a reduction in carbon emissions to below 1990 levels by 2012, a 2001 State Department memo rejected the protocol on the basis that it would harm the US economy and exempt developing countries from reduction requirements. Of industrialized states, only the US, Australia and Israel haven’t ratified the protocol. The US did ratify the UNFCCC, but has not complied.
Comprehensive Test Ban Treaty Signed Sep. 24, 1996, never ratified The US Senate voted in 1999 to reject ratification of the test ban treaty. Taking another step away from the agreement, the White House released the Nuclear Posture Review (NPR) in early 2002 hinting at a return to testing and reserving the right to use nuclear weapons in a first-strike attack. The NPR also states that arms reductions can be reversed.
Anti-Ballistic Missile (ABM) Treaty Signed and ratified Summer 1972, US unilateral withdrawal Dec. 13, 2001 The US became the first major power to unilaterally withdraw from a nuclear arms control treaty. Citing “terror threats,” the Bush administration will pursue an enormously costly missile defense program, even though its scientific feasibility remains dubious.
Biological and Toxin Weapons Convention (BWC) and Draft Proposal Signed April 10, 1972, ratified March 23, 1975, rejected Draft Proposal in June, 2001 After the BWC was drafted in 1972, its 144 state parties agreed that the convention’s enforcement mechanisms were inadequate. An “Ad Hoc Group” formed in 1994 to negotiate changes. When the group presented its draft proposal in 2001, the US rejected it and refused to return to negotiations, effectively derailing the treaty.
Chemical Weapons Convention Signed Jan. 13, 1993, ratified Apr. 25, 1997 The US ratified the Convention, but set extensive limitations on how it could be applied in the US, essentially gutting its provisions. The US specifies that material cannot be transferred outside the country for testing, limits which facilities can be tested, and gives the president the right to refuse inspection on the grounds of “national security.”
Mine Ban Treaty Never signed The US remains the only member of NATO besides Turkey, and the only state in the Western Hemisphere besides Cuba, not to sign the Mine Ban Treaty. The US used anti-personnel land mines in the first Gulf War, and claims that land mines are essential to protect US soldiers in heavily armed places like the demilitarized zone between North and South Korea.
Rome Statute of the International Criminal Court (ICC) Signed Dec. 31, 2000, unsigned June 6, 2002 In 2002, the US made the unprecedented move to “unsign” the treaty establishing the ICC. Since then, the US has systematically undermined the ICC by signing bilateral agreements with states to exempt US military and government personnel from the court’s jurisdiction.

I subscribe to the notion that our collective governance on any level requires that we care for each other.  The collective includes everyone –from immediate family, to local community, to sovereign states – all the way up to the entire human race. That is one of our distinctive features as compared to other living organisms – we are “our brother’s keepers” and we have the means to be. We have decently effective enforcing mechanisms for collective governance up to the level of sovereign states. International treaties are agreements between sovereign states, but it is up to the states to abide by them and enforce them.

What Syria demonstrates now, and climate change will demonstrate in the future, is that individual sovereign states are almost powerless to confront issues of global concern such as genocides, whether man-to-man or resulting from man destroying the physical environment that serves all of us.

Global issues cannot be addressed by local authorities. By definition, such authority lacks jurisdiction over some of the terrain. I have argued before against the “citizen of the world” concept (August 6 blog) that would abolish the authority of sovereign states, but the planet is getting too small for all of us and it is high time to start a collective thinking that will effectively govern issues on a planetary scale. The veto-prone UN Security Council is no longer (if it ever was) a sufficiently effective tool. We need to find alternatives and put them into operation as soon as possible.

Posted in Climate Change | Tagged , , , , , , , , , , , , , , , , , , , , , , , , , , | 1 Comment

Water Recycling

As I have discussed previously, the Earth does not lack for water in general; instead, it is the serious shortage of fresh water that inflicts stresses all around the world. This trend is projected to get even worse as a result of both the increasing global population and climate change (see the September 3 blog). Can we do something useful to address these stresses?

Water is crucial for the survival of living organisms on this planet (including us humans). The uniqueness of Earth’s abundance of liquid water coincides with the uniqueness (so far as we know) of our planet’s ability (among the billions of billions of other star systems) to sustain life. There is an ongoing search for other star systems that are suitable for sustaining life (see the January 28 blog on the Physics of Sustainability). The list of potentially habitable planets changes often, and is critically dependent upon our ability to identify conditions on planets outside our own solar system (exoplanets). A partial list can be found on Wikipedia. The existence of liquid water on the surface or close to the surface constitutes the main criteria for possible suitability to sustain life in any form.

Water is essential to life. Life can flourish in the oceans but many living species (including humans) need fresh water for survival. How can we manage the availability of fresh water to satisfy the ever growing needs driven by increasing demand?

The figure below outlines our current global use of fresh water. The data is rather enlightening:

Recycling Water Fig 1

Humankind’s long-term fresh water needs can be satisfied with a combination of three different strategies:

  1. Efficient management of use through pricing.
  2. Recycling.
  3. Desalination of salt water.

I will start here with recycling and elaborate on the two other aspects in future blogs.

In order to assure long-term sustainability (February 4 blog) we must, one way or another, recycle all of the commodities that we extract from Earth. The one commodity that physics limits our ability to recycle is energy. I will elaborate on the reasons for that later on; for now (please) take my word for this. Almost all other commodities can be either recycled/ reused, or can be replaced by alternatives that are more easily recyclable. Water is the exception here – we need fresh water for both direct and indirect use – for everything from the food that we eat to our sanitation needs. Other uses of water, such as for the cooling of power stations, can be modified to be able to use ocean water directly. In my previous blog (September 3) I described in some detail the global water cycle, which details how all water that we use has been (and will perpetually be) recycled water (see the previous blog for the qualifiers to this statement). The real question is: can we then convey this concept to a more human scale for local use?

In this case, the aim is to create a closed cycle to recycle and regenerate fresh water; mirroring the natural global system in a smaller, human-controlled setting. A perfect cycle implies complete conservation of the recycled quantity, in this case – fresh water. Since the two are inextricably linked, as the demand for fresh water increases, so too does the amount of resulting waste water. The waste water, if not treated, will rejoin the water cycle contaminated from its use. This contaminated water will ultimately end up back in the ocean. Throughout history, people have accepted this practice under the assumption that since the oceans are so large, “dilution is an acceptable solution.” This is no longer a sustainable argument – with 7 billion water users and advanced scientific understanding of the chemistry of the ocean, there is a growing understanding that this practice cannot continue. Additionally, while this practice acknowledges the issue of dumping waste water, it doesn’t address the correspondingly increasing need to supplement the depleting fresh water reservoirs.

In developed countries, the technology to treat waste water has not yet reached the stage where families reuse theirs, but in many developing countries, where family plots serve as a main source of food, family waste water is used as source of irrigation. This is especially relevant since, as we saw earlier, irrigation is presently the main consumer of fresh water.

Certain forms of water recycling are being practiced around the world (“The Global Water Recycling Situation” by B. Van der Bruggen in “Sustainable Water for the Future: Water Recycling Versus Desalination;” Isabel Escobar and Andrea Scafer Editors;  Elsevier – 201, p. 41).  This is specifically true in stressed regions with severe fresh water shortages. It was reported that in China (1989 data), the average fraction of fresh water reused in 82 large cities was 56%. The maximum fresh water use in these cities has reached 93%.

Recycled water has been utilized in multiple capacities, including agricultural irrigation, process water in industry and the production – either direct or indirect –of potable (drinking water). Every application requires its own specifications in terms treatment and the technology can be optimized to fit the need.

Each of these uses has received (at least majority) approval –all of them except the application as drinking water (potable water).

The two cartoons below demonstrate the problem with the concept:

Recycling Water Fig 2

Recycling Water Fig 3

http://www.toonpool.com/cartoons/recycling%20water_169706

Human psychology plays an important role in the setbacks to the success of this system. In an article titled “From toilet to tap,” Sadie F. Dingfelder ( American Psychological Association publication) describes the dilemma this way:

The method makes water that is “abundant and safe,” says Brent Haddad, PhD, associate professor of environmental studies at the University of California, Santa Cruz. “The technology is remarkable and can treat water to an often higher quality than the water that originally entered the system.”

However, attempts to reintroduce purified wastewater into the aquifers and rivers from which cities draw their supplies has met vehement opposition from citizens’ groups, stalling water recycling projects in cities from San Diego to Tampa, Fla. According to Haddad, who studies the success of water reuse initiatives, and University of Pennsylvania psychologist Paul Rozin, PhD, who studies disgust and contamination, this opposition comes more from a knee-jerk response to wastewater–the “yuck” factor–than from concerns about the water’s chemical composition.

In people’s minds it’s “once in contact, always in contact,” explains Rozin. “Even if you convince people you did every conceivable thing to [purify] the water they would still be reluctant to drink it.”

The effect is known (in some circles) as the “yuck factor” or the “wisdom of repugnance.”  While psychologists (especially Prof. Rozin from the University of Pennsylvania) are trying their best to find remedies to this mental stumbling block, it is up to all of us to help. We must overcome our squeamishness, even as we take other steps to mitigate and adapt to the root causes of these problems.

Posted in Climate Change | Tagged , , , , , , , , , , , | 15 Comments

Climate Change and the Water Cycle

It seems almost ironic that people must deal with water shortage and water stress, given that 70% of Earth’s surface is comprised of oceans, some of which reach depths of more than six km (close to 4 miles), yet that is one of the biggest concerns the world is now facing.

Global water availability is summarized in the table below:

Water Distribution TableThe oceans hold almost all of Earth’s water. Ocean water is a solution of various salts; most abundantly, what we call common salt. The most common unit used to expresses the salinity of water is Parts Per Thousands (ppt), which measures the number of grams of salts in one kg of solution. For example, the salinity of ocean water ranges between 30 – 50 ppt, while fresh water is defined as having a salinity of less than 0.5 ppt. For drinking and agriculture we need fresh water, yet most of that is stored in the form of ice caps, glaciers and permanent snow. The only parts of these resources available for human consumption are those that melt and feed ground water, lakes and rivers.

Water journeys from sea to land to the atmosphere by way of the water cycle. A schematic representation from the United States Geological Service (USGS), one of the US government agencies  charged with monitoring this flow, is shown below: .

Water Cycle DiagramThe cycle is driven by solar energy, which powers the evaporation of water from the oceans and drives the vapor into the atmosphere against the gravitational field. It also describes the various ways in which water returns to the ocean. In a perfect cycle, there would be no gain or loss of water; the same amount of water that evaporated would eventually return. This cycle is not completely perfect, especially if we measure the water over a short time period. Precipitation in the form of snow which stays in the form of ice caps for thousands of years will show up back in the ocean only when the snow and ice melt. In addition, a “small” amount of ocean water penetrates the relatively thin crust at the bottom of the oceans to interact with the magma. These deviations from a perfect cycle are relatively small, especially if measured over a long time.

The water that evaporates from the ocean is “fresh” water. It reacquires its salt content through its journey back to the ocean. Almost all of the processes in the Water Cycle are driven by evaporation and condensation. Since the oceans make up 70% of Earth’s surface, most of the precipitation falls directly back into them. Only about 10% finds its way to land through the weather system. The water cycle is almost a perfect cycle, but only when viewed globally and over a sufficiently long time. Individual places on earth do not make up their own full cycles. We have had countless droughts and floods throughout history.

Climate change is causing an increase in global temperature. Since the rate of evaporation increases with temperature, the rate of evaporation from the ocean should increase with climate change. However, the rate of evaporation from land and plant transpiration will also increase, requiring even more fresh water to accommodate the loss. The net effect is that while climate change has a pronounced effect on the intensity of the water cycle (as can be measured through the rates of evaporation or global precipitation), it cannot cause global water shortage.

That being said, droughts, floods, extreme storms, sea level rise, salination of ground water, etc… represent indications of the main impacts of climate change. These impacts are being amplified by the simple, mostly regional, overuse of fresh water – caused by both an increasing population and an ongoing increase in the standard of living.

The situation is best summarized by the United Nations poster shown below:

water scarcity posterFresh water is not a luxury good that we can substitute with alternatives. We can manage it more effectively, but management in areas like South Saharan Africa and the Southwestern United States might require different strategies. In future blogs I will try to make the case that the most promising strategies should involve collective management of both global energy and water usage. To be successful in mitigation and adaptation to climate change, the management of both water and energy must become a coordinated effort.

Posted in Climate Change | Tagged , , , , , , , , , , , , | 6 Comments

TV Interview

I am excited to announce that I recently gave an interview with Pleasantville Community Television, where I talked with Martin Wilbur about my book, Climate Change: The Fork at the End of Now, as well as the science and skeptics of climate change. I look at the role that individual countries can play in combating climate change, emphasizing how crucial it is to remember that it is a global issue.

I explain what I mean when I equate climate change with self perpetrated genocide, and why I think that is the correct term.

I also speak of my role in making the short documentary, “Quest for Energy,” about a community of people living in the Sundarbans in India, amidst the mangrove forests, and their struggles for electricity and sustainability.

It is the first time that I have tried to put most of the loose ends of my activities into a common framework. I hope that you watch the interview and let me know what you think!

Posted in Climate Change | Tagged , , , , , , , , , , , , , , , , , , , , , , , | 4 Comments

Water Stress?

As it wages a civil war to determine whose lifestyle will dominate the country, Egypt has become the focus of global concern. Rampant intolerance has led to mass killings. The cause of the conflict, however, contradicts former President Anwar Sadat’s 1979 prediction that, “The only matter that could take Egypt to war again is water.”

His opinion was one shared by another famous Egyptian:

In 1988 then-Egyptian Foreign Minister Boutros Boutros-Ghali, who later became the United Nations’ Secretary-General, predicted that the next war in the Middle East would be fought over the waters of the Nile, not politics. Rather than accept these frightening predictions, we must examine them within the context of the Nile River basin and the relationships forged among the states that share its waters.

They were obviously both wrong in this instance. Water is not the point of contention in the present upheaval in Egypt. However, according to Thomas Friedman from the New York Times, it is the cause of the situation in neighboring Yemen:

I am in the Yemen International Hospital in Taiz, the Yemeni city in the central highlands that is suffering from such an acute water shortage that people get to run their taps for only 36 hours every 30 days or so, they have to fill up as much as they can and they rely on water trucks that come through neighborhoods and sell water like a precious commodity. I am visiting Mohamed Qaid, a 25-year-old laborer from the nearby village of Qaradh who was struck the night before in the hand and chest by three bullets fired by a sniper from Marzouh, the village next door. The two villages have been fighting over the rapidly dwindling water supply from their shared mountain springs. Six people have been killed and many more wounded in clashes since 2000 that have heated up of late. One was killed a night ago. Qaid is in pain, but he wanted to tell people about what is happening here. I have one question: “where you really shot in the fight over water?” He winced out his answer: “it wasn’t about politics. It wasn’t about the Muslim Brotherhood. It was about water.”

It seems almost ironic that people must deal with water shortage and water stress, given that 70% of Earth’s surface is comprised of oceans, some of which reach depths of more than six km (close to 4 miles).

When speaking of global water availability, we must take into account the Water Cycle: through various processes such as evaporation and precipitation, water rotates between oceans, land, various reservoirs, and the atmosphere. This means that water is conserved within the cycle, not “lost” entirely. Water stress doesn’t come from a shortage of water in general, but rather, refers to the shortage of fresh water suitable for direct human consumption and the irrigation of crops needed for food production. To increase our allotment of fresh water and distribute it to where we need it takes energy, and therefore costs money. One of the toughest problems is figuring out who will pay for this, and what kind of energy we can use to do this most efficiently. This is a very complicated issue but is a central component of managing humankind’s sustainability.

Not surprisingly, the impact of climate change on water stress occupied a dominating role at the Mauritius conference attended recently (See the July 2 blog for the program). The range was broad:  it spanned from computer projections of global water scarcities, given a predicted 2.50C temperature rise, to current effects of water scarcity on food supply and agricultural employment in Africa.

Once I came back, I was immediately confronted with the many aspects, both local and global, of the interrelations between energy use, climate change and water scarcity, as well as the need for comprehensive solutions that acknowledge all three. I will try to address this issue in the coming blogs.

Posted in Climate Change | Tagged , , , , , , , , , , , , , , | 1 Comment

One Big Family

My original intention was to use today’s blog to explore water as the central issue in climate change: both with regards to projected impacts, and to adaptation efforts. My focus on water came about largely as a result of the Mauritius conference, where much of the discussion revolved around the impact of climate change on water supply, agricultural productivity and food supply.

As often happens, however, major events have the power to disrupt our best intentions. Even in a blog such as this, I cannot ignore the intense global upheaval that is currently taking place in Egypt, where disparate factions of society are fighting for the power to monopolize Egyptian life. The concept of “live and let live” is sort of disappearing from the lexicon, as hundreds of people are being killed.

The second event that drew my attention had nothing to do with the first, and was, instead, a pleasant event. One of my relatives that lives in Germany, with whom I had lost contact with for more than 40 years, came with his wife to visit us in New York. To make full use of the occasion, I decided to try to update my family tree to incorporate his branch, about which I knew very little. While doing that, something interesting started to emerge. Family trees need constant updating – adding marriages, births, deaths, divorces, etc… More than that, even if we are satisfied with what we have documented, the family tree is never complete. Every marriage adds a potential link to a new tree, and more often than not, that new tree is itself undergoing constant revision. The only “complete” tree set is the global population – all of us.

My desire to construct my family tree stemmed in large part from my Holocaust history, which resulted in the murder of most of my family, with survivors setting down roots in a wide geographic spread that spans the globe. My objective was not to try to trace my ancestry to Adam and Eve but rather, to try to establish the family connections to all of the living members of my family. I was fortunate; both in that the computer technology that facilitates the gathering of such information has developed, and that some members of an older generation are still alive, and able to share some of the crucial links.

It is not unreasonable to assume that the same motivation could potentially expand to include all of humanity. The software is not there yet, but we can identify the requirements. This is not exactly the “Six Degrees of Separation”  concept, but it is closely related. Once accomplished, everyone would know in detail how he or she is connected to everybody else. I am fully aware that access to elementary education is not yet universal, and that most people have more immediate concerns in their lives, but I find the possible consequences fascinating.

If, for one reason or another, we wanted to kill somebody, we would know in great detail that we were killing a relative. This knowledge would obviously not eliminate murder from society.  The Wall Street Journal compiled murder statistics in the US in the decade of 2000 – 2010. The relation between victims and killers are given below.

Murder RelationshipsOne can set the parameters at will of what constitutes family, but a very significant fraction of these individual murders can be characterized as in-family. Additional familiarity with the family connections between victims and killers, therefore, would probably have little to no effect here.

On the other hand, awareness of family connections might have a major effect on mass killings and genocides. In the Rwandan Genocide in 1994 the Hutus depicted the Tutsis as “cockroaches,” and the ensuing massacre was portrayed as a mass disinfection. The revelation that many of the Hutus and Tutsis had family connections might have brought some new light to the situation, since if one group consisted of “cockroaches,” then so did the other. Similarly, in the case of the Nazis’ call to exterminate the Jews and Gypsies, realization of family connections might have made a significant change in the political landscape.

Moving away from the discussion of mass killings to instead address today’s environmental issues, the NIMBY (Not In My Back Yard) phenomenon is a major obstacle that prevents us from taking action to mitigate causes of environmental destruction. I have discussed this throughout my blogs (go to the search box and type NIMBY for the full list). It is defined as a belief that, while certain actions are necessary for the common good, others should have to implement them (elsewhere), so that the group in question would not have to get involved. One of the best examples of this has been the reaction to wind turbines, which generate electricity by utilizing the wind energy (and indirectly, solar energy). The general response has been “build them somewhere else, so that they’re somebody else’s problem.” It is easy to shunt off such a necessary burden onto a group of strangers; less easy when it comes to family and acquaintances. If the distinction between “them” and “us” were to disappear, the NIMBY motivation might go away as well, leaving all of us better equipped to collectively take care of our common assets.

It is a dream that will not come true within my lifetime, but it is a dream worth dreaming.

Posted in Climate Change | Tagged , , , , , , , , , , , , , , , , , | 1 Comment