Guest Blog by Jay Pei: Taoism

We were approaching Shanghai’s City God Temple (Chenghuang Miao), a well-known Taoist temple. Our guide, Jay Pei, started to explain the essence of Taoism. He had done his homework before meeting us and learned of my background on climate change, so he may have weighted his description a bit to emphasize the religion’s attitude toward the physical environment. That aside, his explanation sounded to me very similar to the Gaia hypothesis (also known as the Gaia theory) that proposes:

… organisms interact with their inorganic surroundings on Earth to form a self-regulating, complex system that contributes to maintaining the conditions for life on the planet. Topics of interest include how the biosphere and the evolution of life forms affect the stability of global temperature, ocean salinity, oxygen in the atmosphere and other environmental variables that affect the habitability of Earth.

The difference of course is that Taoism had its origin 2,400 years ago, while the Gaia hypothesis has been around for less than 50 years. I immediately approached Jay and asked him to contribute a guest blog on the topic.

I thought that such a guest blog would serve well both as a conclusion to my recent set of blogs on China and as a prologue to a new series dedicated to Pope Francis’ upcoming visit to the United States. Not only will this blog fit well with other guest blogs that tried to connect Judaism (May 26), Islam (June 16) and Christianity (June 23) with global environmental concerns, but the Pope has recently raised awareness of two immensely important global topics: climate change and the massive outpouring of refugees from certain countries.

This is a bit of a premature ending to the China series; I had wanted to include two more blogs: one would describe the close interaction between Hong Kong and Shenzhen, looking into the role I think Hong Kong will play in China’s future. The other blog would be a survey of where China stands in its energy transition to more sustainable energy sources. As usual, however, global events did not follow my plans, and ultimately the Pope’s visit, the issues that he will raise, and the American public’s reactions take precedence.

I will return to my thoughts on China after the Pope’s visit. Meanwhile, here is Jay:

Guest Blog by Jay Pei: An Introduction to Taoism

Founded during China’s Zhanguo period (457-221 BC, an era known for its warfare and bloodshed), Taoism is now one of the most prevalent religions in China, Taiwan, Japan and Korea.

In Chinese, Tao is 道, and Taoism is 道教, which are pronounced Dao and Daoism respectively. But just as Beijing has often been anglicized as Peking in English, the T in Taoism has often been pronounced the Western way for convenience. The literal meaning of 道 (Tao)is way, path, or road; similarly, Taoism as a religion symbolizes a pathway or solution for dealing with life in the real world.

Unlike Buddhism, Taoism is a multi-god religion; the highest deities are Sanqing (the Three Pure Ones; Qing is pronounced Ching) – a trinity comprised of Yuqing, Shangqing, and Taiqing. Yuqing represents the status of the universe when everything was unborn and unshaped, Shangqing represents the beginning of the universe along with the formation of yin and yang (brightness and shadow), while Taiqing represents the shaping and forming procedure. Aside from Sanqing, Taoism also has a massive branch of other deities and immortals who are differentiated from each other both by duties and symbols.

The totem of Taoism is the Taiji-Bagua. The Taiji (Taichi), is the middle ring, which is a combination of yin (the black half) and yang (the white half), and shows the fusion or balance of shadow and brightness. The eight shapes surrounding the Taiji, are the Bagua – the eight elements of nature. They are: Sky, Earth, Water, Fire, Thunder, Wind, Mountain, and Marsh.

As a religion, Taoism has its own set of complicated doctrines, but the central idea is as follows: Tao guides nature, which in turn rules over everything on Earth. In Taoism, only by learning from nature, following the natural order, and not destroying or damaging Earth, can humans live a life that is harmonious with their surroundings.

Taoism believes everything has two sides which balance each other: yin and yang. For example, happiness can only be experienced because of the existence of sadness, gaining is similarly paired with losing, and failure is a good foundation for success. You may lose something at this moment, but it might bring you awareness of something else, or you may gain something right now, but have to leave something behind in doing so.

Many people who live fast-paced, work-centered lives practice Taoism to remind them that human life is fleeting and shallow. It helps them refocus on getting back to contemplating and comprehending the value of nature.

Taoism emphasizes the spontaneity and simplicity of life, through meditation, healthy diet and other good habits. The religion and its philosophy shows up in so many aspects of Chinese life, including Fengshui (the art of deciding where to place a home or furniture), Taichi and Kongfu – two types of martial arts that share a common root but differ in both speed and function.

Taoism also has a strong influence on broader Chinese culture, especially in that it values staying calm, not putting too much focus on personal emotion, and considering arguments from different perspectives.

I think that these are good principles for everyone to keep in mind, regardless of religion, especially when it comes to our treatment of the world around us.

Jay Pei has been a tour guide at A&K luxury travel in Shanghai for 5 years. He holds a Bachelor’s degree in Literature. He is a student of religious culture and incorporates ideals from both Buddhism and Taoism into his life.

Posted in Climate Change | Tagged , , , , , , , , , , , , , , , , , , , , , , , , , , , , , , , , , | 1 Comment

Mongolia’s Nomads

Last week I described sailing along a segment of the Yangtze River and my visit to the Three Gorges Dam – a project that displaced 1.3 million people. The Chinese government provided them with alternative housing, and in many cases, new jobs. These so-called environmental migrants that I spoke to had mixed feelings about the project and its consequences:

They are people who were forced to leave their traditional habitat, temporarily or permanently, because of lack of natural resources and/or environmental disruption that had jeopardized their existence and seriously affected the quality of their life. Thus, home-region was not able to ensure them safe livelihood.

The phenomenon of environmental migration is not unique to the Three Gorges Dam or even to China as a whole. We went to Mongolia and spent most of our time there in the Gobi Desert. The Gobi occupies the southern part of Mongolia and the northern part of Inner Mongolia (an autonomous region of China). The map of the two Mongolias is shown in Figure 1.

Mongolia Map UNPOFigure 1 – Mongolia and Inner Mongolia (China)

The two Mongolias split in 1911 after they gained independence from the Manchu Qing dynasty in 1911. The history of the Mongols is long and rich, and I will not attempt to cover it here. Mongolia has a population of around 3 million people with a GDP/Capita of around $11,000. Of the population, about 95% is Mongolian and roughly 30% are nomads or semi-nomads that herd ship and goats. The country runs under a parliamentary constitutional government.

While we were in the Gobi Desert, we stopped in the village of Dal.

Herding in the Gobi (Dal-Mongolia)

Figure 2 – Herding in Dal (Gobi Desert, Mongolia)

Nomadic life (Dal-Mongolia)

Figure 3 – Wind, solar, and satellite reception in Dal

When we got there, the herd was just returning home. What we saw did not match the classical picture of herding Nomads that I had in my head. Indeed, after coming back to the US I found a short article in “The Diplomat” by Hannah Reyes that summarized the transition:

Mongolia’s vast steppe is home to one of the world’s last surviving nomadic cultures.

Some herding customs alive today pre-date the era of Genghis Khan

Slowly, however, the steppe’s landscape is changing, as more and more of its nomadic population move to urban areas in search of education, employment, and modern conveniences. Indeed, modernity attracts not only those Mongolians who have moved to the city, but also those who have chosen to continue with their nomadic lifestyle.

Today the nomads who remain on the steppe combine old traditions with new means. They continue their lifestyle as pastoral herders, but many use motorbikes to herd cattle and horses. To move their homes, trucks have taken the place of ox carts. With the growing use of motorbikes and trucks, gas stations now begin to dot the landscape. Solar panels are becoming an addition to the traditional Mongolian home, the ger. The panels are a way for them to gain access to electricity without being confined to one place. The nomads use solar energy to power television sets, and to maintain the use of mobile phones, which, for parents, are the only way to stay in touch with their children attending boarding schools in the city. Mongolian children, whether from urban or rural backgrounds, conventionally study in the city. During the summer, children with rural family backgrounds return to the steppe to help their families maintain the herds, and some come back to live in the steppe after finishing their education.

With the rise of accessible technology, changes in lifestyle are almost inevitable. But these changes also help longstanding traditions thrive. Rather than abandoning their lives on the steppes, Mongolia’s nomads are adapting to modernization in their own way. This culture in transition reaps the conveniences of modern society, while keeping an ancient and fascinating lifestyle alive.

Shortly after, a New York Times article summarized the situation on the other side of the border:

In Xilinhot, a coal-rich swath of Inner Mongolia, resettled nomads, many illiterate, say they were deceived into signing contracts they barely understood. Among them is Tsokhochir, 63, whose wife and three daughters were among the first 100 families to move into Xin Kang village, a collection of forlorn brick houses in the shadow of two power plants and a belching steel factory that blankets them in soot.

In 2003, he says, officials forced him to sell his 20 horses and 300 sheep, and they provided him with loans to buy two milk cows imported from Australia. The family’s herd has since grown to 13, but Tsokhochir says falling milk prices and costly store-bought feed means they barely break even.

An ethnic Mongolian with a deeply tanned face, Tsokhochir turns emotional as he recites grievances while his wife looks away. Ill-suited for the Mongolian steppe’s punishing winters, the cows frequently catch pneumonia and their teats freeze. Frequent dust storms leave their mouths filled with grit. The government’s promised feed subsidies never came.

Barred from grazing lands and lacking skills for employment in the steel mill, many Xin Kang youths have left to find work elsewhere in China. “This is not a place fit for human beings,” Tsokhochir said.

Not everyone is dissatisfied. Bater, 34, a sheep merchant raised on the grasslands, lives in one of the new high-rises that line downtown Xilinhot’s broad avenues. Every month or so he drives 380 miles to see customers in Beijing, on smooth highways that have replaced pitted roads. “It used to take a day to travel between my hometown and Xilinhot, and you might get stuck in a ditch,” he said. “Now it takes 40 minutes.” Talkative, college-educated and fluent in Mandarin, Bater criticized neighbors who he said want government subsidies but refuse to embrace the new economy, much of it centered on open-pit coal mines.

He expressed little nostalgia for the Mongolian nomad’s life — foraging in droughts, sleeping in yurts and cooking on fires of dried dung. “Who needs horses now when there are cars?” he said, driving through the bustle of downtown Xilinhot. “Does America still have cowboys?”

Experts say the relocation efforts often have another goal, largely absent from official policy pronouncements: greater Communist Party control over people who have long roamed on the margins of Chinese society.

Nicholas Bequelin, the director of the East Asia division of Amnesty International, said the struggle between farmers and pastoralists is not new, but that the Chinese government had taken it to a new level. “These relocation campaigns are almost Stalinist in their range and ambition, without any regard for what the people in these communities want,” he said. “In a matter of years, the government is wiping out entire indigenous cultures.”

I will finish this piece with a short description of Inner Mongolia: As we can see in the map above, Inner Mongolia is smaller than the republic of Mongolia, yet its population is around 25 million, and the average GDP/Capita is about the same as that in the Republic of Mongolia. Before doing my homework, I was a bit surprised by these numbers, but it shortly become evident that most of the population of Inner Mongolia is Han Chinese. The number of Mongolians in the area only amounts to about 4 million – a figure not too different from the Republic of Mongolia. During the 19 century, the Manchus that ruled Mongolia strongly encouraged the immigration of the Chinese Han to Inner Mongolia, primarily as a defense against the Russians. Inner Mongolia is now considered an autonomous region of the People’s Republic of China, but such regions actually have relatively limited autonomy. While the Chairman has to be a minority (mostly Mongolian in this case) he (or she) is then kept in check by the regional Communist Party Secretary (usually from a different part of China).

Next week I will temporarily conclude my series of blogs on China to start on another series dedicated to the Pope’s visit to the United States and the global issue of immigrants.

Posted in Climate Change | Tagged , , , , , , , , , , , , , , , , , , , , , , , , , , , , , , , | 1 Comment

China – Water, Energy and the Yangtze

It seems right now that when China sneezes the world is shaken. Not only does that apply to the obvious recent economic upset, but it also means that in tackling any global issue we need the country’s involvement. Climate change, of course, is no exception – China is a major player when it comes to sheer population, energy usage and emissions.

Water and energy are essential to the sustainable growth of every country. With 1.4 billion people and a recent economic growth rate of 7-10% per year, this is especially true for China. The sustainability of the Yangtze River is central to China’s growth plans. Wikipedia says the following of the Yangtze:

The Yangtze River (English pronunciation: /ˈjæŋtsi/ or /ˈjɑːŋtsi/), (Chinese: 长江, Cháng Jiāng), known in China as the Chang Jiang or the Yangzi, is the longest river in Asia and the third-longest in the world. It flows for 6,300 kilometers (3,915 mi) from the glaciers on the Qinghai-Tibet Plateau in Qinghai eastward across southwest, central and eastern China before emptying into the East China Sea at Shanghai. The river is the longest in the world to flow entirely within one country. It drains one-fifth of the land area of the People’s Republic of China (PRC) and its river basin is home to one-third of the country’s population.[6] The Yangtze is also one of the biggest rivers by discharge volume in the world.

The Yangtze’s role in the drive to a sustainable China is a big issue that I will return to in future blogs. Meanwhile, I’ll share some of the pictures from my visit to better acquaint you with some of the areas we are discussing.

yangtze438x295
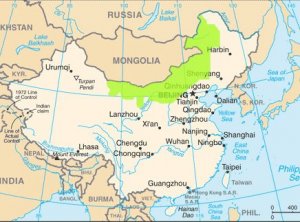
Figure 1 – Map of the Yangtze River

I took the popular tourist route and sailed on the Yangtze from Changqing to Yichang. The part that I found the most fascinating was the Three Gorges Dam near Yichang. The dam is essential to China’s efforts to ensure sustainable water and energy management. Not only is it the largest power station in terms of installed capacity (22.5 GW (Gigawatts)), it is the largest operating hydroelectric facility in terms of annual energy generation (84 TWh in 2013 and 99 TWh in 2014 (1TWh = one billion kWh). The dam was completed and became functional in July 2012. Contrary to wide perception, the primary reason for constructing the dam was not to provide sustainable hydroelectric power to China, although we will discuss that effect in more detail in future blogs about China’s transition to different energy sources. Instead, the dam’s main stated objective was to increase the Yangtze’s shipping capacity and reduce the damage of floods by providing a buffer area for overflow. The stretch of the river in which we were sailing from Chongqing became that flood storage space.

P1100649   
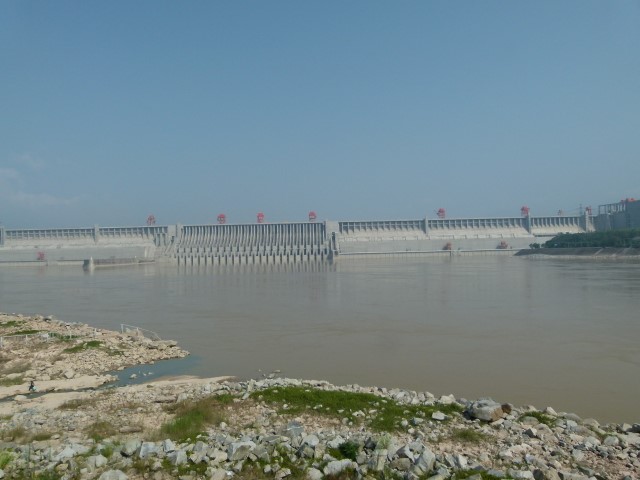
Figure 2 – The Three Gorges Dam

The dam displaced around 1.3 million people, flooded renowned archeological and cultural sites and is causing significant ecological changes – in other words, it was no free lunch.

The Chinese government has made serious efforts to compensate the people that were directly affected by the project by providing them with alternative housing and job opportunities. I visited the nearby village of Fengdu and met some of the people who had been displaced (a few of them served as our guides). Figure 3 shows some of the housing that the displaced people now occupy. There is no question in my mind that my visit was heavily framed by government propaganda, but I also have no doubt that a serious effort was made to assuage the social outcry that came with the displacement.

P1100363

Figure 3 – Housing in the village of Fengdu, constructed to accommodate the evacuees from flooding the dam

P1100439

Figure 4 – Sailing through the Three Gorges

P1100518

Figure 5 – Coal extracted and shipped on the river

The Yangtze originates in the Tibetan Plateau in the Himalayan Mountains (see Figure 1). It’s also not far from the origin of China’s next largest river, the Yellow River, which flows to the north of China:

The Yellow River is called “the cradle of Chinese civilization”, because its basin was the birthplace of ancient Chinese civilization, and it was the most prosperous region in early Chinese history. However, frequent devastating floods and course changes produced by the continual elevation of the river bed (due in part to manmade erosion upstream), sometimes above the level of its surrounding farm fields, has also earned it the unenviable names China’s Sorrow and Scourge of the Sons of Han.[2

The Chinese government is now seriously planning a solution to the water shortage in the north of China by moving water up from the Yangtze River. This is similar to the massive water projects that tried to solve California’s water problems by moving water from the north to the south of the state.

Of course, the feasibility of this idea depends largely upon the sustainability of the water flow in the Yangtze, which in turn relies heavily on the precipitation in the mountains that surround the source.

We also visited Lhasa, the capital of Tibet, in the beginning of July. The city’s altitude is about 11,500 feet, and it is surrounded by higher mountains that at the time were completely devoid of snow. Figure 6 shows one of these mountains immediately after a few hours of light rain in the city. They became almost immediately covered with snow. Unfortunately, the ratio between rain and snow in the city and surrounding areas is now constantly changing in favor of rain, and that change will have a big effect on the future of the river.

P1100281

Figure 6 – Snow around Lhasa in July

Figure 7 is a photograph of the Himalayas taken from our plane. The glaciers are receding, and like mountain tops all over the world, the snow is slowly disappearing. Most projections predict that they will be snow-free by the end of the century. This transition will upset the water cycle and affect most of the world’s big rivers, including the Yangtze.

P1100308

Figure 7 – The Himalayas

Posted in Climate Change | Tagged , , , , , , , , , , , , , , , , , , , , , , , , , , , , , , , , | Leave a comment

China – Air Quality

My last two blogs described some of China’s largest cities’ attempts to limit their number of cars. A lot of this had to do with reducing the terrible air pollution in these cities. Pollution is one of the key reasons why many of those who can afford to leave China settle in other countries. Air pollution is also a huge obstacle for Beijing when it comes to not only hosting international events, but attracting foreign visitors to spend their money in China. All of these are important reasons for the Chinese government to take action, but perhaps the most important reason to address this issue is the damage that the polluted air is causing the residents of Chinese cities. A recent analysis by western researchers ends with the following paragraph:

During our analysis period, 92% of the population of China experienced >120 hours of unhealthy air (US EPA standard), and 38% experienced average concentrations that were unhealthy. China’s population-weighted exposure to PM2.5 was 52 μg/m3. The observed air pollution is calculated to contribute to 1.6 million deaths/year in China (0.7 – 2.2 million death/year at 95% confidence), roughly 17% of all deaths in China.

Of course, the most visible manifestation of the air pollution in China is the haze in the air that one encounters when visiting any of the major cities.

The photograph below (Figure 1) shows the haze I saw in Shanghai during my recent visit.

Hazy air from from the 100th floor of the Shanghai World Financial center

Figure 1 – Haze in Shanghai – photograph taken from the 100th floor of the World Financial Center.

The haze is usually a reliable way to convey air pollution. In China, it is often paired with photographs of people walking the streets with surgical masks on their face.

The photograph below shows a street photograph in Lhasa, Tibet.

Lhasa, Tibet

Figure 2 – Street photograph in Lhasa, Tibet.

Lhasa is the smallest city that we visited; its industrial base is tiny. In fact, the city’s car statistics didn’t even show up on any of the charts that I presented over the last two weeks. The air there is not hazy; nor is it particularly polluted by any other measure, yet the number of people wearing masks was the largest that we saw in China. In fact, many of the visitors to the monasteries that we visited in Tibet were wearing masks as well. The air in these monasteries is not polluted either. Instead, it became evident that the masks often serve more as cultural markers than indicators of air pollution.

Such use of masks is popular in parts of China, Korea and Japan. In these countries it is common for people to wear the masks if they think that they are getting sick and might infect others. In that case, people are wearing the masks to try to protect others, not themselves. However, anybody that is watching the consequences of the two recent explosions in Tianjin will notice the prevalence of masks in that area as well. The chemistry of the hazardous materials that caused the explosion has yet to be revealed. Whatever the initial combination, the air there is now loaded with cyanide, a powerful toxin, so the masks that people wear in the area are to protect themselves, not others. As we will see shortly, the Chinese environmental warnings include entries about recommendations to wear masks.

The best quantitative indicator for air pollution is the Air Quality Index (AQI). Here is how the index is defined:

An air quality index (AQI) is a number used by government agencies [1] to communicate to the public how polluted the air currently is or how polluted it is forecast to become.[2][3] As the AQI increases, an increasingly large percentage of the population is likely to experience increasingly severe adverse health effects. Different countries have their own air quality indices, corresponding to different national air quality standards

As is evident from this definition, the index depends on national standards, meaning that comparisons between countries are not always appropriate. Yet the index is almost always accompanied by the corresponding scale for its impact on health. Here is a “typical” map of an hourly AQI that the US Environmental Protection Agency (EPA) published few days ago for the region of the US where I live.

US EPA AQI of Region 1 from August 18, 2015Figure 3 – EPA published AQI for August 18, 2015 in region 1 (USG stands for unhealthy for Sensitive Groups).

Even in the US, we get warnings from our weather sites almost on a daily basis that advise us to stay indoors whenever possible because the AQI exceeds 100. Well, in our recent trip to China, the AQI in almost all the big cities that we visited exceeded 150. Figure 4 shows the data for Beijing and a few other cities.

Beijing AQI vs other citiesFigure 4 – Beijing air pollution report

The website even gives you more information about which masks are most efficient and where to buy them.

The amazing part of Figure 4 has less to do with Beijing’s AQI number and label of “very unhealthy”; far more impressive is the fact that it is being published in the first place, especially with so much accurate detail. In my second blog about China (August 4), I discussed how the Chinese government has tried to censor any information that might be interpreted as critical of China. Since a number of foreigners live in China and breathe the same air, the American Embassy in Beijing decided to take independent measurements and publish them. Figure 5 shows the results. Aside from an understandable small shift in timing, the results are identical. It is difficult to come up with better confirmations.

Beijing AQI China EPA vs US embassy
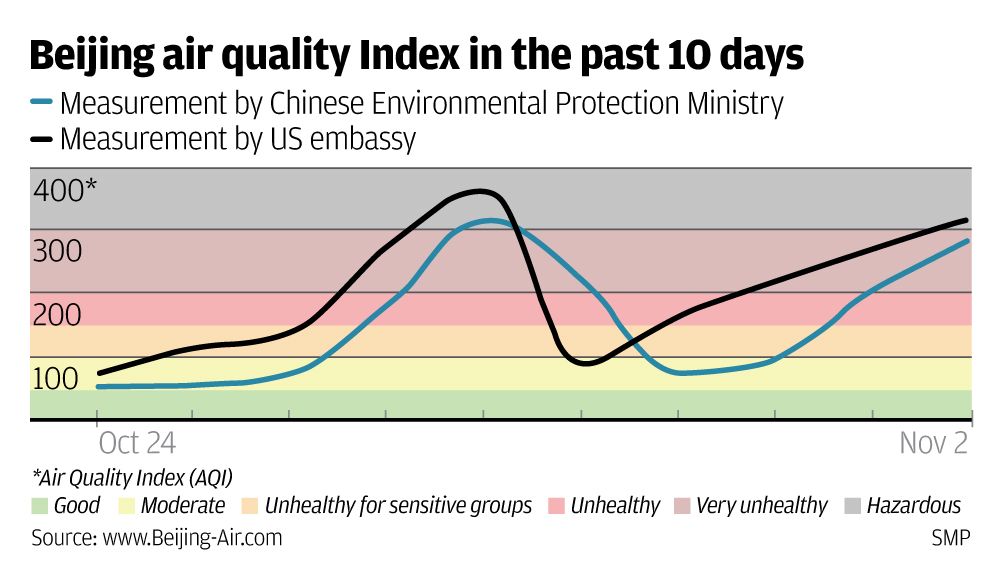
Figure 5 – Comparison of Beijing air quality by the Chinese Environmental Protection Agency and the US embassy.

The common availability of real information about the polluted air is, perhaps, the strongest indication that the government of China recognizes the seriousness of the threat and is trying to devise ways to mitigate it.

It’s no secret where all of this air pollution came from: a combination of heavy fossil fuel consumption (mainly for the copious amount of cars), and the use of coal to generate electricity. Economic development took priority over health considerations. My last two blogs detailed what a few cities, including Beijing, are now doing to limit the number of cars. I plan to spend more time discussing the country’s use of coal and its eventual energy transition in future blogs.

Posted in Climate Change | Tagged , , , , , , , , , , , , , , , , , , , , , , , | 2 Comments

Cars in China – Cap and Pay

Last week’s blog ended with the following promise: “… a few of the largest cities in China are now taking drastic steps to limit car ownership – a fact that I was completely unaware of until my visit.” Time to unveil the mystery and go to some detail. Cities such as Shanghai, Beijing, Guangzhou and now Shenzhen have decided to limit car ownership – not through any direct regulation or by imposing a tax on car ownership, but instead by making the license plates very expensive. I was told about the practice by our Chinese guide when we visited the first two cities and I was shocked. I was told that the licensing fee can cost as much as the car itself (it also applies to motorcycles). I had never heard about the practice, but immediately recognized its benefits to limiting the number of automobiles in a city. Also, as long as you don’t differentiate between imported and domestically manufactured cars you are not running up against any international trade agreements. The data for the first three cities is given in the three figures below:

Car ownership in Beijing Shanghai and GuangzhouFigure 1 – The number of registered automobiles (in 10,000’s) of Beijing, Shanghai and Guangzhou

Shanghai license plate quota average price and biddersFigure 2 – The quota, average price and bidders for Shanghai licence plates (2002/01-2013/06)

Beijing license plate quota and lottery success rateFigure 3 The quota and lottery success rate in Beijing (2011/01-2013/07)

Figure 1 shows the rise in car ownership per resident in the three cities. It shows an uninterrupted growth from the time of my first visit (1992). The attempt to restrict car ownership through limiting the numbers of new license plates started at the tail end of this graph, between 2008 and 2011. Many cities in the developed world use policies including construction of more efficient public transportation to curb the use of cars. Once the Chinese realized that such measures were not sufficient for their purposes, some of its cities started to implement more austere restrictions. For various reasons, including the country’s accelerated urbanization and the perceived status enhancement associated with the purchase of a car, people have kept buying them as they acquire the financial means to do so.

Unsurprisingly, the attempts to limit car ownership through license plate restrictions started in Shanghai and Beijing – China’s two largest cities (details are taken from the Feng and Li article that I cited previously). Shanghai was the first city to implement a policy to control car ownership through an auction process. The policy started in 1986 but only reached full force by early 2000.

The auction opens to the public once a month. In recent years the quota has fluctuated between 8,000 and 9,000 license plates per month. The number of quotas/bidders together with the average price in the Shanghai bidding is shown in Figure 2. While the auction mechanism clearly limits the number of license plates, it also inherently restricts car ownership to rich owners.

During the 2008 Olympic Games in Beijing, driving restrictions were put into place in Beijing based on license plate numbers: the right to drive on any given day alternated according to odd or even numbers on the plates. After the Olympics the policy was modified to require that every car (again, based on its license plate number) be off the road at least one day a week. In the beginning of 2011 Beijing decided to expand the restrictions and follow Shanghai in implementing a quota, but tried a different tactic – namely, distributing the quota by lottery. Figure 3 shows the quota success rate in Beijing – it documents a steady rise in applications coupled with a steady decline in the success rate.

Two clear trends are visible through these descriptions: the decision process over how best to limit car ownership is local, and as result the various cities’ methods serve as experimental examples of the most effective (and fair?) mechanisms to limit car ownership in cities. Unfortunately, another impact of this highly localized approach is that it leaves itself open to work-arounds and fraud.

Some of these schemes are described in the Feng and Li article, while others are described elsewhere. Here are some of the techniques, as well as attempts that are being taken to mediate their impact.

  1. Since the license plate restriction policy only applies in a few cities, people register in another city and drive from there to their final destination/residence. In response, Shanghai (and presumably the other three cities as well) have started to restrict the driving of cars (mainly during peak hours) with non-local registration plates.
  2. It is not surprising that since license plates are becoming expensive and scarce a very active secondary market is developing in these cities. To try to cut down on the quick turnaround, Shanghai, for example, requires that license plate owners keep them for three years before selling them.
  3. One reported scam that tries to work around the restrictions is a collusion between the owner and buyer of secondary cars. The two parties construct an imaginary debt that the seller “owes” the buyer for which the car is used as “collateral.” The seller “defaults” on the loan. They both go to court and the “debtor,” who is actually the car owner, is ordered to hand over the car to the “lender,” the car’s buyer. Along with this transfer of ownership comes the already registered license plate.
  4. Another option is to obtain temporary plates by leasing them from a car rental companies. Rental agencies can charge sums equivalent to $500/month for the rent.

Revenues from the taxes are used to improve mass transit and transportation infrastructure.

In principle, if not in detail, China’s new techniques resemble the more widely known structure of cap-and-trade with regards to pollution rights. The key in both techniques is to set a fixed number of cars that that can be driven or total acceptable emissions.

China’s cities have a lot of reasons to want to avoid exceeding the “saturation range” that I discussed in last week’s blog. These include their inability to manage heavier traffic and increasing demands on parking, as well as their desire to minimize China’s contributions to greenhouse gas emissions overall. Meanwhile, from China’s perspective, one of the most urgent driving forces is the need to minimize its infamously bad air pollution. I will discuss this topic in next week’s blog.

Posted in Climate Change | Tagged , , , , , , , , , , , , , , , , , , , , , , , , , , , , , , , , , , , , , | 15 Comments

China – How Many Cars Can a City Handle?

Right now, China has the largest global market for new cars. According to the last count by the International Organization of Motor Vehicles Manufacturers, there are 833 million light vehicles currently (2015) in use worldwide. About 10% of these cars (around 83 million) were bought in 2014. Out of that 83 million, 21 million went to China, while the US, the second largest buyer, bought close to 16 million. In other words, China – which still counts as a developing country (see July 28th blog) – bought about one quarter of all cars sold throughout the world. These numbers put China’s share of automobiles roughly in line with its current share of the global GDP, which is approximately 13%.

I visited several Chinese cities and was astounded at how much the traffic flow differs from that in New York City, where I live. The traffic is heavy but in most instances it flows smoothly; the roads are great and the traffic control systems work better than I have ever seen elsewhere.

Shanghai traffic

Shanghai (these photos are from my trip)

Traffic in Xian

Xian

I visited both of these two cities as well as Beijing 20 years ago – at which time the dominant traffic on the roads was made up of bicycles – so this dramatic change has taken place within the span of less than a generation. What changes will develop within the next generation?

In a report by China SignPost, a western consulting firm, we find a bit more detail. The two figures below show a summary of private car ownership in 36 Chinese cities in comparison to some major cities in developed countries outside of China. My home city, NYC, is on the list. As we will see in a future blog, the definition of “selected metro areas” especially in China, is open to discussion (e.g. where exactly the borders are). I checked the original reference for NYC, which only counts those residents within the five boroughs – a population of 8.4 million people. Beijing’s population is 11.5 million on the same basis (excluding suburbs, etc.). The figure also shows Houston, TX, with its population of 2.2 million for comparison. NYC has one of the lowest car ownership ratios per person in the US – largely due to the extent of the public transportation system. Figure 2, from the same source, provides the per-capita numbers for car ownership. Again, when calculating that 22% of NYC residents own cars, refer to the city itself, not to the entire metropolitan area. This stands against 21% car ownership in Beijing, 18% in Xian, and 11% in Shanghai. The figure also adds a horizontal band that stretches between 25-30% cars per person and indicates a “saturation point,” at which car ownership plateaus. The assumed plateauing seems to be independent of quality of the road, traffic management or availability of affordable alternative transportation modes. The main issue that I want to address in these next few blogs is the steps China is taking to actively keep the number of cars in its cities from growing further.

Figure 1 – Private passenger car ownership by selected metro area in China and abroad (in thousands of vehicles)

The numbers that I got on the ground, from speaking with the locals in some of these cities we visited, were considerably higher than demonstrated above. Meanwhile, the compilation of 36 cities in Figure 1 only represents about 30% of China’s total car ownership, which includes a fleet of 93 million private passenger cars.

Car Ownership per 100 Residents, By Metropolitan AreaFigure 2 – Car ownership per 100 residents, by metropolitan area.

City after city is now starting to conclude that enough is enough. My Chinese friends have long predicted that the growth rate, at least in terms of private cars in their cities, cannot continue at its present pace. Many of China’s major cities are taking similar steps to those being taken by developed countries – e.g. building the best public transportation systems that they can. I “tested” the underground system in Shanghai and found it competitive with the best systems that I have seen elsewhere.

Hong Kong is now part of China, but I will cover it separately in future blogs. It is one of the richest cities in the world, and was only recently re-incorporated into China as a result of an agreement with the British government. The latest accounting of the city’s transportation issues shows that Hong Kong has 500,000 private cars for a population of about 7.5 million people. This comes out to 6.6% of the population, which would fall within the far left side of Figure 2. Meanwhile, however, a few of the largest cities in China are now taking drastic steps to limit car ownership – a fact that I was completely unaware of until my visit. The details of what these cities are doing are important to all of us; I will explore some of these steps next week.

Posted in Climate Change | Tagged , , , , , , , , , , , , , , , , , , , , , , , , , | 1 Comment

China – The Price of Progress: Inequality and Transparency

While I was in China (see last week’s blog), one of the questions that I asked most often – especially of those who mentioned that they have small children – was how people imagine China 20 years from now. This question stemmed, in large part, from the immense changes that I saw since my first visit in 1992. Invariably, people answered they expect economic progress to continue at roughly the same pace as it has over the last 20 years. This prognosis is worth examining further because it has strong implications about the future of the world and it is thus relevant to all of us.

Last week I looked at China’s progress from 1992 to 2012 using data from The World Bank database (more recent data were not available). The World Bank also has country reports. Here is a paragraph from its recent entry about China:

Since initiating market reforms in 1978, China has shifted from a centrally planned to a market based economy and experienced rapid economic and social development. GDP growth averaging about 10 percent a year has lifted more than 500 million people out of poverty. All Millennium Development Goals have been reached or are within reach.

With a population of 1.3 billion, China recently became the second largest economy and is increasingly playing an important and influential role in the global economy.

Yet China remains a developing country (its per capita income is still a fraction of that in advanced countries) and its market reforms are incomplete. Official data shows that about 98.99 million people still lived below the national poverty line of RMB 2,300 per year at the end of 2012. With the second largest number of poor in the world after India, poverty reduction remains a fundamental challenge.

Rapid economic ascendance has brought on many challenges as well, including high inequality; rapid urbanization; challenges to environmental sustainability; and external imbalances. China also faces demographic pressures related to an aging population and the internal migration of labor.

It is worth mentioning here that RMB 2,300 is approximately equivalent (in today’s exchange) to $1US/day. China has two especially large challenges to rapid economic growth: the increase in income inequality and the environmental impact, but I will save the latter for another time.

Before starting on increased income inequality, I have to put my writing into perspective. I am obviously a very biased observer: an American tourist with enough resources to see the world from the balcony of five star hotels for the duration of my month-long visit, almost all of which was focused within Chinese megacities (cities with populations that exceed ten million people). This is not the view that one acquires from the residences of inhabitants who live off of $1US/day. To get some semblance of reality and balance, I will rely strongly on literature published by somewhat more objective observers.

Over the years, I have spoken frequently in this blog about the role of income inequality in the global response to climate change (see January 7, August 19, and September 9, 2014). There are various ways of measuring inequality; one of the most common is the use of the Gini coefficient:

The Gini coefficient (also known as the Gini index or Gini ratio) (/dʒini/ jee-nee) is a measure of statistical dispersion intended to represent the income distribution of a nation’s residents, and is the most commonly used measure of inequality. It was developed by the Italian statistician and sociologist Corrado Gini and published in his 1912 paper “Variability and Mutability” (Italian: Variabilità e mutabilità).[1][2]

The Gini coefficient measures the inequality among values of a frequency distribution (for example, levels of income). A Gini coefficient of zero expresses perfect equality, where all values are the same (for example, where everyone has the same income). A Gini coefficient of one (or 100%) expresses maximal inequality among values (for example, where only one person has all the income or consumption, and all others have none).[3][4] However, a value greater than one may occur if some persons represent negative contribution to the total (for example, having negative income or wealth). For larger groups, values close to or above 1 are very unlikely in practice.

Yu Xie and Xiang Zhou recently published a paper called, “Income Inequality in Today’s China,” in the Proceedings of the National Academy of Science (PNAS). PNAS is one of the most prestigious and selective scientific publications in the United States. It accepts papers for publication only through recommendations of members of the US National Academy and requires scrupulous reviewing before publication. Here is a segment from the paper’s introduction:

In this paper, we wish to address two research questions. How high is income inequality in today’s China and why is it so high? The first question appears to be simple fact that could be answered by government statistics. Unfortunately, this is not true for China. For a variety of complicated reasons, ranging from politics to practical difficulties, government statistics on Chinese well-being have been questioned for their accuracy. This concern is exacerbated by the long-standing concealment practices of China’s National Bureau of Statistics (NBS), responsible for constructing and releasing government data on China, such that no original microlevel data are accessible to any independent researcher that could be used to corroborate the macro level statistics it releases. In the case of income inequality, the NBS stopped releasing the Gini coefficient after it reached 0.41 in 2000. It was not until an economist claimed that the Gini coefficient had reached the shockingly high level of 0.61 that the NBS, in early 0.61, released the Gini coefficients for recent years, which were slightly under 0.5.

The paper itself cites multiple supporting references, emphasizing the need to use multiple data sources to get the necessary information and not to rely on an “obvious” source – in this case, China’s National Bureau of Statistics (NBS) – as the sole source. Please note that the World Bank data that I quoted last week originated in China’s governmental sources, so the skepticism that the PNAS paper expresses should fully extend to last week’s post.

We found the challenges China faces in its efforts to release only selected information to public consumption directly visible in our experiences during our short visit. Connectivity to applications such as Google, Facebook, ESPN, Bloomberg and The New York Times were all but nonexistent throughout mainland China, but one could circumvent most of the search restrictions by searching with Yahoo, Bing and Baidu and the news restrictions by going through the Huffington Post and other outlets. Once we crossed into Mongolia or Hong-Kong, suddenly all the applications were available as clearly as at home. The logic of all of this will probably never make sense to me, but I strongly suspect that with time, the government will become a bit more familiar with modern communication capabilities and many of these attempts of at needless and futile censorship will disappear.

The two most important findings in the PNAS paper are shown in the two figures below:

Gini coefficient trends - family income China & US

GDP per capita and Gini coefficients - family income in China vs 136 countriesAmong the conclusions we can draw from the two figures are:

  1. The sharp increase in inequality (rising Gini coefficient) started shortly after China’s 1978 shift to a market based economy.
  2. Around 2000, China’s Gini coefficient surpassed that of the United States, even as the GDP/Capita stayed well below that of most developed countries (see last week’s blog for more data, but keep in mind the disclaimer about the World Bank’s sources).

The second graph tries to demonstrate that the increase in GDP is not solely to blame for the rising Gini coefficient. It plots the Gini coefficients of 136 countries against their GDPs/Capita (in logarithmic scale – see August 6, 2012 blog). The data roughly fit (with a great deal of noise) the Kuznets curve, a hypothesis that states that after a certain threshold the Gini coefficient should start to return to a more equal distribution. It is obvious that China doesn’t follow the curve.

The PNAS authors offer data to show that the two biggest social determinants that factor into this high inequality are regional disparities and rural-urban gap. I will return to some of these issues in future blogs.

Posted in Climate Change | Tagged , , , , , , , , , , , , , , , | 1 Comment

Back From China

In a previous blog (December 3, 2012) I described a common exercise that I give to students to highlight the important skill of scenario building:

In the table below I ask undergraduates from my course (General Education – no prerequisites) to use primary sources to collect some relevant data about four countries and the World, and to answer a few questions by evaluating this data. I have filled in part of the table with the appropriate data for 2008 – the last year that data were available for the indicators in which I was interested.

Fill up the following table:

Table for EJ States vs Individual

Rank the four countries in terms of total energy use and CO2 emissions.

  1. Compare (in %) the top user and emitter with World use and emission.
  2. Rank the four countries in terms of energy use and CO2 emission per capita, and compare the numbers with global data.
  3. If the GDP growth continues – how many years will it take China to catch up to the US?
  4. If the GDP/Capita growth continues – how many years it will take China to catch up to the US?
  5. What will the World’s GDP be at that time?
  6. What will the World’s population be at that time?
  7. If you assume that the last three terms of the IPAT equation will not change – what will the World’s CO2 emission be at that time?
  8. Assume that only half of the emissions will stay in the atmosphere and that the Climate Sensitivity is 2.50C for doubling the concentration of CO2 compared to the pre-industrial levels – what will the climate consequences of 8 be?

In my February 17, 2015 blog I essentially repeated this exercise, focusing on India. Since I was already planning a vacation this summer, I used some of my time to try the exercise in real life with a focus on China. I left for China with my wife on June 28th and we just came back. I will try to describe some of our experiences within the next few blogs.

The figure below maps the places that we visited:

Map of places visited in China

The last time I visited China was in August of 1992. I was on the organizing committee of a solar energy conference that took place in Beijing and I followed up the conference with visits to Xian and Shanghai. This 23 year gap is approximately equal to the span of a new generation. Here are some of the changes that took place in China over this period, as compared to their parallels in the US at the same time. The data is from the World Bank database.

China & US indicators 1992-2012

*The World Bank doesn’t supply data for “prevalence of undernourishment” for any developed country. The assumption is that there is none.

According to the World Bank and the GDP/Capita data it gives in the table, China has “graduated” over this period from being a Low Income Country to Lower Middle Income Country. However, looking at other indicators and paying attention to factors such as school enrollment, improved sanitation, internet users high technology export, fixed broadband subscriptions, life expectancy and fertility rates suggests a much sharper transition. Of course, indicators tracked in statistical comparisons are markedly different from the anecdotal impressions that accompany an actual visit.

China’s population now constitutes close to 20% of the world’s population. The urban population in China now (2012) makes up around 52% of the total (World Bank), as compared with the US, whose urban population comes to 81%. In 1992 the urban population in China was 28%; that in the US was 72%, so the growth in China’s urban population by 2012 was more than three times faster than that in the US in the same time. In short, a visit to some of China’s megacities is important. Of course, what stands out most to a visitor is far different than what is reflected in the table. You notice the heights of the buildings, the number of passenger cars in the cities, the quality of the roads, the extent of public transportation, the infrastructure of the power delivery, the quality of the air, and the availability of goods – from essentials to global luxuries. Probably the most important test of progress in economic development is: what happens if you have a highly developed area in close contact with an underdeveloped one? What steps must be taken to prevent people from moving illegally across the border in order to improve their economic wellbeing? Such an experiment actually exists in the form of Hong Kong and Shenzhen.

In the next few weeks I will try to focus my blogs on the various aspects of China’s efforts toward further development and the implications that these efforts hold for a global transition to more sustainable energy sources.

Posted in Climate Change | Tagged , , , , , , , , , , , , , , , , , , , , , | Leave a comment

Vacation Notice

This week I am taking a break from the blog, so there will be no post. Please do come back next Tuesday, when I promise to continue our discussions.

Posted in Climate Change | Tagged | Leave a comment

The Drop in Oil Price and What it Means

The test of any major transition is in its response to a sharp perturbation. Often such disturbances come in the form of a major war. Fortunately, the present global energy transition is being tested in a much more peaceful manner. As I have mentioned in previous blogs, economics have been the main driving force behind a successful transition from fossil-fuel-dominated energy sources to sustainable ones that do not result in carbon emissions. Attempts to make sustainable energy sources competitive with fossil fuels focused in large part on making the sustainable energy sources price competitive with fossil fuels. These attempts were trying to either make fossil fuels more expensive through instruments such as carbon tax or cap and trade or to lean in the other direction, making the sustainable energy sources cheaper through subsidies of one form or another. In the summer of 2014 a major trend started to shake the marketplace as it disrupted the balance between supply and demand. Prices of fossil fuels dropped by more than 50% in 6 months or so. I have discussed this sharp decline before (see my January 13, 2015 blog) and showed an earlier version of the figure below to demonstrate the price changes

Historical chart of Brent Crude Oil prices 2012-2016Figure 1 – Recent price change in crude oil

The price of Crude Oil Brent reached below $50 a barrel in January, and has risen to the mid-$60 range now – that’s a climb of about 30% but is still more than 40% below its peak at the beginning of 2014. The January blog came a bit too early to investigate the effects of the price drop; initial reports about possible impacts are just now coming in.

One of the most informative new pieces of data on global energy use is the annual BP (British Petroleum) Statistical Review of World Energy. The 2015 report just came out and among its key findings is a comparative summary of global energy consumption growth in 2014 (shown in Figure 2).

BP Energy Growth - Non fossil fuelsFigure 2 – Global Energy Consumption and Renewable Energy Growth in 2014

The figure on the left demonstrates a marked decrease of fossil fuel use in 2014, with little or no decrease in renewable power. The figure on the right, meanwhile, depicts the recent changes that have been taking place in renewable power, including a decreasing usage of wind energy and an increase in the use of solar (in this case meaning photovoltaic because wind, biofuels and hydro are also solar-derived energy sources).

A direct comparison and breakdown of the 2014 installation of photovoltaics devices in the US is shown in Figure 3.

SEIA - Annual US Solar PV Installations 2000-2014 
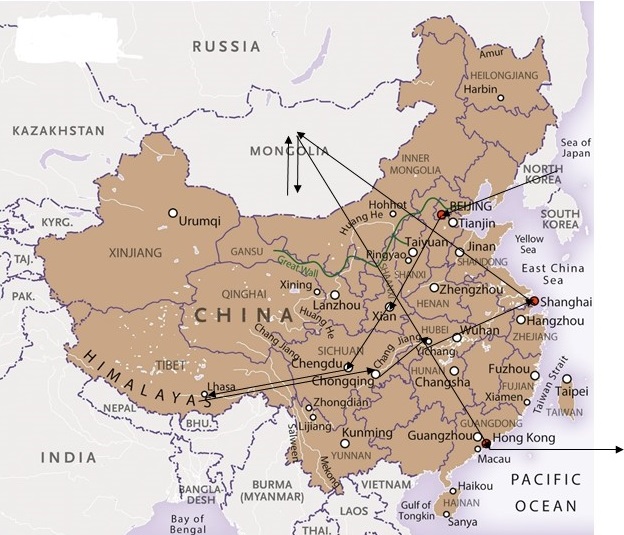
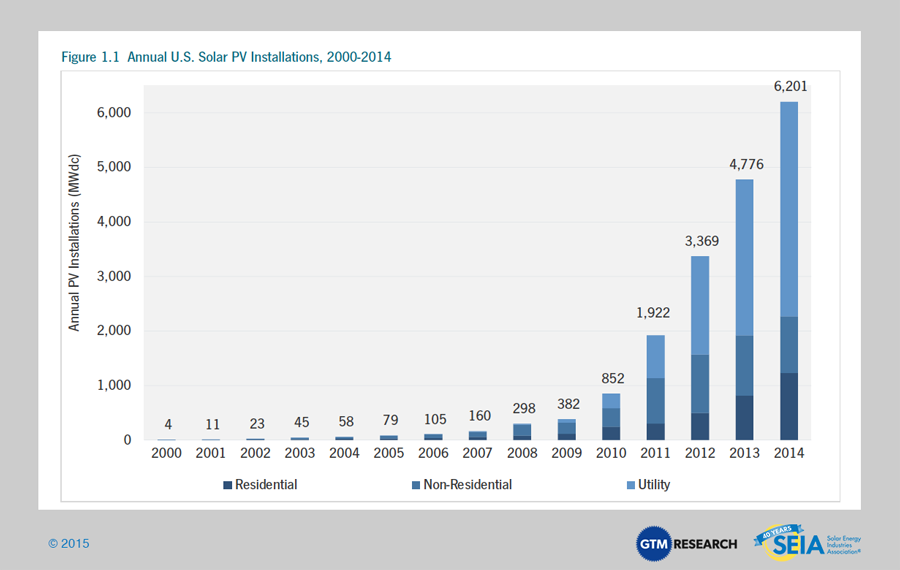
Figure 3 – Annual U.S. Solar PV Installations 2000-2014 Q4

Unfortunately, not everything in the picture is bright and cheery. Some expected negative impacts are also being reported. The aptly named Justin Doom (Bloomberg) reports a 15% drop in clean energy spending which is has already reached the lowest level since 2013:

About $50.5 billion was invested in the first three months of 2015, the least since the first quarter of 2013 when spending on clean energy totaled $43.1 billion, according to research released Friday by Bloomberg New Energy Finance. The figure a year earlier was $59.3 billion.

Lawrence Ultrich of the New York Times likewise reports a significant drop in purchase of gasoline saving vehicles such as hybrids and electric cars:

In all, 55 percent of hybrid and electric vehicle owners are defecting to a gasoline-only model at trade-in time — the lowest level of hybrid loyalty since Edmunds.com began tracking such transactions in 2011. More than one in five are switching to a conventional sport utility vehicle, nearly double the rate of three years ago.

Predictions for future trends are difficult. The supply-demand balance in fossil fuels is presently resisting significant changes, so a return to $100 or so per barrel seems unlikely in the foreseeable future. Additional midterm and longer term impacts will become more visible with time. Stay tuned.

Posted in Climate Change | Tagged , , , , , , , , , , , , , , , , , , , , , , , , , , , , , , , , , , , , , , , , | 1 Comment