This is going to be a long blog and to top it off, I’m posting it a day early. I often write these posts mid-week; this time, I waited to start writing it until the final resolution came out in the late morning on Saturday, NY time. As the title states, the resolution was approved unanimously by all 195 members! The final approval process was mercifully short, due to a surprisingly quick parliamentary maneuver by Laurent Fabius, the French Foreign Minister who acted as chair of the conference. During the plenary session, he asked for any objections. Since none were raised, he declared an official approval. Many had expected that the approval process would consist of a tedious vote by voice, giving each delegate an opportunity to say something. Mr. Fabius didn’t want to run that risk; the world should be grateful.
The last session of my Climate Change class was today (Monday) and fully focused on the COP21 resolution. The class final is on Wednesday, and as my students already know, 60% of the exam will be anchored on the conference.
The English version of the resolution encompasses 31 pages. Anybody interested in reading the full resolution can do so by accessing the UNFCCC site. The first part of the resolution gives some administrative background, while the annex includes the main content of the agreement.
This blog also contains brief quotes from the introductions by the French Foreign Minister and the French President. They deserve full credit for successfully bringing this conference to a positive conclusion. I don’t want to be too political on this, but I hope that their skill in bringing the conference to its successful conclusion will also be rewarded in the ballot box.
The resolution comes in two parts – for very important reasons, which I will enumerate in future blogs. Here, I am citing both the beginning of the preamble (the whole version is 19 pages long), and the entirety of the annex, which includes the full agreement.
For now, I will focus on the agreement itself and the short introductory remarks from the concluding plenary session on Saturday. For the benefit of my students, who are now preparing for their exam, I have marked in red those sections that I regard as especially important. In future blogs I will try to expand on these selections as well as express my own take on the agreement. I will do the same with my students in class.
Foreign Minister Laurent Fabius, on the brink of tears after presiding over nearly a fortnight of talks in Paris, delivered the proposal to ministers who must now decide whether to approve it, possibly within hours.
“It is my conviction that we have come up with an ambitious… agreement,” Fabius said, telling the ministers they would achieve a “historic turning point” for the world if they endorsed it.
The hoped-for deal seeks to end decades-long rows between rich and poor nations over how to fund the multi-trillion-dollar campaign.
… Fabius said that, if approved, the deal would set a “floor” in funding, in which at least $100 billion (92 billion euros) a year from 2020 would be channeled to help the developing world fight global warming.
It would also aim at limiting warming of the planet since the Industrial Revolution to “well below” 2.0 degrees Celsius (3.6 Fahrenheit) and strive for an even more ambitious goal of 1.5C, he said.
French President Francois Hollande and UN Secretary-General Ban Ki-moon sat on stage alongside Fabius as he made a lengthy speech imploring ministers to approve the blueprint on Saturday.
Raising hopes of a successful conclusion, negotiators stood up and cheered before Fabius spoke, and rose in another standing ovation at the end.
“You have a chance to change the world,” Hollande told delegates.
“You have to take the final step, the decisive step which allows us to reach the goal.”
…Raising hopes of a successful conclusion, negotiators stood up and cheered before Fabius spoke, and rose in another standing ovation at the end.
…The proposed agreement came after negotiators missed an initial deadline of Friday to sign an accord, as feuding ministers refused to budge on entrenched positions.
…As Fabius put forward the proposed deal, green demonstrators lobbied anew, using the geolocalisation feature on their mobile phones to spell out the words “Climate,” “Justice” and “Peace” on an interactive map of the city…
The preamble spans 19 pages. Here is the first part:
The Parties to this Agreement,
Being Parties to the United Nations Framework Convention on Climate Change, hereinafter referred to as “the Convention”,
Pursuant to the Durban Platform for Enhanced Action established by decision 1/CP.17 of the Conference of the Parties to the Convention at its seventeenth session,
In pursuit of the objective of the Convention, and being guided by its principles, including the principle of equity and common but differentiated responsibilities and respective capabilities, in the light of different national circumstances,
Recognizing the need for an effective and progressive response to the urgent threat of climate change on the basis of the best available scientific knowledge,
Also recognizing the specific needs and special circumstances of developing country Parties, especially those that are particularly vulnerable to the adverse effects of climate change, as provided for in the Convention,
Taking full account of the specific needs and special situations of the least developed countries with regard to funding and transfer of technology,
Recognizing that Parties may be affected not only by climate change, but also by the impacts of the measures taken in response to it,
Emphasizing the intrinsic relationship that climate change actions, responses and impacts have with equitable access to sustainable development and eradication of poverty,
Recognizing the fundamental priority of safeguarding food security and ending hunger, and the particular vulnerabilities of food production systems to the adverse impacts of climate change,
Taking into account the imperatives of a just transition of the workforce and the creation of decent work and quality jobs in accordance with nationally defined development priorities,
Acknowledging that climate change is a common concern of humankind,
Parties should, when taking action to address climate change, respect, promote and consider their respective obligations on human rights, the right to health, the rights of indigenous peoples, local communities, migrants, children, persons with disabilities and people in vulnerable situations and the right to development, as well as gender equality, empowerment of women and intergenerational equity,
Recognizing the importance of the conservation and enhancement, as appropriate, of sinks and reservoirs of the greenhouse gases referred to in the Convention,
Noting the importance of ensuring the integrity of all ecosystems, including oceans, and the protection of biodiversity, recognized by some cultures as Mother Earth, and noting the importance for some of the concept of “climate justice”, when taking action to address climate change,
Affirming the importance of education, training, public awareness, public participation, public access to information and cooperation at all levels on the matters addressed in this Agreement,
Recognizing the importance of the engagements of all levels of government and various actors, in accordance with respective national legislations of Parties, in addressing climate change,
Also recognizing that sustainable lifestyles and sustainable patterns of consumption and production, with developed country Parties taking the lead, play an important role in addressing climate change,
Have agreed as follows:
Article 1
For the purpose of this Agreement, the definitions contained in Article 1 of the Convention shall apply. In addition:
- “Convention” means the United Nations Framework Convention on Climate Change, adopted in New York on 9 May 1992.
- “Conference of the Parties” means the Conference of the Parties to the Convention.
- “Party” means a Party to this Agreement.
Article 2
- This Agreement, in enhancing the implementation of the Convention, including its objective, aims to strengthen the global response to the threat of climate change, in the context of sustainable development and efforts to eradicate poverty, including by:
(a) Holding the increase in the global average temperature to well below 2 °C above pre-industrial levels and to pursue efforts to limit the temperature increase to 1.5 °C above pre-industrial levels, recognizing that this would significantly reduce the risks and impacts of climate change;
(b) Increasing the ability to adapt to the adverse impacts of climate change and foster climate resilience and low greenhouse gas emissions development, in a manner that does not threaten food production;
(c) Making finance flows consistent with a pathway towards low greenhouse gas emissions and climate resilient development.
- This Agreement will be implemented to reflect equity and the principle of common but differentiated responsibilities and respective capabilities, in the light of different national circumstances.
Article 3
As nationally determined contributions to the global response to climate change, all Parties are to undertake and communicate ambitious efforts as defined in Articles 4, 7, 9, 10, 11 and 13 with the view to achieving the purpose of this Agreement as set out in Article 2. The efforts of all Parties will represent a progression over time, while recognizing the need to support developing country Parties for the effective implementation of this Agreement.
Article 4
- In order to achieve the long-term temperature goal set out in Article 2, Parties aim to reach global peaking of greenhouse gas emissions as soon as possible, recognizing that peaking will take longer for developing country Parties, and to undertake rapid reductions thereafter in accordance with best available science, so as to achieve a balance between anthropogenic emissions by sources and removals by sinks of greenhouse gases in the second half of this century, on the basis of equity, and in the context of sustainable development and efforts to eradicate poverty.
- Each Party shall prepare, communicate and maintain successive nationally determined contributions that it intends to achieve. Parties shall pursue domestic mitigation measures with the aim of achieving the objectives of such contributions.
- Each Party’s successive nationally determined contribution will represent a progression beyond the Party’s then current nationally determined contribution and reflect its highest possible ambition, reflecting its common but differentiated responsibilities and respective capabilities, in the light of different national circumstances.
- Developed country Parties shall continue taking the lead by undertaking economy-wide absolute emission reduction targets. Developing country Parties should continue enhancing their mitigation efforts, and are encouraged to move over time towards economy-wide emission reduction or limitation targets in the light of different national circumstances.
- Support shall be provided to developing country Parties for the implementation of this Article, in accordance with Articles 9, 10 and 11, recognizing that enhanced support for developing country Parties will allow for higher ambition in their actions.
- The least developed countries and small island developing States may prepare and communicate strategies, plans and actions for low greenhouse gas emissions development reflecting their special circumstances.
- Mitigation co-benefits resulting from Parties’ adaptation actions and/or economic diversification plans can contribute to mitigation outcomes under this Article.
- In communicating their nationally determined contributions, all Parties shall provide the information necessary for clarity, transparency and understanding in accordance with decision 1/CP.21 and any relevant decisions of the Conference of the Parties serving as the meeting of the Parties to the Paris Agreement.
- Each Party shall communicate a nationally determined contribution every five years in accordance with decision 1/CP.21 and any relevant decisions of the Conference of the Parties serving as the meeting of the Parties to the Paris Agreement and be informed by the outcomes of the global stock-take referred to in Article 14.
- The Conference of the Parties serving as the meeting of the Parties to the Paris Agreement shall consider common time frames for nationally determined contributions at its first session.
- A Party may at any time adjust its existing nationally determined contribution with a view to enhancing its level of ambition, in accordance with guidance adopted by the Conference of the Parties serving as the meeting of the Parties to the Paris Agreement.
- Nationally determined contributions communicated by Parties shall be recorded in a public registry maintained by the secretariat.
- Parties shall account for their nationally determined contributions. In accounting for anthropogenic emissions and removals corresponding to their nationally determined contributions, Parties shall promote environmental integrity, transparency, accuracy, completeness, comparability and consistency, and ensure the avoidance of double counting, in accordance with guidance adopted by the Conference of the Parties serving as the meeting of the Parties to the Paris Agreement.
- In the context of their nationally determined contributions, when recognizing and implementing mitigation actions with respect to anthropogenic emissions and removals, Parties should take into account, as appropriate, existing methods and guidance under the Convention, in the light of the provisions of paragraph 13 of this Article.
- Parties shall take into consideration in the implementation of this Agreement the concerns of Parties with economies most affected by the impacts of response measures, particularly developing country Parties.
- Parties, including regional economic integration organizations and their member States, that have reached an agreement to act jointly under paragraph 2 of this Article shall notify the secretariat of the terms of that agreement, including the emission level allocated to each Party within the relevant time period, when they communicate their nationally determined contributions. The secretariat shall in turn inform the Parties and signatories to the Convention of the terms of that agreement.
- Each party to such an agreement shall be responsible for its emission level as set out in the agreement referred to in paragraph 16 above in accordance with paragraphs 13 and 14 of this Article and Articles 13 and 15.
- If Parties acting jointly do so in the framework of, and together with, a regional economic integration organization which is itself a Party to this Agreement, each member State of that regional economic integration organization individually, and together with the regional economic integration organization, shall be responsible for its emission level as set out in the agreement communicated under paragraph 16 of this Article in accordance with paragraphs 13 and 14 of this Article and Articles 13 and 15.
- All Parties should strive to formulate and communicate long-term low greenhouse gas emission development strategies, mindful of Article 2 taking into account their common but differentiated responsibilities and respective capabilities, in the light of different national circumstances.
Article 5
- Parties should take action to conserve and enhance, as appropriate, sinks and reservoirs of greenhouse gases as referred to in Article 4, paragraph 1(d), of the Convention, including forests.
- Parties are encouraged to take action to implement and support, including through results-based payments, the existing framework as set out in related guidance and decisions already agreed under the Convention for: policy approaches and positive incentives for activities relating to reducing emissions from deforestation and forest degradation, and the role of conservation, sustainable management of forests and enhancement of forest carbon stocks in developing countries; and alternative policy approaches, such as joint mitigation and adaptation approaches for the integral and sustainable management of forests, while reaffirming the importance of incentivizing, as appropriate, non-carbon benefits associated with such approaches.
Article 6
- Parties recognize that some Parties choose to pursue voluntary cooperation in the implementation of their nationally determined contributions to allow for higher ambition in their mitigation and adaptation actions and to promote sustainable development and environmental integrity.
- Parties shall, where engaging on a voluntary basis in cooperative approaches that involve the use of internationally transferred mitigation outcomes towards nationally determined contributions, promote sustainable development and ensure environmental integrity and transparency, including in governance, and shall apply robust accounting to ensure, inter alia, the avoidance of double counting, consistent with guidance adopted by the Conference of the Parties serving as the meeting of the Parties to the Paris Agreement.
- The use of internationally transferred mitigation outcomes to achieve nationally determined contributions under this Agreement shall be voluntary and authorized by participating Parties.
- A mechanism to contribute to the mitigation of greenhouse gas emissions and support sustainable development is hereby established under the authority and guidance of the Conference of the Parties serving as the meeting of the Parties to the Paris Agreement for use by Parties on a voluntary basis. It shall be supervised by a body designated by the Conference of the Parties serving as the meeting of the Parties to the Paris Agreement, and shall aim:
(a) To promote the mitigation of greenhouse gas emissions while fostering sustainable development;
(b) To incentivize and facilitate participation in the mitigation of greenhouse gas emissions by public and private entities authorized by a Party;
(c) To contribute to the reduction of emission levels in the host Party, which will benefit from mitigation activities resulting in emission reductions that can also be used by another Party to fulfil its nationally determined contribution; and
(d) To deliver an overall mitigation in global emissions.
- Emission reductions resulting from the mechanism referred to in paragraph 4 of this Article shall not be used to demonstrate achievement of the host Party’s nationally determined contribution if used by another Party to demonstrate achievement of its nationally determined contribution.
- The Conference of the Parties serving as the meeting of the Parties to the Paris Agreement shall ensure that a share of the proceeds from activities under the mechanism referred to in paragraph 4 of this Article is used to cover administrative expenses as well as to assist developing country Parties that are particularly vulnerable to the adverse effects of climate change to meet the costs of adaptation.
- The Conference of the Parties serving as the meeting of the Parties to the Paris Agreement shall adopt rules, modalities and procedures for the mechanism referred to in paragraph 4 of this Article at its first session.
- Parties recognize the importance of integrated, holistic and balanced non-market approaches being available to Parties to assist in the implementation of their nationally determined contributions, in the context of sustainable development and poverty eradication, in a coordinated and effective manner, including through, inter alia, mitigation, adaptation, finance, technology transfer and capacity-building, as appropriate. These approaches shall aim to:
(a) Promote mitigation and adaptation ambition;
(b) Enhance public and private participation in the implementation of nationally determined contributions; and
(c) Enable opportunities for coordination across instruments and relevant institutional arrangements.
- A framework for non-market approaches to sustainable development is hereby defined to promote the nonmarket approaches referred to in paragraph 8 of this Article.
Article 7
- Parties hereby establish the global goal on adaptation of enhancing adaptive capacity, strengthening resilience and reducing vulnerability to climate change, with a view to contributing to sustainable development and ensuring an adequate adaptation response in the context of the temperature goal referred to in Article 2. 2. Parties recognize that adaptation is a global challenge faced by all with local, subnational, national, regional and international dimensions, and that it is a key component of and makes a contribution to the long-term global response to climate change to protect people, livelihoods and ecosystems, taking into account the urgent and immediate needs of those developing country Parties that are particularly vulnerable to the adverse effects of climate change.
- The adaptation efforts of developing country Parties shall be recognized, in accordance with the modalities to be adopted by the Conference of the Parties serving as the meeting of the Parties to the Paris Agreement at its first session.
- Parties recognize that the current need for adaptation is significant and that greater levels of mitigation can reduce the need for additional adaptation efforts, and that greater adaptation needs can involve greater adaptation costs.
- Parties acknowledge that adaptation action should follow a country-driven, gender-responsive, participatory and fully transparent approach, taking into consideration vulnerable groups, communities and ecosystems, and should be based on and guided by the best available science and, as appropriate, traditional knowledge, knowledge of indigenous peoples and local knowledge systems, with a view to integrating adaptation into relevant socioeconomic and environmental policies and actions, where appropriate.
- Parties recognize the importance of support for and international cooperation on adaptation efforts and the importance of taking into account the needs of developing country Parties, especially those that are particularly vulnerable to the adverse effects of climate change.
- Parties should strengthen their cooperation on enhancing action on adaptation, taking into account the Cancun Adaptation Framework, including with regard to:
(a) Sharing information, good practices, experiences and lessons learned, including, as appropriate, as these relate to science, planning, policies and implementation in relation to adaptation actions;
(b) Strengthening institutional arrangements, including those under the Convention that serve this Agreement, to support the synthesis of relevant information and knowledge, and the provision of technical support and guidance to Parties;
(c) Strengthening scientific knowledge on climate, including research, systematic observation of the climate system and early warning systems, in a manner that informs climate services and supports decision making;
(d) Assisting developing country Parties in identifying effective adaptation practices, adaptation needs, priorities, support provided and received for adaptation actions and efforts, and challenges and gaps, in a manner consistent with encouraging good practices;
(e) Improving the effectiveness and durability of adaptation actions.
- United Nations specialized organizations and agencies are encouraged to support the efforts of Parties to implement the actions referred to in paragraph 7 of this Article, taking into account the provisions of paragraph 5 of this Article.
- Each Party shall, as appropriate, engage in adaptation planning processes and the implementation of actions, including the development or enhancement of relevant plans, policies and/or contributions, which may include:
(a) The implementation of adaptation actions, undertakings and/or efforts;
(b) The process to formulate and implement national adaptation plans;
(c) The assessment of climate change impacts and vulnerability, with a view to formulating nationally determined prioritized actions, taking into account vulnerable people, places and ecosystems;
(d) Monitoring and evaluating and learning from adaptation plans, policies, programmes and actions; and
(e) Building the resilience of socioeconomic and ecological systems, including through economic diversification and sustainable management of natural resources.
- Each Party should, as appropriate, submit and update periodically an adaptation communication, which may include its priorities, implementation and support needs, plans and actions, without creating any additional burden for developing country Parties.
- The adaptation communication referred to in paragraph 10 of this Article shall be, as appropriate, submitted and updated periodically, as a component of or in conjunction with other communications or documents, including a national adaptation plan, a nationally determined contribution as referred to in Article 4, paragraph 2, and/or a national communication.
- The adaptation communications referred to in paragraph 10 of this Article shall be recorded in a public registry maintained by the secretariat.
- Continuous and enhanced international support shall be provided to developing country Parties for the implementation of paragraphs 7, 9, 10 and 11 of this Article, in accordance with the provisions of Articles 9, 10 and 11.
- The global stock-take referred to in Article 14 shall, inter alia:
(a) Recognize adaptation efforts of developing country Parties;
(b) Enhance the implementation of adaptation action taking into account the adaptation communication referred to in paragraph 10 of this Article;
(c) Review the adequacy and effectiveness of adaptation and support provided for adaptation; and
(d) Review the overall progress made in achieving the global goal on adaptation referred to in paragraph 1 of this Article.
Article 8
- Parties recognize the importance of averting, minimizing and addressing loss and damage associated with the adverse effects of climate change, including extreme weather events and slow onset events, and the role of sustainable development in reducing the risk of loss and damage.
- The Warsaw International Mechanism for Loss and Damage associated with Climate Change Impacts shall be subject to the authority and guidance of the Conference of the Parties serving as the meeting of the Parties to the Paris Agreement and may be enhanced and strengthened, as determined by the Conference of the Parties serving as the meeting of the Parties to the Paris Agreement.
- Parties should enhance understanding, action and support, including through the Warsaw International Mechanism, as appropriate, on a cooperative and facilitative basis with respect to loss and damage associated with the adverse effects of climate change.
- Accordingly, areas of cooperation and facilitation to enhance understanding, action and support may include:
(a) Early warning systems;
(b) Emergency preparedness;
(c) Slow onset events;
(d) Events that may involve irreversible and permanent loss and damage;
(e) Comprehensive risk assessment and management;
(f) Risk insurance facilities, climate risk pooling and other insurance solutions; (g) Non-economic losses;
(h) Resilience of communities, livelihoods and ecosystems.
- The Warsaw International Mechanism shall collaborate with existing bodies and expert groups under the Agreement, as well as relevant organizations and expert bodies outside the Agreement.
Article 9
- Developed country Parties shall provide financial resources to assist developing country Parties with respect to both mitigation and adaptation in continuation of their existing obligations under the Convention.
- Other Parties are encouraged to provide or continue to provide such support voluntarily.
- As part of a global effort, developed country Parties should continue to take the lead in mobilizing climate finance from a wide variety of sources, instruments and channels, noting the significant role of public funds, through a variety of actions, including supporting country-driven strategies, and taking into account the needs and priorities of developing country Parties. Such mobilization of climate finance should represent a progression beyond previous efforts.
- The provision of scaled-up financial resources should aim to achieve a balance between adaptation and mitigation, taking into account country-driven strategies, and the priorities and needs of developing country Parties, especially those that are particularly vulnerable to the adverse effects of climate change and have significant capacity constraints, such as the least developed countries and small island developing States, considering the need for public and grant-based resources for adaptation.
- Developed country Parties shall biennially communicate indicative quantitative and qualitative information related to paragraphs 1 and 3 of this Article, as applicable, including, as available, projected levels of public financial resources to be provided to developing country Parties. Other Parties providing resources are encouraged to communicate biennially such information on a voluntary basis.
- The global-stock take referred to in Article 14 shall take into account the relevant information provided by developed country Parties and/or Agreement bodies on efforts related to climate finance.
- Developed country Parties shall provide transparent and consistent information on support for developing country Parties provided and mobilized through public interventions biennially in accordance with the modalities, procedures and guidelines to be adopted by the Conference of the Parties serving as the meeting of the Parties to the Paris Agreement, at its first session, as stipulated in Article 13, paragraph 13. Other Parties are encouraged to do so.
- The Financial Mechanism of the Convention, including its operating entities, shall serve as the financial mechanism of this Agreement.
- The institutions serving this Agreement, including the operating entities of the Financial Mechanism of the Convention, shall aim to ensure efficient access to financial resources through simplified approval procedures and enhanced readiness support for developing country Parties, in particular for the least developed countries and Small Island developing States, in the context of their national climate strategies and plans.
Article 10
- Parties share a long-term vision on the importance of fully realizing technology development and transfer in order to improve resilience to climate change and to reduce greenhouse gas emissions.
- Parties, noting the importance of technology for the implementation of mitigation and adaptation actions under this Agreement and recognizing existing technology deployment and dissemination efforts, shall strengthen cooperative action on technology development and transfer.
- The Technology Mechanism established under the Convention shall serve this Agreement.
- A technology framework is hereby established to provide overarching guidance for the work of the Technology Mechanism in promoting and facilitating enhanced action on technology development and transfer in order to support the implementation of this Agreement, in pursuit of the long-term vision referred to in paragraph 1 of this Article.
- Accelerating, encouraging and enabling innovation is critical for an effective, long-term global response to climate change and promoting economic growth and sustainable development. Such effort shall be, as appropriate, supported, including by the Technology Mechanism and, through financial means, by the Financial Mechanism of the Convention, for collaborative approaches to research and development, and facilitating access to technology, in particular for early stages of the technology cycle, to developing country Parties.
- Support, including financial support, shall be provided to developing country Parties for the implementation of this Article, including for strengthening cooperative action on technology development and transfer at different stages of the technology cycle, with a view to achieving a balance between support for mitigation and adaptation. The global-stock take referred to in Article 14 shall take into account available information on efforts related to support on technology development and transfer for developing country Parties.
Article 11
- Capacity-building under this Agreement should enhance the capacity and ability of developing country Parties, in particular countries with the least capacity, such as the least developed countries, and those that are particularly vulnerable to the adverse effects of climate change, such as small island developing States, to take effective climate change action, including, inter alia, to implement adaptation and mitigation actions, and should facilitate technology development, dissemination and deployment, access to climate finance, relevant aspects of education, training and public awareness, and the transparent, timely and accurate communication of information.
- Capacity-building should be country-driven, based on and responsive to national needs, and foster country ownership of Parties, in particular, for developing country Parties, including at the national, subnational and local levels. Capacity-building should be guided by lessons learned, including those from capacity-building activities under the Convention, and should be an effective, iterative process that is participatory, cross-cutting and gender-responsive.
- All Parties should cooperate to enhance the capacity of developing country Parties to implement this Agreement. Developed country Parties should enhance support for capacity-building actions in developing country Parties.
- All Parties enhancing the capacity of developing country Parties to implement this Agreement, including through regional, bilateral and multilateral approaches, shall regularly communicate on these actions or measures on capacity-building. Developing country Parties should regularly communicate progress made on implementing capacity-building plans, policies, actions or measures to implement this Agreement.
- Capacity-building activities shall be enhanced through appropriate institutional arrangements to support the implementation of this Agreement, including the appropriate institutional arrangements established under the Convention that serve this Agreement. The Conference of the Parties serving as the meeting of the Parties to the Paris Agreement shall, at its first session, consider and adopt a decision on the initial institutional arrangements for capacity-building.
Article 12
Parties shall cooperate in taking measures, as appropriate, to enhance climate change education, training, public awareness, public participation and public access to information, recognizing the importance of these steps with respect to enhancing actions under this Agreement.
Article 13
- In order to build mutual trust and confidence and to promote effective implementation, an enhanced transparency framework for action and support, with built-in flexibility which takes into account Parties’ different capacities and builds upon collective experience is hereby established.
- The transparency framework shall provide flexibility in the implementation of the provisions of this Article to those developing country Parties that need it in the light of their capacities. The modalities, procedures and guidelines referred to in paragraph 13 of this Article shall reflect such flexibility.
- The transparency framework shall build on and enhance the transparency arrangements under the Convention, recognizing the special circumstances of the least developed countries and small island developing States, and be implemented in a facilitative, non-intrusive, non-punitive manner, respectful of national sovereignty, and avoid placing undue burden on Parties.
- The transparency arrangements under the Convention, including national communications, biennial reports and biennial update reports, international assessment and review and international consultation and analysis, shall form part of the experience drawn upon for the development of the modalities, procedures and guidelines under paragraph 13 of this Article.
- The purpose of the framework for transparency of action is to provide a clear understanding of climate change action in the light of the objective of the Convention as set out in its Article 2, including clarity and tracking of progress towards achieving Parties’ individual nationally determined contributions under Article 4, and Parties’ adaptation actions under Article 7, including good practices, priorities, needs and gaps, to inform the global stocktake under Article 14.
- The purpose of the framework for transparency of support is to provide clarity on support provided and received by relevant individual Parties in the context of climate change actions under Articles 4, 7, 9, 10 and 11, and, to the extent possible, to provide a full overview of aggregate financial support provided, to inform the global stock-take under Article 14.
- Each Party shall regularly provide the following information:
(a) A national inventory report of anthropogenic emissions by sources and removals by sinks of greenhouse gases, prepared using good practice methodologies accepted by the Intergovernmental Panel on Climate Change and agreed upon by the Conference of the Parties serving as the meeting of the Parties to the Paris Agreement;
(b) Information necessary to track progress made in implementing and achieving its nationally determined contribution under Article 4.
- Each Party should also provide information related to climate change impacts and adaptation under Article 7, as appropriate.
- Developed country Parties shall, and other Parties that provide support should, provide information on financial, technology transfer and capacity-building support provided to developing country Parties under Article 9, 10 and 11.
- Developing country Parties should provide information on financial, technology transfer and capacity-building support needed and received under Articles 9, 10 and 11.
- Information submitted by each Party under paragraphs 7 and 9 of this Article shall undergo a technical expert review, in accordance with decision 1/CP.21. For those developing country Parties that need it in the light of their capacities, the review process shall include assistance in identifying capacity-building needs. In addition, each Party shall participate in a facilitative, multilateral consideration of progress with respect to efforts under Article 9, and its respective implementation and achievement of its nationally determined contribution.
- The technical expert review under this paragraph shall consist of a consideration of the Party’s support provided, as relevant, and its implementation and achievement of its nationally determined contribution. The review shall also identify areas of improvement for the Party, and include a review of the consistency of the information with the modalities, procedures and guidelines referred to in paragraph 13 of this Article, taking into account the flexibility accorded to the Party under paragraph 2 of this Article. The review shall pay particular attention to the respective national capabilities and circumstances of developing country Parties.
- The Conference of the Parties serving as the meeting of the Parties to the Paris Agreement shall, at its first session, building on experience from the arrangements related to transparency under the Convention, and elaborating on the provisions in this Article, adopt common modalities, procedures and guidelines, as appropriate, for the transparency of action and support.
- Support shall be provided to developing countries for the implementation of this Article.
- Support shall also be provided for the building of transparency-related capacity of developing country Parties on a continuous basis.
Article 14
- The Conference of the Parties serving as the meeting of the Parties to the Paris Agreement shall periodically take stock of the implementation of this Agreement to assess the collective progress towards achieving the purpose of this Agreement and its long-term goals (referred to as the “global stock take”). It shall do so in a comprehensive and facilitative manner, considering mitigation, adaptation and the means of implementation and support, and in the light of equity and the best available science.
- The Conference of the Parties serving as the meeting of the Parties to the Paris Agreement shall undertake its first global stock take in 2023 and every five years thereafter unless otherwise decided by the Conference of the Parties serving as the meeting of the Parties to the Paris Agreement.
- The outcome of the global stock take shall inform Parties in updating and enhancing, in a nationally determined manner, their actions and support in accordance with the relevant provisions of this Agreement, as well as in enhancing international cooperation for climate action.
Article 15
- A mechanism to facilitate implementation of and promote compliance with the provisions of this Agreement is hereby established.
- The mechanism referred to in paragraph 1 of this Article shall consist of a committee that shall be expert-based and facilitative in nature and function in a manner that is transparent, non-adversarial and non-punitive. The committee shall pay particular attention to the respective national capabilities and circumstances of Parties.
- The committee shall operate under the modalities and procedures adopted by the Conference of the Parties serving as the meeting of the Parties to the Paris Agreement at its first session and report annually to the Conference of the Parties serving as the meeting of the Parties to the Paris Agreement.
Article 16
- The Conference of the Parties, the supreme body of the Convention, shall serve as the meeting of the Parties to this Agreement.
- Parties to the Convention that are not Parties to this Agreement may participate as observers in the proceedings of any session of the Conference of the Parties serving as the meeting of the Parties to this Agreement. When the Conference of the Parties serves as the meeting of the Parties to this Agreement, decisions under this Agreement shall be taken only by those that are Parties to this Agreement.
- When the Conference of the Parties serves as the meeting of the Parties to this Agreement, any member of the Bureau of the Conference of the Parties representing a Party to the Convention but, at that time, not a Party to this Agreement, shall be replaced by an additional member to be elected by and from amongst the Parties to this Agreement.
- The Conference of the Parties serving as the meeting of the Parties to the Paris Agreement shall keep under regular review the implementation of this Agreement and shall make, within its mandate, the decisions necessary to promote its effective implementation. It shall perform the functions assigned to it by this Agreement and shall:
(a) Establish such subsidiary bodies as deemed necessary for the implementation of this Agreement; and
(b) Exercise such other functions as may be required for the implementation of this Agreement.
- The rules of procedure of the Conference of the Parties and the financial procedures applied under the Convention shall be applied mutatis mutandis under this Agreement, except as may be otherwise decided by consensus by the Conference of the Parties serving as the meeting of the Parties to the Paris Agreement.
- The first session of the Conference of the Parties serving as the meeting of the Parties to the Paris Agreement shall be convened by the secretariat in conjunction with the first session of the Conference of the Parties that is scheduled after the date of entry into force of this Agreement. Subsequent ordinary sessions of the Conference of the Parties serving as the meeting of the Parties to the Paris Agreement shall be held in conjunction with ordinary sessions of the Conference of the Parties, unless otherwise decided by the Conference of the Parties serving as the meeting of the Parties to the Paris Agreement.
- Extraordinary sessions of the Conference of the Parties serving as the meeting of the Parties to the Paris Agreement shall be held at such other times as may be deemed necessary by the Conference of the Parties serving as the meeting of the Parties to the Paris Agreement or at the written request of any Party, provided that, within six months of the request being communicated to the Parties by the secretariat, it is supported by at least one third of the Parties.
- The United Nations and its specialized agencies and the International Atomic Energy Agency, as well as any State member thereof or observers thereto not party to the Convention, may be represented at sessions of the Conference of the Parties serving as the meeting of the Parties to the Paris Agreement as observers. Anybody or agency, whether national or international, governmental or non-governmental, which is qualified in matters covered by this Agreement and which has informed the secretariat of its wish to be represented at a session of the Conference of the Parties serving as the meeting of the Parties to the Paris Agreement as an observer, may be so admitted unless at least one third of the Parties present object. The admission and participation of observers shall be subject to the rules of procedure referred to in paragraph 5 of this Article.
Article 17
- The secretariat established by Article 8 of the Convention shall serve as the secretariat of this Agreement.
- Article 8, paragraph 2, of the Convention on the functions of the secretariat, and Article 8, paragraph 3, of the Convention, on the arrangements made for the functioning of the secretariat, shall apply mutatis mutandis to this Agreement. The secretariat shall, in addition, exercise the functions assigned to it under this Agreement and by the Conference of the Parties serving as the meeting of the Parties to the Paris Agreement.
FCCC/CP/2015/L.9 30
Article 18
- The Subsidiary Body for Scientific and Technological Advice and the Subsidiary Body for Implementation established by Articles 9 and 10 of the Convention shall serve, respectively, as the Subsidiary Body for Scientific and Technological Advice and the Subsidiary Body for Implementation of this Agreement. The provisions of the Convention relating to the functioning of these two bodies shall apply mutatis mutandis to this Agreement. Sessions of the meetings of the Subsidiary Body for Scientific and Technological Advice and the Subsidiary Body for Implementation of this Agreement shall be held in conjunction with the meetings of, respectively, the Subsidiary Body for Scientific and Technological Advice and the Subsidiary Body for Implementation of the Convention.
- Parties to the Convention that are not Parties to this Agreement may participate as observers in the proceedings of any session of the subsidiary bodies. When the subsidiary bodies serve as the subsidiary bodies of this Agreement, decisions under this Agreement shall be taken only by those that are Parties to this Agreement. 3. When the subsidiary bodies established by Articles 9 and 10 of the Convention exercise their functions with regard to matters concerning this Agreement, any member of the bureaux of those subsidiary bodies representing a Party to the Convention but, at that time, not a Party to this Agreement, shall be replaced by an additional member to be elected by and from amongst the Parties to this Agreement.
Article 19
- Subsidiary bodies or other institutional arrangements established by or under the Convention, other than those referred to in this Agreement, shall serve this Agreement upon a decision of the Conference of the Parties serving as the meeting of the Parties to the Paris Agreement. The Conference of the Parties serving as the meeting of the Parties to the Paris Agreement shall specify the functions to be exercised by such subsidiary bodies or arrangements.
- The Conference of the Parties serving as the meeting of the Parties to the Paris Agreement may provide further guidance to such subsidiary bodies and institutional arrangements.
Article 20
- This Agreement shall be open for signature and subject to ratification, acceptance or approval by States and regional economic integration organizations that are Parties to the Convention. It shall be open for signature at the United Nations Headquarters in New York from 22 April 2016 to 21 April 2017. Thereafter, this Agreement shall be open for accession from the day following the date on which it is closed for signature. Instruments of ratification, acceptance, approval or accession shall be deposited with the Depositary.
- Any regional economic integration organization that becomes a Party to this Agreement without any of its member States being a Party shall be bound by all the obligations under this Agreement. In the case of regional economic integration organizations with one or more member States that are Parties to this Agreement, the organization and its member States shall decide on their respective responsibilities for the performance of their obligations under this Agreement. In such cases, the organization and the member States shall not be entitled to exercise rights under this Agreement concurrently.
- In their instruments of ratification, acceptance, approval or accession, regional economic integration organizations shall declare the extent of their competence with respect to the matters governed by this Agreement. These organizations shall also inform the Depositary, who shall in turn inform the Parties, of any substantial modification in the extent of their competence.
Article 21
- This Agreement shall enter into force on the thirtieth day after the date on which at least 55 Parties to the Convention accounting in total for at least an estimated 55 percent of the total global greenhouse gas emissions have deposited their instruments of ratification, acceptance, approval or accession.
- Solely for the limited purpose of paragraph 1 of this Article, “total global greenhouse gas emissions” means the most up-to-date amount communicated on or before the date of adoption of this Agreement by the Parties to the Convention.
- For each State or regional economic integration organization that ratifies, accepts or approves this Agreement or accedes thereto after the conditions set out in paragraph 1 of this Article for entry into force have been fulfilled, this Agreement shall enter into force on the thirtieth day after the date of deposit by such State or regional economic integration organization of its instrument of ratification, acceptance, approval or accession.
- For the purposes of paragraph 1 of this Article, any instrument deposited by a regional economic integration organization shall not be counted as additional to those deposited by its member States.
Article 22
The provisions of Article 15 of the Convention on the adoption of amendments to the Convention shall apply mutatis mutandis to this Agreement.
Article 23
- The provisions of Article 16 of the Convention on the adoption and amendment of annexes to the Convention shall apply mutatis mutandis to this Agreement.
- Annexes to this Agreement shall form an integral part thereof and, unless otherwise expressly provided for, a reference to this Agreement constitutes at the same time a reference to any annexes thereto. Such annexes shall be restricted to lists, forms and any other material of a descriptive nature that is of a scientific, technical, procedural or administrative character.
Article 24
The provisions of Article 14 of the Convention on settlement of disputes shall apply mutatis mutandis to this Agreement.
Article 25
- Each Party shall have one vote, except as provided for paragraph 2 of this Article.
- Regional economic integration organizations, in matters within their competence, shall exercise their right to vote with a number of votes equal to the number of their member States that are Parties to this Agreement. Such an organization shall not exercise its right to vote if any of its member States exercises its right, and vice versa.
Article 26
The Secretary-General of the United Nations shall be the Depositary of this Agreement.
Article 27
No reservations may be made to this Agreement.
Article 28
- At any time after three years from the date on which this Agreement has entered into force for a Party, that Party may withdraw from this Agreement by giving written notification to the Depositary.
- Any such withdrawal shall take effect upon expiry of one year from the date of receipt by the Depositary of the notification of withdrawal, or on such later date as may be specified in the notification of withdrawal.
- Any Party that withdraws from the Convention shall be considered as also having withdrawn from this Agreement.
Article 29
The original of this Agreement, of which the Arabic, Chinese, English, French, Russian and Spanish texts are equally authentic, shall be deposited with the Secretary-General of the United Nations.
DONE at Paris this twelfth day of December two thousand and fifteen. IN WITNESS WHEREOF, the undersigned, being duly authorized to that effect, have signed this Agreement.
 This is one of the most encouraging demonstrations of the bottom-up approach to global energy transition that we need to mitigate anthropogenic climate change. That said, it suffers from the same lack of enforcement authority as the sovereign countries that signed the formal COP21 agreement. A new CEO with some earning difficulties might decide that he or she wants nothing to do with these commitments, and happily revert back to carbon-emitting fossil fuels. However, in many cases, the timeline for these commitments is now; there is no need to wait until 2023 for the initial compliance evaluations.
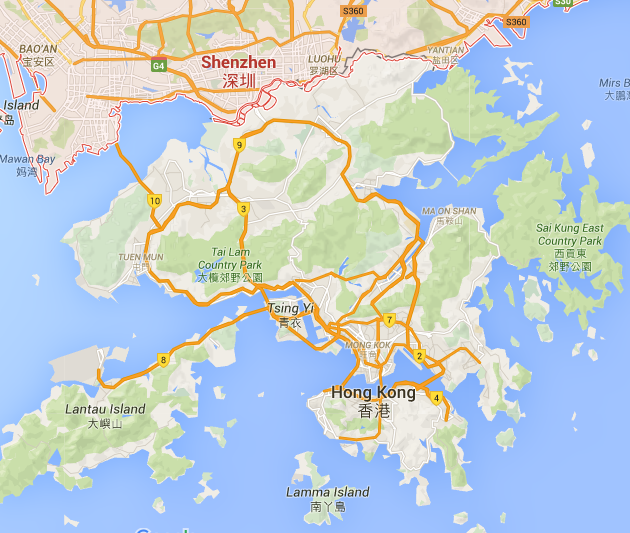 Figure 2 – Shenzhen and Hong Kong (Google maps)
 Figure 1
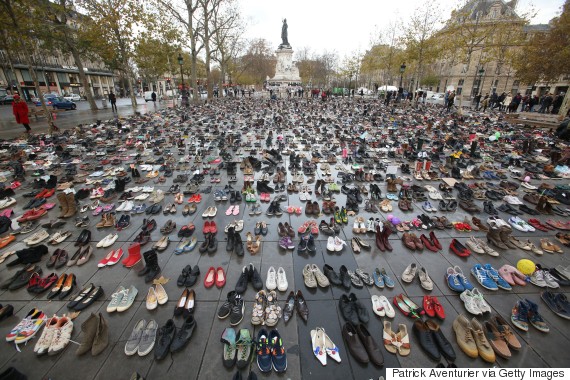 Figure 2