(Source: Global Sign)
One obvious distinction between retrofitting (see last week’s blog) and repairing or fixing, is the growing attempt to repurpose new technologies into existing infrastructure. The novelty of these emerging capabilities is not waiting until the infrastructure breaks down. In many cases, the potential benefits of incorporating emerging technologies into “perfectly” functional “old” infrastructures justify the expenses. Such incorporations have been labeled the Internet of Things (IoT). I did a Google search, and AI compiled the following:
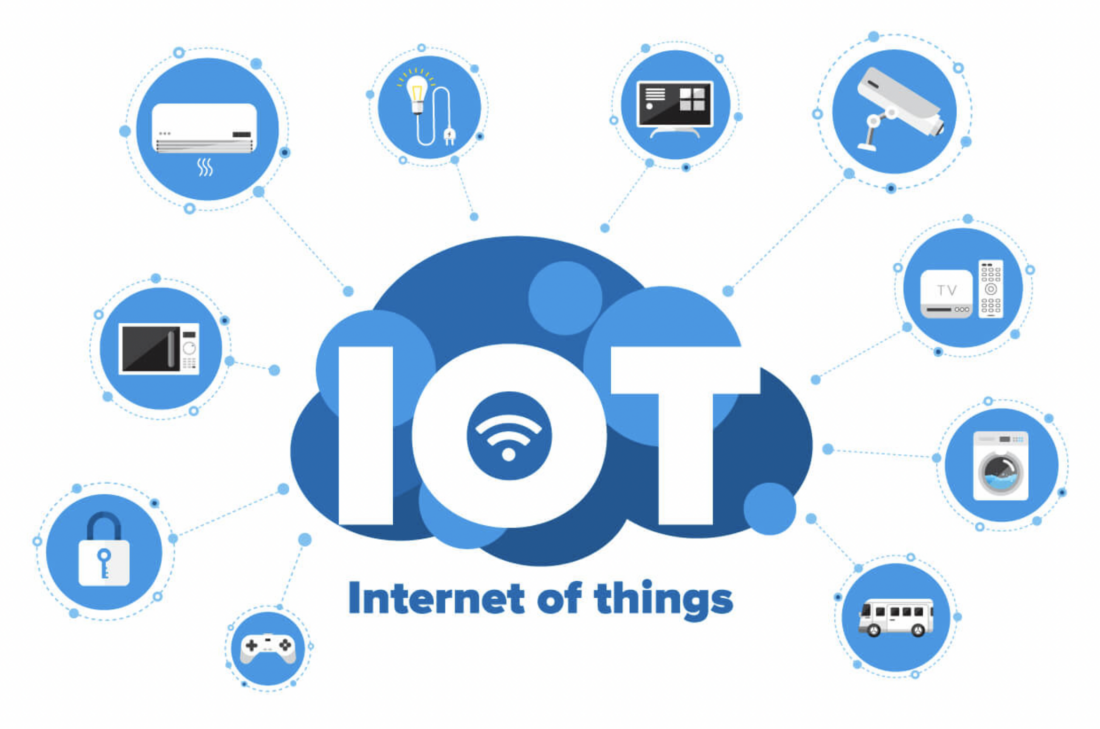
The Internet of Things (IoT) is a network of physical objects that are connected to the internet. These objects are embedded with sensors, software, and other technologies that allow them to collect and share data. The purpose of IoT is to connect devices and objects so they can be remotely monitored and controlled.
The following examples come from the same source:
- Connected cars
- Smart appliances
- Connected security systems
- Smart agriculture equipment
- Connected retail
- Connected healthcare monitors
- Connected manufacturing equipment
- Connected cities
- Digital personal assistants like Alexa, Siri, and Cortana
IoT devices can include mechanical and digital machines, Consumer objects, Televisions, Security cameras, Exercise equipment.
Some history of this recent concept is given below:
The main concept of a network of smart devices was discussed as early as 1982, with a modified Coca-Cola vending machine at Carnegie Mellon University becoming the first ARPANET-connected appliance,[13] able to report its inventory and whether newly loaded drinks were cold or not.[14] Mark Weiser‘s 1991 paper on ubiquitous computing, “The Computer of the 21st Century”, as well as academic venues such as UbiComp and PerCom produced the contemporary vision of the IOT.[15][16] In 1994, Reza Raji described the concept in IEEE Spectrum as “[moving] small packets of data to a large set of nodes, so as to integrate and automate everything from home appliances to entire factories”.[17] Between 1993 and 1997, several companies proposed solutions like Microsoft‘s at Work or Novell‘s NEST. The field gained momentum when Bill Joy envisioned device-to-device communication as a part of his “Six Webs” framework, presented at the World Economic Forum at Davos in 1999.[18]
The concept of the “Internet of things” and the term itself, first appeared in a speech by Peter T. Lewis, to the Congressional Black Caucus Foundation 15th Annual Legislative Weekend in Washington, D.C., published in September 1985.[19] According to Lewis, “The Internet of Things, or IoT, is the integration of people, processes and technology with connectable devices and sensors to enable remote monitoring, status, manipulation and evaluation of trends of such devices.”[20]
Often, IoT devices come with the descriptive title of “smart.” We will meet a few examples as we go along.
Recently, I did a webinar about the matter; I hope to continue involvement with the concept.
A cost benefit analysis is absolutely essential for retrofitting any well-functioning infrastructure with new technology. One good example where such an analysis was missing is the marketing of smart toasters. This toaster is listed for around $400; even so, it already has 255 ratings on Amazon.
My emphasis going forward will probably be focused on applications that adapt existing infrastructure and repurpose space and resources to further environmental efforts. This means things that help to minimize waste, minimize energy intensity (ratio of energy use to produce a desired product), and participate in the global energy transition. All of these actions and applications come under the close scrutiny of tight cost benefit analyses aimed at resilience against disasters. A good example of such an effort is the relatively recent development of smart thermostats:
Smart thermostats are Wi-Fi thermostats that can be used with home automation and are responsible for controlling a home’s heating, ventilation, and air conditioning. They perform similar functions as a Programmable thermostat as they allow the user to control the temperature of their home throughout the day using a schedule, but also contain additional features, such as sensors and Wi-Fi connectivity,[1][2] that improve upon the issues with programming.
Like other Wi-Fi thermostats, they are connected to the Internet via a Wi-Fi network. They allow users to adjust heating settings from other internet-connected devices, such as a laptop or smartphones. This allows users to control the thermostat remotely. This ease of use is essential for ensuring energy savings: studies have shown that households with programmable thermostats actually have higher energy consumption than those with simple thermostats because residents program them incorrectly or disable them completely.[3][4]
Smart thermostats also record internal/external temperatures, the time the HVAC system has been running and can notify the user if the system’s air filter needs to be replaced. This information is typically displayed later on an internet-connected device such as a smartphone.
Smart thermostats, which can be checked and adjusted from a distance, are capable of minimizing energy use, taking into account the specific needs, conditions, and limitations of the host building (regulating temperature based on how many people are there, varying weather, insulation, etc.).
Next week’s blog will explore more examples, including smart electricity meters.


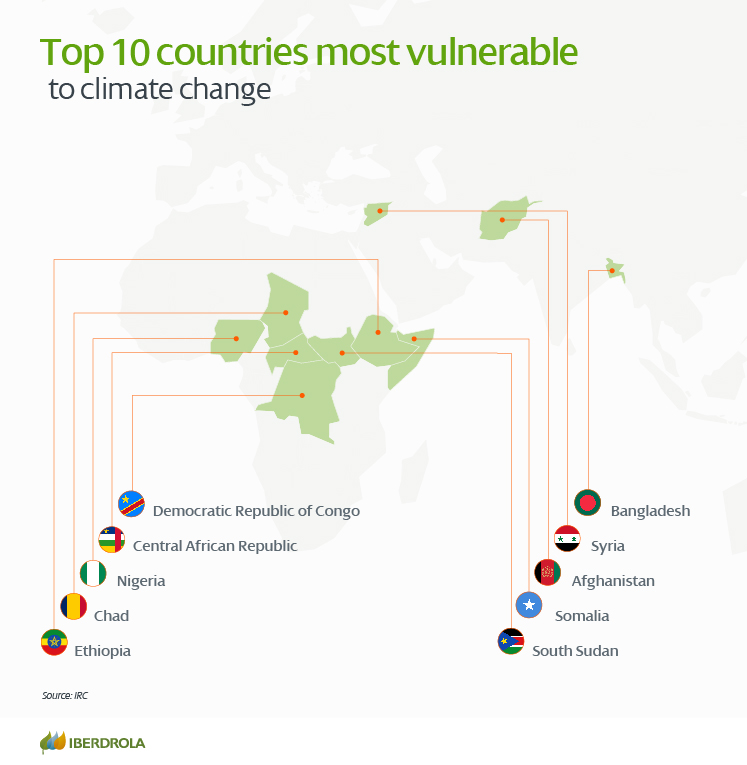 Figure 1 – The 10 countries most threatened by climate change in the 21st century (Source: IRC
 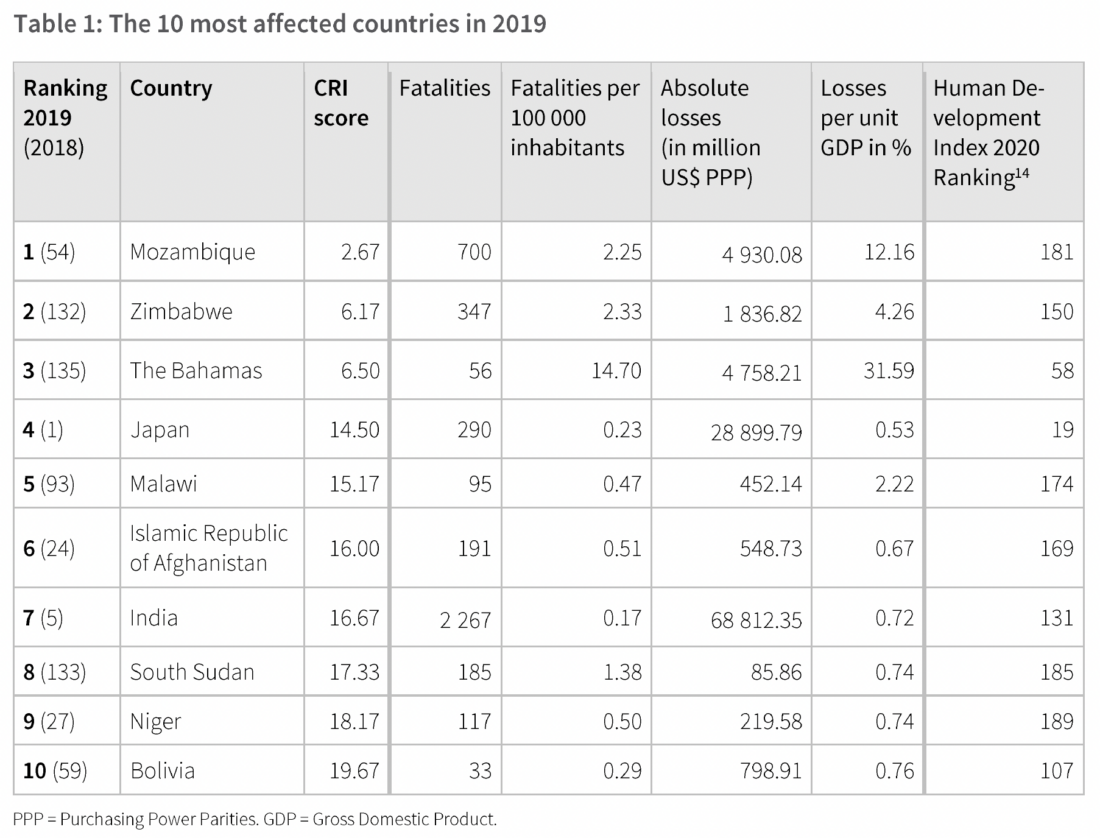 This ranking is independent of the ability to mitigate the damage, but with one exception (Japan) also includes only developing countries. This ranking is based on the Global Climate Risk Index (CRI), summarized below from the
 Figure 1 – A subway ad for for CUNY highlighting different clubs
 Figure 2 – Another subway ad specifies the number of programs that CUNY runs
 (Source: ABC News: Andie Noonan via