Hi, I’m Sonya Landau. I’ve been Micha’s editor for this blog since the beginning, and have contributed a couple of guest blogs over the years regarding Tucson, water, and heat (see the October 9, 2018 and June 22, 2021 posts). Given that his latest topic is Arizona and the conflict between population growth and water scarcity, I agreed to weigh in again here.
Population Growth
Last week, Micha mentioned the population of the Phoenix metro area, which is growing astronomically. According to the Arizona Commerce Authority, as of 2022, the area boasted a population of 5,040,400 and is projected to reach 8,035,300 by 2052. It is one of the fastest-growing cities in the nation. I’m a native Arizonan and I love the Sonoran Desert. I also understand the lure of relatively low real estate costs. Still, the idea of so many people moving to a place where it regularly reaches over 110oF for extended stretches during the summer and which has a history of chronic drought seems especially absurd in the face of climate change, which promises to worsen both the heat and the availability of water. In contrast, the Tucson area is (fortunately) growing slower. In 2022 it had 1,072,300 people and is expected to reach 1,436,500 by 2052. As Micha has mentioned, there is a very real chance in the not-so-distant future that many Arizona residents will become climate refugees seeking shelter in more temperate areas.
Of course, one of the key considerations in the sustainability of this growth is water. Arizona has had laws since 1980 that require developers in cities to prove a 100-year water supply for each new project that does not rely exclusively on groundwater. The goal is to avoid overtaxing and depleting the finite groundwater reserves. Last month, the state halted approval of some of the construction projects near Phoenix because of doubts about water availability. Already approved projects will continue, as will new ones that exclusively use surface or recycled water rather than groundwater.
The Colorado River and Water Rights
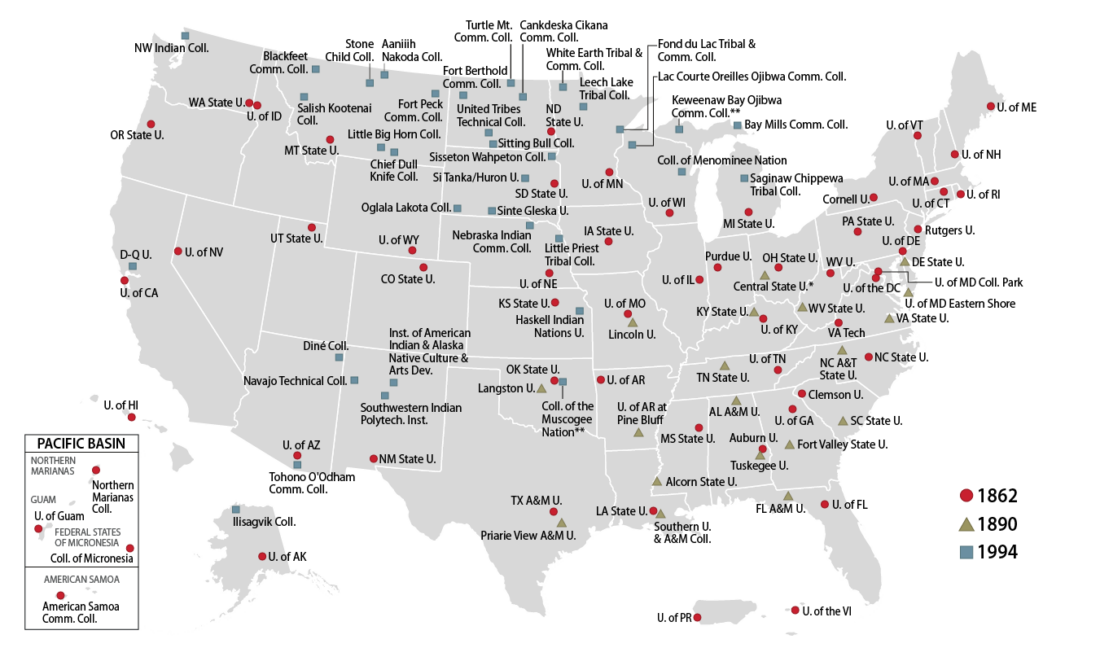
Arizona’s other main water source, the Colorado River, has also been in the news lately for its record low levels and the ongoing battle for usage rights between the lower Colorado Basin states: Arizona, California, and Nevada. The original allotments overestimated supply, based on projections made during a period of extremely high flow, and resulted in problems when the water level dropped. Earlier this summer, the states reached an agreement about how the water will be distributed going forward in light of the historic megadrought and expected effects of climate change. Aside from these states, however, there is also the matter of Native American tribal water rights—in this case, those of the Navajo Nation, which spans parts of Arizona, New Mexico, and Utah. There has been a long legal battle to secure water for the struggling area, based on the 1868 treaty, which created the reservation with the promise of a “permanent home.” Unfortunately, last month the Supreme Court ruled against the tribe, denying that the US has obligations to provide reliable water sources on reservations.
Agriculture and Virtual Water
The 1980 law that governs water usage in Arizona’s cities is unhelpful when it comes to the resource’s use in other situations. Arizona has an enormous agricultural industry, and there are very few regulations on water use for farming. According to CNN, “In around 80% of the state, Arizona has no laws overseeing how much water corporate megafarms are using, nor is there any way for the state to track it.” In other words, there are virtually no protocols or procedures in place for the state to establish oversight, much less control.
Oddly, many of the crops grown in Arizona are especially thirsty and ill-fitting for a drought-ridden area. Micha has mentioned the concept of virtual water—the amount of water needed to grow a specific thing. That thing could be a single strawberry or almond, whose water intake is easy to track, or it could be something more complicated, like beef. In this instance, you must first calculate not only how much the cow drinks but also aspects such as how much water goes into growing its food (which is often grown elsewhere). The argument is that exporting produce that was grown with a lot of water in a water-insecure area amounts to the theft of critical natural resources. One of the most prominent crops grown in Arizona (and other places like California) is alfalfa, a type of hay that is used precisely for feeding cows and other livestock. It is a lucrative crop but it also requires an immense amount of water. This is an especially sensitive subject because much of the crop is grown by foreign companies who export it to feed livestock in other countries. Ironically, one of the biggest farm corporations is from Saudi Arabia; it moved to the US because its own country outlawed the growth of such crops in its arid lands. This summer, Arizona officials have started to crack down on these foreign companies by restricting well permits. Additionally, towns and regions across Arizona are debating new regulations on agricultural water practices, including among people who have traditionally balked at governmental oversight.
Arizona’s governor, Katie Hobbs, also introduced a 100-year study of Phoenix’s groundwater. Additionally:
Governor Hobbs announced a $40 million investment of American Rescue Plan Act funds to spur increased water conservation, fund critical water infrastructure, and promote sustainable groundwater management throughout the State. The Arizona Water Resiliency Fund will be administered by the Arizona Department of Water Resources to facilitate sustainable groundwater management through grants and financial support for pressing water resiliency efforts.
This is a continuing conversation that involves both government officials and community leaders/activists. On the latter side, there is a podcast called Thirst Gap, which addresses how people in the Southwest are coping with a decreasing water supply.
Resilience
Clearly, the high-paced growth of Arizona cities—while alarming—does not show the full picture of Arizona’s water woes. Nor does the number of people moving here (especially to Phoenix) seem to be slowing. There are, however, a few steps that can be taken to make growth more sustainable in the desert. Part of that comes back to neighborhood planning and communication of services. Last week, Micha pointed out the precariousness of heat safety here, and what would happen in the event of a power outage. Several organizations—both governmental and nonprofit—have produced guides with strategies for creating resilient cities and neighborhoods. One such guide describes the issue at hand:
Resiliency is a critical characteristic that allows healthy communities to respond to unknown future changes. Social, economic, political, and environmental changes occur frequently in communities and an ability to adapt to these changes is essential to maintain community health.
The guides pay special attention to the dangers of the deadly Arizona heat and how to mitigate and adapt to potential disasters. These measures include public cooling centers, resilience hubs, identification of especially vulnerable groups, community outreach, and the creation of urban forests/green spaces.
I do not know to what extent these measures will have an immediate or lasting effect on water usage/conservation in the state. I’m not convinced that those who are part of the massive population influx are aware of or willing to help confront the problems but there are plenty of groups of local Arizonans that are making a demonstrable difference. I will list several of these below in case you want to know more.
Resources
Dunbar/Spring Neighborhood Foresters
The Guardian: Dunbar/Spring urban food forest
Phoenix regenerative agriculture
Physicians for Social Responsibility Arizona: Building Resilient Neighborhoods (BRN) Citizens’ Guide
Planning.org: Urban Heat Resilience
Rainwater Harvesting for Drylands and Beyond by Brad Lancaster
The Urban Farm in Phoenix
US Department of Agriculture: Southwest Watershed Research Center in Tucson
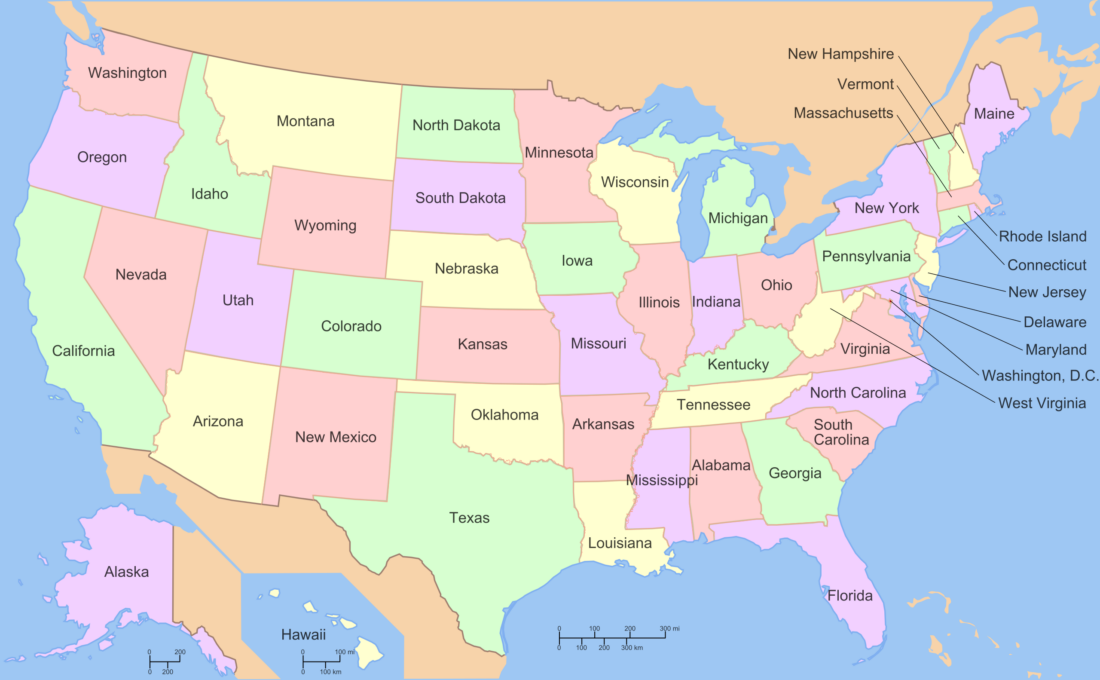


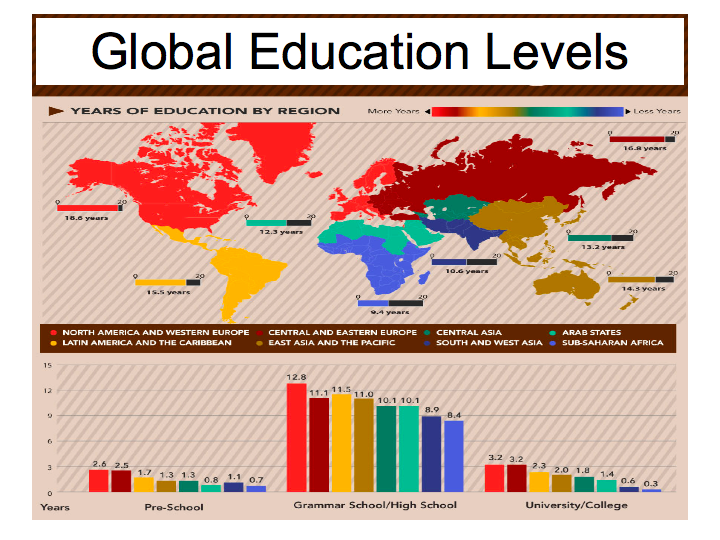 Figure 1 (Source: UNESCO Institute of Statistics via

 The picture above was taken from my favorite T-shirt, which features my favorite quote. It is also the main reason that I chose an academic career: to get a license to experiment. When I wear the shirt, it often triggers mixed responses despite Einstein’s name on the bottom. Often, people argue that there is a world of difference between not knowing what we are doing and investigating the unknown. From my perspective, regardless of interpretation, the quote strongly encourages experimentation with full knowledge that there is a high probability that most of the experiments will fail.