The Price of the Green Shift

I started this series of blogs about energy companies and their shift toward greener power sources with a citation from an earlier blog (July 17, 2013), quoting then-CEO of ExxonMobil, Rex Tillerson, who opined, “What good is it to save the planet if humanity suffers?” His statement equated a more limited use of fossil fuels with inherent suffering.

While I didn’t state it explicitly, I have hinted strongly that the destruction of the planet would lead to infinitely more suffering than would the impact of limiting our use of fossil fuels. My last two blogs have provided some evidence that—directly or indirectly, mostly due to external pressure—many energy companies are starting to realize the validity of this argument. However, there is no escaping the conclusion that if limiting the supply of fossil fuels does limit the availability of energy overall, humanity will suffer.

Energy is probably the most important ingredient in the supply chain for almost everything that society does. Recently, we have encountered some of the symptoms of limited energy supply on a global scale:

UK electricity prices have hit record highs to become the most expensive in Europe, with “day-ahead” power prices (the price of spot electricity) hitting £540 per megawatt hour (MWh) on Monday. UK prices are at their highest since 2008, says Cornwall Insight, an energy-market analyst.

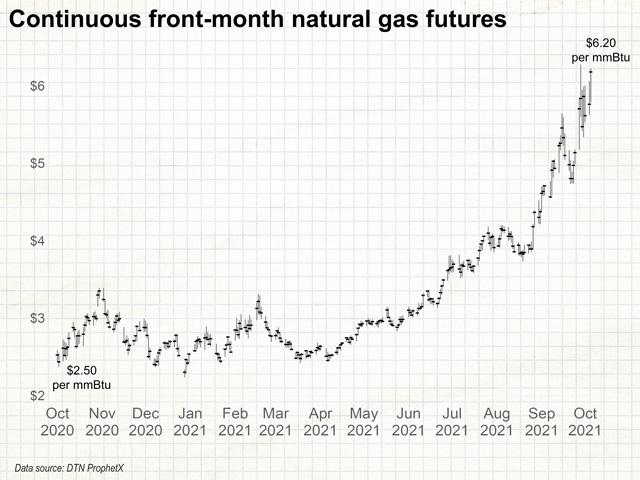
Gas prices quoted in therms (a unit of heat) are trading at £1.89, doubling in as little as two months, and five times higher than September last year. In a taste of what is to come if energy prices keep rising, two fertiliser plants in the north of England have been shuttered because they have become too expensive to run. The operator, CF Industries Holdings, did not say when production would resume. And the rise in energy prices has stoked fears that we may be in for a very cold and expensive winter. So why are prices rocketing and what might it mean for investors?

Wholesale European electricity prices have shot up, too, and natural gas futures in the Netherlands have raced past €60/megawatt hour to hit a record high this week. Dutch gas prices have risen by around 450% over the year, and French and German wholesale electricity prices are also trading at record highs. To add to the problem, gas stockpiles are at their lowest in ten years.

These shortages are not limited to England or Europe; they are worldwide. China, too, is now suffering from an acute lack of supply and its energy prices are shooting up. Unsurprisingly the instabilities in the energy markets are causing smaller companies to default:

At least four of the smaller UK energy companies are expected to go bust next week amid soaring wholesale gas prices. Industry sources have told the BBC that four firms have asked larger players to bid to take over the supply to one million customers.

The price rise has left some companies unable to provide their customers with the energy they have paid for.

Industry rules mean supplies will continue for affected customers, and they will not lose money owed to them. The new company is also responsible for taking on any credit balances the customer may have. But paying that credit out to customers is a further disincentive for companies to take on new business.

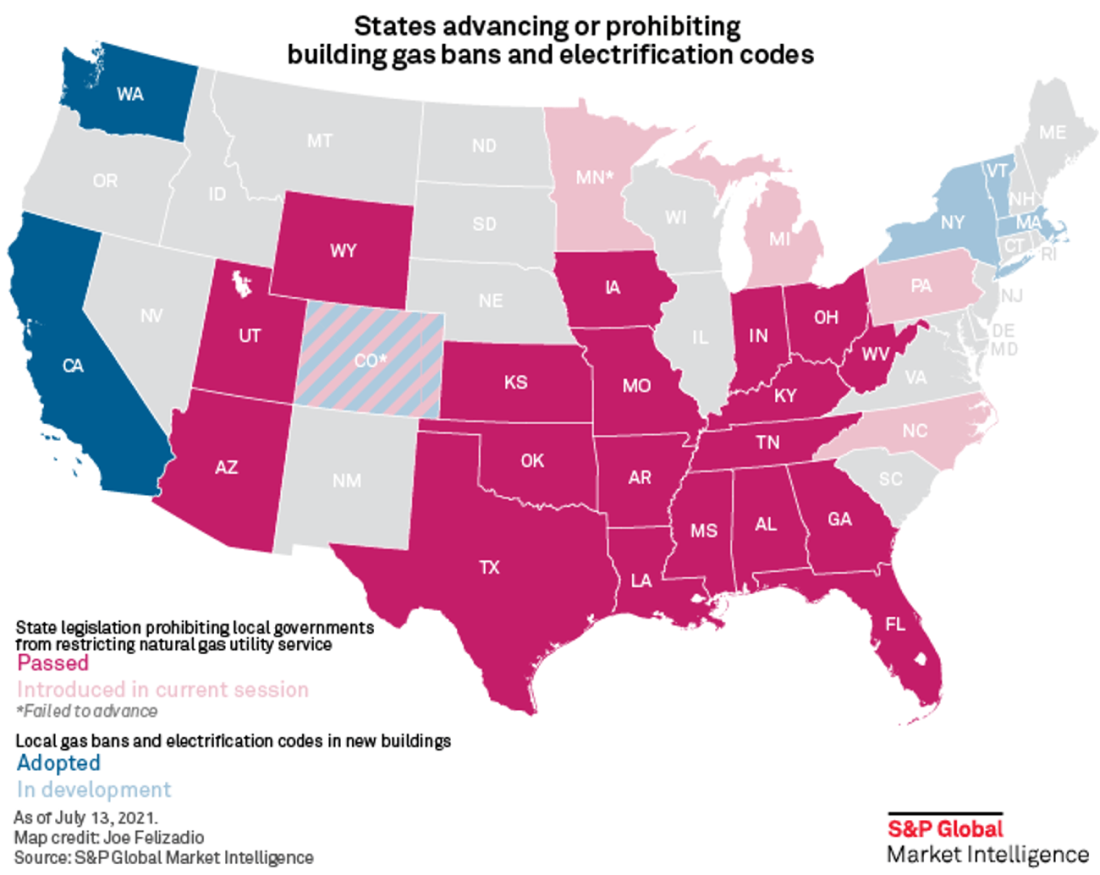
The US state of Wyoming provides an especially powerful example of the strain of maintaining energy supply while shifting to greener power sources. Wyoming legislators are so terrified of the prospect of losing both fossil fuel jobs and energy supply that they are requiring the companies offloading such plants to offer them up for sale rather than let them go fallow:

Wyoming has been the US’s top coal producer since 1986. But while the state stubbornly clings to the fossil fuel, its largest utility is dumping coal in favor of renewables.

PacifiCorp is ditching coal in Wyoming

Rocky Mountain Power is Wyoming’s largest electric utility, and its parent company, PacifiCorp, announced on Friday, according to KPVI, that its biennial Integrated Resource Plan is expected to “include substantial investment in renewables — and no new investment in coal or natural gas. The 2021 plan will be finalized next week.”

In response, Wyoming legislators tried to stop utilities from shutting coal plants by passing a bill that went into effect last month. Oil City News explained in March 2020:

Wyoming Governor Mark Gordon [R-WY] signed Senate File 21 into law on Tuesday, March 10. That bill will require electric public utilities to “first make a good faith effort” to sell coal-fired electric generation facilities before retiring such facilities.

The rules will go into effect July 1, 2021, and will allow non-utilities to purchase otherwise retiring coal fired power plants and sell energy to industrial customers.

Forbes, one of the most conservative publications in the US, does a great job at summarizing the energy industry’s predicament:

This week has produced a spectacular batch of news stories highlighting the many contradictions facing us as we embark on the greatest technological transition in our history: abandoning fossil fuels.

Shell, one of the world’s largest oil companies, has been forced by a Dutch court to cut its emissions much faster than originally planned: 45% by 2030, with the court arguing that the company’s decarbonization targets were incompatible with the Paris Agreement.

The news, which could (and should) trigger a wave of similar cases around the world, coincides with increased pressure on the boards of two other of the world’s largest oil companies, America’s Exxon and Chevron, some of whose shareholders are demanding faster responses to the climate emergency, rather than merely greenwashing.

The oil industry will find it increasingly difficult to ignore social pressure to reduce its emissions. We are facing a fundamental change, the end of the oil era, which could lead to a financial meltdown among the companies dedicated to exploiting a resource that is still far from being exhausted, but which is becoming increasingly uneconomical to exploit. Over the course of the next thirty years, 80% of the oil industry is set to disappear.

The combination of technologies that involved the exploitation of fossil fuels and the internal combustion engine brought enormous economic progress to mankind over many decades, but we now know at what cost. Abandoning the use of fossil fuels, and leaving behind an industry that we have long subsidized and financed to prevent the economy from grinding to a halt, is absolutely essential, however impossible it may seem today, because the real cost of these fossil fuels is actually much, much higher.

It is possible, and also essential, to make this transition: the world should be powered exclusively by renewable energies by 2030. They have long been the cheapest option, despite the self-serving myths spread by the oil industry and its lobby, and they could well be enough to cover all our needs.

It is time to put an end to the contradictions.

Does all of this mean the end of oil? My next blog will argue that the truth may be more complicated and may require all of us to get involved.

Posted in Climate Change, Energy | Tagged , , , , , , , , , , , , , , , , , , , , , , , , , , , , , | 2 Comments

Energy Companies Shifting Greener

What does it mean for oil companies to shift toward being “greener”? How can we measure that change? More than 8 years ago, I talked about how we can use the amount of unextracted fuels as a marker for this shift (July 17, 2013 blog):

The Security and Exchange Commission (SEC) made an administrative decision to categorize untapped oil reserves as part of the capital value of a company, for accounting purposes; this decision can be reversed through an administrative order. In reality, these reserves are no more capital than would be the “good ideas” of the company’s staff scientists. They contribute to the capitalization process through good name, track records, etc., but do not add to the explicit pricing or marketability of the good idea. If the accounting rules were changed, so as to remove those reserves from the capitalization appraisal, the company would still retain the ownership and exploration rights of the real-estate in which the reserves are buried, but the reserves would only factor into the capitalization when they were ready to be marketed. The assessment of the value of this real estate would, instead, follow the same objective procedures that other commercial real estate properties enjoy.  Once we put a “cap” on extraction, if the market were to exceed this “cap,” the price of the real estate would rise, thus benefiting the company, and rendering moot the need to use its resources to oppose the “cap.” This is an example of a situation where a change in the status quo could potentially benefit almost all parties.

Essentially, oil companies claim the value of oil on their land, even if it hasn’t been extracted. If you limited how much they could extract in the future, it would have major effects on their valuing system.

I haven’t heard anything further about that particular strategy since that time but an alternative approach might be to check their expansion capability by limiting exploration for new reserves.

As it stands, it does not seem like either has been acted upon. Figure 1 shows that oil companies have only cut back on their exploration efforts when the price of oil has fallen, making the ventures less economically feasible. In other words, it’s not because they’ve had a major change in philosophy.

crude oil price vs exploration expenditureFigure 1 Price of oil vs. new exploration and development

An alternative way to shift toward sustainability is to do what a German utility did at the end of 2014 (see my December 9, 2014 blog). Below is a citation from an article in The Economist that I used in that blog:

For many Germans, E.ON, the country’s biggest utility, is a symbol of stability. But on November 30th it surprised by announcing it would split itself up. In 2016 it will float a new company which will include its power generation from nuclear and fossil fuels, as well as fossil-fuel exploration and production. The rump—which will keep the E.ON brand—will make money from renewable energy, distribution and ‘customer solutions’, a grab-bag of offerings such as advice, smart-metering and the like. The firm’s boss, Johannes Teyssen, said that as a sprawling integrated utility E.ON could only be ‘mediocre’. Two focused ones would do a much better job.

That kind of change in business model is a bet that staying in the energy field but moving to sustainable energy sources will be so financially rewarding in the long-term that it is worth rebranding their current company now.

More recently, Royal Dutch Shell sold off its holdings in the Permian Basin in Texas and New Mexico:

Houston — Royal Dutch Shell sold its oil and gas production in the Permian Basin, the biggest American oil field, to ConocoPhillips for $9.5 billion in cash on Monday.

The deal marks a turning point for Shell, which had put considerable effort into developing the 225,000-acre field since buying it from Chesapeake Energy nine years ago, expanding its production to about 200,000 barrels a day.

The sale is the latest sign that Shell, like other European oil companies, is under pressure to sell off oil and gas production and move toward producing cleaner energy in response to growing concerns about climate change among investors and the general public.

I don’t know yet who the buyers are and we can only speculate about what Royal Dutch Shell will do with the $9.5 billion they got from the sale but they seem to be acting based on the external motivators I discussed last week.

Perhaps, the only really productive scenario would be if oil companies developed the technology to not only efficiently capture the carbon dioxide produced by burning fossil fuels but also repurpose that carbon dioxide for something useful. This would allow them to extract and sell fossil fuels to supply societal energy needs but create a much smaller carbon footprint. Several companies are now working hard to convince the government to finance such a system:

Over the last year, energy companies, electrical utilities and other industrial sectors have been quietly pushing through a suite of policies to support a technology that stands to yield tens of billions of dollars for corporate polluters, but may do little to reduce greenhouse gas emissions.

Some environmentalists say that is exactly what is happening. They argue that the money being appropriated by Congress is likely to allow polluting power plants and petrochemical facilities to continue operating longer into the future, while doing little to reduce the nation’s emissions. They also say that, even if the technology is able to cut carbon pollution from petrochemical plants or refineries, it won’t address other toxic chemicals those operations send into communities that are home to many people of color. Electrifying industry and reducing the use of plastics and petrochemicals, these advocates argue, would be far cheaper and safer.

The most powerful forces pushing for carbon capture have been fossil fuel companies, which have promoted CCS for decades but have increased their lobbying and marketing for the technology in recent years as they have fallen under increased pressure to address climate change.

Carbon Capture and Storage (CCS) has operated on this planet for more than three billion years, in various forms of the photosynthetic process. Without our recent anthropogenic contributions, emissions, as reflected in the carbon cycle (see my March 25, 2014 blog) would balance with absorption, to reach an equilibrium. This worked until the beginning of the last century. We are now shifting the balance, and with it, triggering climate change. If oil companies could actually accomplish more efficient/effective CCS, it would be great but, as the article above points out, it would not be the whole solution.

As I have discussed in earlier blogs, perhaps the most popular (and easiest) method of enhancing carbon capture is planting more trees; it has become a common part of many commitments to shift to zero-carbon technology. It’s also a very important task. As much as (live) trees are known for their remarkable carbon capture, recently, some have argued that dying trees contribute more carbon dioxide than the burning of fossil fuels.

An alternative (or supplementary) activity is to chemically synthesize new fossil fuels by reacting the already emitted carbon dioxide with “green” hydrogen. For example, a team of researchers is attempting to synthesize methane (the main component of natural gas) from CO2 and renewable hydrogen.

Meanwhile, Iceland is taking big steps in direct air capture of its carbon.

In the next blog, I will try to explore some of the ways society may respond to the consequences if energy companies keeping their commitments and move toward renewables on the way to a carbon-zero society.

Posted in Climate Change, Energy | Tagged , , , , , , , , , , , , , , , , , , , , , , , , , | 2 Comments

External Pressures on Oil Companies May Prompt Change. We’ll See.

green energy, oil, fossil fuels, energy transition

I posted my first blog here on Earth Day, April 22, 2012. I’m now approaching 500 (498) blog posts. Almost all of them, directly or indirectly, have focused on climate change and the energy transition that we are necessarily going through. Oil companies are key players in this transition. If you type “oil companies” into the search box of the blog, you will get 45 entries. From the beginning, oil companies have been leaders in denying both that climate change is an issue that society needs to solve and that such a solution might require an energy transition away from fossil fuels. In an early blog (July 17, 2013), I wrote the following:

The last series of blogs have focused, among other things, on the quote from ExxonMobil CEO, Rex Tillerson, who reputedly said, “What good is it to save the planet if humanity suffers?” – equating inherent “suffering” with a more limited use of fossil fuels. What he actually means by this is that setting a “cap” of usage at below the total quantity of “proven reserves” that still lay untapped would mean a major reduction in the capitalization rates of ExxonMobil and other oil companies (which would, in turn, require realignment of the stock prices). So, from this perspective, the introduction of a “cap” would mean major confiscation of capital from the stock holders – an action that is viewed by many as un-American.

Following such logic, Exxon, and most other oil companies, have fought tooth and nail—whether directly or through shady proxies such as the Heartland Institute—to retain societal and financial support for fossil fuels. I have covered this as well; a search for either “deniers” or “Heartland Institute” will yield 12 entries here. There are many great books that discuss the role that oil companies have played in mobilizing and funding public opinion against climate change mitigation (These include Merchants of Doubt by Naomi Oreskes and Eric M. Conway and The New Climate War by Michael E. Mann).

But attitudes are now starting to change. It’s becoming increasingly difficult to maintain the position that climate change is not a problem in the face of the highly visible, devastating impacts of climate change-driven extreme weather, including massive fires and droughts in the western US, intense, high-frequency hurricanes in the south, and similarly destructive events around the world. Oil companies want to capitalize on this shifting attitude by making the impression that they care about the environment. But fossil fuels are the lifeblood of these companies; almost per definition, they cannot exist if the planet turns toward green and sustainable energy sources.

These shifts are not taking place because the people who run the companies are finding the error of their ways. I am writing this blog a day after Yom Kippur— the “Day of Atonement”—in the Jewish religion. However, I would not imagine most of the managers and directors of the oil companies are motivated by remorse. Instead, their shifts come as a response to outside pressure. Below are a few recent examples of these external motivators:

The Netherlands:

May 26 (Reuters) – A Dutch court ordered Royal Dutch Shell to drastically deepen planned greenhouse gas emission cuts on Wednesday, in a landmark ruling that could trigger legal action against energy companies around the world.

Shell said it was “disappointed” and plans to appeal the ruling, which comes amid rising pressure on energy companies from investors, activists and governments to shift away from fossil fuels and rapidly ramp up investment in renewables.

Judge Larisa Alwin read out a ruling at a court room in The Hague, ordering Shell (RDSa.L) to reduce its planet warming carbon emissions by 45% by 2030 from 2019 levels.

Norway:

Norway goes to the polls on Monday [September 13th] in parliamentary elections that are forcing western Europe’s largest oil and gas producer to confront its environmental contradictions.

Climate issues have dominated the campaigning since August, when the UN’s Intergovernmental Panel on Climate Change published its starkest warning yet that global heating is dangerously close to spiraling out of control.

The report gave an instant boost to parties calling for curbs on drilling: the country’s Green party – which wants an immediate halt to oil and gas exploration, and no further production at all after 2035 – saw membership surge by nearly a third.

Another look at Norway, after elections:

Voters in Norway ousted their conservative prime minister on Monday, turning instead to a center-left leader following an election campaign dominated by climate change, and the growing contradictions between the country’s environmental aspirations and its dependence on its vast oil and gas reserves.

The vote came at the end of a tumultuous summer in Europe, marked by scorching temperatures and flooding in many countries. Once a distant prospect for many Norwegians, global warming became a more tangible reality that all political parties in the wealthy Nordic nation of 5.3 million could no longer ignore.

This could be a promising political shift for a country that has long led the world in oil and gas production. We’ll see if there is a corresponding change in policy.

Exxon:

On the day the little investment firm Engine No. 1 would learn the outcome of its proxy battle at Exxon Mobil, its office in San Francisco still didn’t have furniture. Almost everyone had been working at home since the firm was started in spring 2020, so when the founder, Chris James, went into the office for a rare visit on May 26 this year to watch the results during Exxon Mobil’s annual shareholder meeting, he propped his computer up on a rented desk. As an activist investor, he had bought millions of dollars’ worth of shares in Exxon Mobil to put forward four nominees to the board. His candidates needed to finish in the top 12 of the 16 up for election, and he was nervous. Since December, James and the firm’s head of active engagement, Charlie Penner, had been making their case that America’s most iconic oil company needed new directors to help it thrive in an era of mounting climate urgency. In response, Exxon Mobil expanded its board to 12 directors from 10 and announced a $3 billion investment in a new initiative it called Low Carbon Solutions. James paced around the empty office and texted Penner: “I was doing bed karate this morning thinking about how promises made at gunpoint are rarely kept. Exxon only makes promises at gunpoint.”

As I said, these are changes that are being made due to external motivations (e.g., financial or political). I’m not sure to what extent oil companies will follow through with their new commitments.

US Congress on Accountability:

The House Oversight Committee has widened its inquiry into the oil and gas industry’s role in spreading disinformation about the role of fossil fuels in causing global warming, calling on top executives from Exxon Mobil, Chevron, BP and Royal Dutch Shell, as well as the lobby groups American Petroleum Institute and the United States Chamber of Commerce, to testify before Congress next month.

It’s great to see these changes happening around the world but energy is still at the bottom of the food chain, meaning that everything else depends on it. My next two blogs will try to explore how energy companies are actually implementing the green shift and/or if there is any backlash against the day-to-day consequences of the shift.

Posted in Climate Change, Energy, Extreme Weather, politics, Sustainability | Tagged , , , , , , , , , , , , , , , , , , , , , , , , , , , , | 1 Comment

Wet and Dry Global Divide

Last week’s blog was “inspired” by hurricane Ida and the damage that it wreaked on Louisiana, the rest of the Gulf Coast, and the northeastern US. I promised that I would expand on the theme of climate change-related extreme weather, including simultaneous floods and droughts around the world. Having discussed flooding, I’m moving on to the opposite side of the spectrum here.

The EPA’s (Environmental Protection Agency) kids’ site provides a relatively simple correlation between extreme dryness and climate change:

As temperatures rise and the air becomes warmer, more moisture evaporates from land and water into the atmosphere. More moisture in the air generally means we can expect more rain and snow (called precipitation) and more heavy downpours. But this extra precipitation is not spread evenly around the globe, and some places might actually get less precipitation than they used to get. That’s because climate change causes shifts in air and ocean currents, which can change weather patterns.

There is a more quantitative “adult” description in an article in Nature that includes the figure below. This is the paper’s abstract:

The “dry gets drier, wet gets wetter” (DGDWGW) paradigm is widely accepted in global moisture change. However, Greve et al.1 have declared that this paradigm has been overestimated. This controversy leaves a large gap in the understanding of the evolution of water-related processes. Here, we examine the global moisture trends using satellite soil moisture for the past 35 years (1979–2013). Our results support those of Greve et al., although there are quantitative differences. Generally, approximately 30% of global land has experienced robust moisture trends (22.16% have become drier and 7.14% have become wetter). Only 15.12% of the land areas have followed the DGDWGW paradigm, whereas 7.77% have experienced the opposite trend. A new finding is that there is a significant “drier in dry, wetter in wet” (DIDWIW) trend paradigm; 52.69% of the drying trend occurred in arid regions and 48.34% of the wetter trend occurred in the humid regions. Overall, 51.63% of the trends followed the DIDWIW paradigm and 26.93% followed the opposite trend. We also identified the DGDWGW and DIDWIW paradigms in low precipitation-induced arid regions in which the dry soil led to an increasing sensible heat flux and temperature and subsequently potential evapotranspiration.

moisture, precipitation, drought, flood, soil

I will skip any discussion about the subtle differences between DGDWGW and DIDWIW. In the meantime, we can immediately notice from Figure 1 that the wet-dry distribution across the US, approximately coincides with the US map shown in last week’s blog. Below, I’m including some news coverage of a few of these dry regions around the world, focusing especially on the effects on food supply. I chose three examples: one from California, one from Argentina, and one from Madagascar. All three have faced repeated, long-term difficulties with food production. That has led to many climate migrants: despairing people searching more productive locations—whether inside or outside their native countries.

California Central Valley:

The impacts of California’s deepening drought hit home for Central Valley farmers earlier this week, when federal officials announced they didn’t have enough water to supply many of their agricultural customers. Urban users south of San Francisco in Santa Clara County saw their normal water deliveries cut in half.

The Colorado River:

Lake Mead, a reservoir formed by the construction of the Hoover Dam in the 1930s, is one of the most important pieces of infrastructure on the Colorado River, supplying fresh water to Nevada, California, Arizona, and Mexico. The reservoir hasn’t been full since 1983. In 2000, it began a steady decline caused by epochal drought. On my visit in 2015, the lake was just about 40 percent full. A chalky ring on the surrounding cliffs marked where the waterline once reached, like the residue on an empty bathtub. The tunnel far below represented Nevada’s latest salvo in a simmering water war: the construction of a $1.4 billion drainage hole to ensure that if the lake ever ran dry, Las Vegas could get the very last drop.

The Paraná River:

ROSARIO, Argentina — The fisherman woke up early on a recent morning, banged on the fuel containers on his small boat to make sure he had enough for the day, and set out on the Paraná River, fishing net in hand.

The outing was a waste of time. The river, an economic lifeline in South America, has shrunk significantly amid a severe drought, and the effects are damaging lives and livelihoods along its banks and well beyond.

“I didn’t catch a single fish,” said the 68-year-old fisherman, Juan Carlos Garate, pointing to patches of grass sprouting where there used to be water. “Everything is dry.”

Madagascar:

Droughts in Grand Sud, Madagascar, have sharply increased in both frequency and intensity in recent years. Bearing the full brunt of the effects of climate change, families who live in this region have seen drastic impacts on their livelihoods and health.

In 2020, there were virtually no rains. Historically low rainfall levels depleted the few sources of clean water that existed in this chronically dry region. As a result, water-borne illnesses such as diarrhea have increased sharply. And, without rain, there could be no harvests. Food insecurity and malnutrition rose.

“What little I produced in the past has been completely consumed. I don’t know the dates, but it’s been a long time since I had a harvest,” says Maliha, 38, a single mother of eight children. “Since the rain stopped, the children are not eating regularly. I give them whatever I can find, like cactus leaves. With this diet, they have diarrhea and nausea, but we have no choice. At least it doesn’t kill them.”

Many families struggled to survive 2020 and hoped for a better year in 2021. Sadly, the rains have not yet come.

Globally, agriculture uses about 70% of all fresh water. Climate change causes weather patterns to shift but you can’t just move agricultural fields. Nor is moving the people that make their livelihood from them a trivial matter. Often, people leave the drying fields behind and try to move to places with better prospects. The result is a massive increase in environmental refugees, thousands of acres of fallow land, and a drastic decrease in food availability for people that can ill afford it.

Posted in Climate Change, Extreme Weather, immigration, refugee, Water | Tagged , , , , , , , , , , , , , , , , , , , | 2 Comments

Where Should We Go When Disaster Strikes?

When I started writing this blog on Wednesday morning, we were just beginning to see Hurricane Ida’s effects as it climbed through the Northeast, scheduled to pass through my home city, NYC. Two seemingly unrelated pieces in that day’s NYT caught my attention: one was about the aftermath of Ida in New Orleans and the other was an opinion piece related to climate change. Both pieces spoke about environmental migrations and the US’s (in)ability to handle extreme weather events.

We can see climate change’s mark on Hurricane Ida by way of the “rapid intensification” process, where a low-rank storm passes through hot water, which rapidly accelerates it into a much more intense storm. The warming of the sea and the lower atmosphere (the troposphere) also results in a major increase in atmospheric water vapor, which leads to extreme rainfall and floods. Energized by the Gulf of Mexico’s very warm water, on Sunday, in just a few hours, Ida went from a category 1 hurricane off the coast to a category 4 major storm as it touched land in southern Louisiana. New Orleans, and other southern Louisiana residents, were strongly advised to leave town and head north. A mandatory evacuation was not issued in most places for the simple reason that there was no time to enforce one.

Understandably, the storm drew many comparisons with 2005’s Hurricane Katrina, which hit New Orleans and killed 1,800 people, as well as causing an estimated $125 billion in damages. Following Katrina, the Army Corps of Engineers spent around $15 billion to upgrade New Orleans’ levee system, with the hope of preventing repeat vulnerability. Hurricane Ida was the first real test of this upgraded system. By Wednesday, it was clear that the upgraded system had successfully withstood the challenge and prevented Katrina-scale flooding in the area. However, major flooding is not the only infrastructural damage that a category 4 hurricane can inflict; the electric grid system in the area became a total wreck and more than a million people were cut off from power. Meanwhile, water treatment facilities also took heavy damage, leading to a serious shortage of safe drinking and washing water. Furthermore, state-wide and New Orleans-based officials strongly advised Louisianans who had evacuated before the storm not to return to their homes until further notice—creating, in an instant, thousands of temporary environmental refugees.

The NYT opinion piece from the same day, “When Climate Change Comes to Your Doorstep,” gives a sense of the national climate crisis:

We are now at the dawn of America’s Great Climate Migration Era. For now, it is piecemeal, and moves are often temporary. Brutalized by hurricanes, flooding and a winter storm, Lake Charles, La., residents have been living with relatives for months. In early August, the Dixie fire — the largest single fire in recorded California history — claimed at least one entire town, and locals took to living in tents. Apartment dwellers in Lynn Haven, Fla., were forced from their homes to slosh through streets flooded by Tropical Storm Fred. The evacuee tally has continued to rise, from New Englanders in the path of Hurricane Henri to flood survivors in North Carolina and Tennessee to people escaping fire in Montana and Minnesota.

But permanent relocations, by individuals and eventually whole communities, are increasingly becoming unavoidable.

The op-ed also describes real estate company’s efforts to estimate climate change vulnerability by zip code. It quotes statistics that 1.7 million disaster-related displacements were recorded in 2020.

On Wednesday evening, Ida hit NYC in full. By Thursday morning, it became obvious that NYC and the rest of the Northeast were totally unprepared. Although the storm as a whole was considerably downgraded by the time it reached us, we still faced intense flooding. In fact, the number of fatalities here exceeded those from the Gulf of Mexico. Many of these victims in NYC drowned in small, windowless basement apartments as flooding reached the ceiling.

An article in the NYT from two weeks ago featured the map below of two Americas: one dry and the other wet. Climate change triggers and amplifies both of these extremes. Both uproot thousands of people, creating scores of environmental refugees.

wet, dry, flood, drought, extreme weather

Figure 1 – Map of two Americas: the dry (brown) and the wet (green)

This blog focused on the wet part of the country. However, I ended last week’s blog citing an article about the unsustainable situations in Phoenix, Arizona, and Las Vegas, Nevada. These cities are located squarely in the dry part of the country, with summer temperatures this year setting three-digit records. Yet, the last census indicates that people are flocking there. In fact, Phoenix has become the fifth most populated city in the US.

This phenomenon of climate change-driven extreme weather—both wet and dry—has dire consequences. Nor is it confined to the US. Next week I will try to cover the issue abroad.

Posted in Climate Change, Extreme Weather, US | Tagged , , , , , , , , , , , , , , , , , , , , , , , | 2 Comments

Calculating the Social Cost of Carbon: What Are We Already Spending?

Last week, I reintroduced the concept of the social cost of carbon and explored a recent University of Chicago working paper (WP). The WP delved into President Biden’s attempts to reframe the conversation about the economic impact of climate change, steering away from the Trump administration’s assessments and policies. Back in 2019, in a blog called, “Pay Now or Pay Later” (December 17, 2019), I looked at a set of economic projections during President Trump’s tenure.

Last week’s post presented a graphic comparison of the social cost of carbon between  President Trump’s administration’s calculations and those of the WP. I also included the graphic that laid out the WP’s major recommendations. In addition, I posted the abstract from the WP that summarized the two most critical recommended actions: changing the discount rate back to 2% (from as high as 7%) and updating the previous social cost of carbon calculations.

The figure below gives a general outline of the updated social cost of carbon. The WP provides details and supporting literature for each element of the calculation.

social cost of carbon, carbon, cost, scc, economics, equity, uncertainty, damages, climate change, discounting

Seven ingredients for calculating the Social Cost of Carbon. This figure displays the four “modules” that compose the SCC (colored boxes), and the three key modeling decisions (grey ovals) that together form the seven “ingredients” necessary to compute an SCC.

Unsurprisingly, the change in the discount rate, the last element of the calculation, makes up a significant portion of the document. I have emphasized some of the points I find most relevant:

The final step in the SCC calculation is to express this stream of damages as a single present value, so that future costs and benefits can be directly compared to costs and benefits of actions taken today. Discounting is the process by which each year’s future values are reduced to enable comparison with current costs or benefits to society. The “discount rate” determines the magnitude of this reduction. Because CO2 emissions persist in the atmosphere and lead to long-lasting climatological shifts, small differences in the choice of discount rate can compound over time and lead to meaningful differences in the SCC. There are two reasons for “discounting the future,” or more precisely for discounting future monetary amounts, whether benefits or costs. The first is that an additional dollar is worth more to a poor person than a wealthy one, which is referred to in technical terms as the declining marginal value of consumption. The relevance for the SCC is that damages from climate change that occur in the future will matter less to society than those that occur today, because societies will be wealthier. The second, which is debated more vigorously, is the pure rate of time preference: people value the future less than the present, regardless of income levels. While individuals may undervalue the future because of the possibility that they will no longer be alive, it is unclear how to apply such logic to society as a whole facing centuries of climate change. Perhaps the most compelling explanation for a nonzero pure rate of time preference is the possibility of a disaster (e.g., asteroids or nuclear war) that wipes out the population at some point in the future, thus removing the value of any events that happen afterwards. The government regularly has to make judgments about the discount rate when trading off the costs and benefits of a regulation or project that will endure for multiple years. In general, U.S. government agencies have relied on the Office of Management and Budget’s (OMB’s) guidance to federal agencies on the development of regulatory analysis in Circular A-4, and used 3 percent and 7 percent discount rates in cost-benefit analysis. 61 These two values are justified based on observed market rates of return, which can be used to infer the discount rate for the SCC since any expenditures incurred today to mitigate CO2 emissions must be financed just like any other investment. The 3 percent discount rate is a proxy for the real, after-tax riskless interest rate associated with U.S. government bonds and the 7 percent rate is intended to reflect real equity returns like those in the stock market. However, climate change involves intergenerational tradeoffs, raising difficult scientific, philosophical and legal questions regarding equity across long periods of time. There is no scientific consensus about the correct approach to discounting for the SCC.

The social cost of carbon is explicitly meant to account for future costs but meanwhile, we are seeing significant economic impacts of climate change right now:

Extreme Weather

“U.S. Disaster Costs Doubled in 2020, Reflecting Costs of Climate Change”

Hurricanes, wildfires and other disasters across the United States caused $95 billion in damage last year, according to new data, almost double the amount in 2019 and the third-highest losses since 2010.

Supply-Chain Disruptions

“Climate change will disrupt supply chains much more than Covid — here’s how businesses can prepare”

The onset of the coronavirus pandemic caused unprecedented, worldwide supply-chain disruptions, but experts say that’s a drop in the bucket compared with the disruptions that climate change will cause.

Wildfires in the American West, flooding in China and Europe and drought in South America are already disrupting supplies of everything from lumber to chocolate to sushi rice.

Insurance

“Climate Threats Could Mean Big Jumps in Insurance Costs This Year”

The National Flood Insurance Program, which provides the vast majority of United States flood insurance policies, would have to quadruple premiums on high-risk homes inside floodplains to reflect the risks they already face, according to data issued on Monday by the First Street Foundation, a group of academics and experts that models flood risks.

By 2050, First Street projected, increased flooding tied to climate change will require a sevenfold increase.

“Climate Change Could Cut World Economy by $23 Trillion in 2050, Insurance Giant Warns”

Rising temperatures are likely to reduce global wealth significantly by 2050, as crop yields fall, disease spreads and rising seas consume coastal cities, a major insurance company warned Thursday, highlighting the consequences if the world fails to quickly slow the use of fossil fuels.

The effects of climate change can be expected to shave 11 percent to 14 percent off global economic output by 2050 compared with growth levels without climate change, according to a report from Swiss Re, one of the world’s largest providers of insurance to other insurance companies. That amounts to as much as $23 trillion in reduced annual global economic output worldwide as a result of climate change.

Pay Now or Pay Later

“Tiny Town, Big Decision: What Are We Willing to Pay to Fight the Rising Sea?”

On the Outer Banks, homeowners in Avon are confronting a tax increase of almost 50 percent to protect their homes, the only road into town, and perhaps the community’s very existence.

“Why Climate Change is a Risk to Financial Markets”

LONDON — Climate change is increasingly influencing investment decisions, but it also poses certain risks to financial stability that are not being taken completely seriously, experts have told CNBC.

… There are two main ways in how climate change is a problem from a financial point of view: Its physical effects, such as extreme weather events; and the impact of moving to a less carbon dependent economy.

“When a country is hit by a natural disaster — and these disasters are becoming more frequent and more severe — then property is affected, production capacity of agriculture, of industry is affected, even the very financial institutions may be affected,” Kristalina Georgieva, the managing director of the International Monetary Fund, told CNBC earlier this month.

Global Starvation:

Madagascar on the brink of climate change-induced famine” (https://www.bbc.com/news/world-africa-58303792)

Madagascar is on the brink of experiencing the world’s first “climate change famine”, according to the United Nations, which says tens of thousands of people are already suffering “catastrophic” levels of hunger and food insecurity after four years without rain.

The drought – the worst in four decades – has devastated isolated farming communities in the south of the country, leaving families to scavenge for insects to survive.

One of the saddest parts of the present dynamic is that people are moving in droves to places that are already experiencing major, highly visible impacts of climate change:

The effects are being felt across the West. Lake Mead, the largest reservoir in the United States, is at its lowest level since it was first filled in the 1930s. Water levels are so low that the Bureau of Reclamation, an agency of the Interior Department, declared the first-ever water shortage on the Colorado River on August 16th. Reduced snowpack in the Rocky Mountains and Sierra Nevada has turned forests into tinderboxes and fuelled wildfires. Joshua trees, though native to the desert, are parched and dying.

I have encountered this attitude before in other places, but it was almost always framed as now vs. the future. At this point, however, it seems to be a case of ignoring already present risks that will only continue to amplify. I will write more on this psychology in future blogs.

Posted in Climate Change | Tagged , , , , , , , , , , , , , , , , , , | Leave a comment

The Social Cost of Carbon

Things are changing. My courses start tomorrow. Originally, I was scheduled to teach face-to-face but for a variety of reasons, I’m back to online-only. Many of my colleagues are still scheduled for either face-to-face or “hybrid” teaching, where at least some classes will be held on campus.

Summer is finally beginning the transition into fall (the official end of summer is September 22nd but it feels like it’s already here). I continue to monitor the NYT climate list (August 18, 2020 blog) daily, scanning the temperatures in the major global cities. I haven’t seen many instances of three-digit temperatures in the US lately and most of these have popped up in the usual places such as Las Vegas and Phoenix. In the Middle East, Baghdad, Damascus, and Riyadh are still experiencing three-digit heat. I haven’t seen it hit 100o anywhere in Europe but Athens is very close. It’s gotten so bad that they have just created a new position and appointed a “Chief Heat Officer” with the hopes to cool it down. Luckily, Africa and the rest of North and South America remain under 100o. Even so, NOAA has just declared July 2021 the Earth’s hottest month on record. Our full attention is still focused on COVID-19, but this summer has woken up a lot of people to the reality of climate change and its corresponding physical and fiscal costs.

In the last few blogs, I have tried to summarize the effects that global warming is having on mortality. I have also looked at the Biden administration’s attempts to allocate resources to fight climate change. They’ve been successful so far, garnering trillions of dollars. What I have not discussed is the potential cost of doing nothing. Economists can estimate this with something called the “social cost of carbon.” I have mentioned the term briefly in earlier blogs (January 8 and March 5, 2019), in which I relied on the National Academy of Science definition. It’s time to revisit the concept on a broader basis. The Trump administration did everything in its power to minimize the use of this metric. Unsurprisingly, one of the first things that President Biden did was to ask a group of economists to revisit the issue.

This blog is focused on the general explanation of the concept through the Wikipedia entry, and a summary of the most recent estimate. As Figure 1 shows, according to the new estimate, the social cost of carbon increased from less than $10/ton at the previous count to over $50/ton of carbon dioxide. To get a feeling of what these round numbers actually mean, we have to return to my July 6, 2021 blog, where I estimated the anthropogenic (human-based) contributions of carbon dioxide in a business-as-usual scenario. The present concentration of carbon dioxide is 400ppmv. Before the industrial revolution, it was only 280ppmv. The unit of 400ppmv is equivalent to 3 trillion tons of carbon dioxide. In other words, we have already added a trillion tons to the atmosphere. If we take the newly calculated social cost of carbon of $50/ton from Figure 1, this addition has already cost us $50 trillion. In my July 6th blog, I estimated that in a business-as-usual scenario, we will double the pre-industrial concentration of carbon dioxide by 2069. That would mean adding approximately another 200ppmv or 2 trillion tons of carbon dioxide, costing us $100 trillion more. With these kinds of numbers, it is worthwhile to pay attention to details.

carbon, cost, social cost, sccFigure 1

Let’s start with some Wikipedia definitions before we move on to details of the new calculations:

Social cost in neoclassical economics is the sum of the private costs resulting from a transaction and the costs imposed on the consumers as a consequence of being exposed to the transaction for which they are not compensated or charged.[1] In other words, it is the sum of private and external costs. This might be applied to any number of economic problems: for example, social cost of carbon has been explored to better understand the costs of carbon emissions for proposed economic solutions such as a carbon tax.

Private costs refer to direct costs to the producer for producing the good or service. Social cost includes these private costs and the additional costs (or external costs) associated with the production of the good for which are not accounted for by the free market. In short, when the consequences of an action cannot be taken by the initiator, we will have external costs in the society. We will have private costs when initiator can take responsibility for agent’s action.[2]

Definitions[edit]

Mathematically, social marginal cost is the sum of private marginal cost and the external costs.[3] For example, when selling a glass of lemonade at a lemonade stand, the private costs involved in this transaction are the costs of the lemons and the sugar and the water that are ingredients to the lemonade, the opportunity cost of the labor to combine them into lemonade, as well as any transaction costs, such as walking to the stand. An example of marginal damages associated with social costs of driving includes wear and tear, congestion, and the decreased quality of life due to drunks driving or impatience, and many people displaced from their homes and localities due to construction work. Another social cost of driving includes the pollution driving costs to other people in the society. For both private costs and external costs, the agents involved are assumed to be optimizing.[2]

Alternatives[edit]

The alternative to the above neoclassical definition is provided by the heterodox economics theory of social costs by K. William Kapp. Social costs are here defined as the socialized portion of the total costs of production, i.e., the costs which businesses shift to society in their attempts to increase their profits.[4]

Carbon[edit]

This section is an excerpt from Social cost of carbon[edit]

The social cost of carbon (SCC) is the marginal cost of the impacts caused by emitting one extra tonne of greenhouse gas (carbon dioxide equivalent) at any point in time, inclusive of ‘non-market’ impacts on the environment and human health.[11] The purpose of putting a price on a ton of emitted CO
2 is to aid policymakers or other legislators in evaluating whether a policy designed to curb climate change is justified. The social cost of carbon is a calculation focused on taking corrective measures on climate change which can be deemed a form of market failure.[12]

An intuitive way of looking at this is as follows: if the price of carbon is $50 per tonne in 2030, and we currently have a technology that can reduce emissions by 1 million metric tonnes in 2030, then any investment amount below $50 million minus interests would make economic sense, while any amount over that would lead us to consider investing the money somewhere else, and paying to reduce emissions in 2030.[13]

 A team from the University of Chicago wrote a critically important paper that includes Figures 1 and 2. The document itself is 50 pages long, so I am only including the abstract of this paper and the figures, which summarize the team’s research and recommendations.  I urge you to refer to the original paper to make up your own opinion.

WORKING PAPER · NO. 2021-04 Updating the United States Government’s Social Cost of Carbon

Tamma Carleton and Michael Greenstone
JANUARY 2021:

Abstract: This paper outlines a two-step process to return the United States government’s Social Cost of Carbon (SCC) to the frontier of economics and climate science. The first step is to implement the original 2009-2010 Inter-agency Working Group (IWG) framework using a discount rate of 2%. This can be done immediately and will result in an SCC for 2020 of $125. The second step is to reconvene a new IWG tasked with comprehensively updating the SCC over the course of several months that would involve the integration of multiple recent advances in economics and science. We detail these advances here and provide recommendations on their integration into a new SCC estimation framework.

social carbon, carbon, costFigure 2

Next week, I will apply the concept of the social cost of carbon to specific current situations, including climate change’s impacts on supply chains, insurance estimates, and the actual cost of fighting fires, floods, droughts, etc.

Meanwhile, I’m curious about your thoughts. Do you think the US should bring back the social cost classification for policymaking?

Posted in Anthropogenic, Climate Change, Economics, Sustainability, US | Tagged , , , , , , , , , , , , , , , , , , , , , , , | 1 Comment

The Math Identity for Olympic Medals

One of the biggest shocks of the Tokyo 2020 Olympics was Simone Biles’ historic withdrawal from several events. Her teammates expressed solidarity with her decision and she received a lot of positive feedback globally for placing her health above her career. Meanwhile, her absence in those events left room for other gymnasts in the top spot, and her teammate Suni Lee won the all-around competition. After her win, Lee thanked her family, friends, and ethnic community for their support but faced criticism for not mentioning her country:

After Suni Lee pulled off a stunning triumph in the women’s all-around gymnastics competition at the Tokyo Olympics, she declared her gold medal a victory for her family, her Hmong community and herself. She pointed to the larger context of all that brought her to that moment and responded with gratitude, especially for her father, who was paralyzed after falling off a ladder in 2019. But notably, she omitted America.

I thought that it was time to try to quantify the role of the collective in individual wins.

This summer, we are witnessing three major global events: the Olympics, a global pandemic that continues to kill millions, and increasingly intense climate change that threatens human existence. The collective or state plays a critical role in all three. Since I started this blog nine years ago, I have talked a lot about the state’s role in climate change. For the last two years, I have also worked to correlate COVID-19 with our confrontation of anthropogenic climate change. Like the pandemic, we already know the causes of climate change, we just need to establish and follow global mitigation strategies. Climate change accelerates based on our carbon dioxide emissions, most of which correlate with our energy use and how we source our power. This is a social and economic problem as well as an environmental one. We can summarize the contributing factors with the IPAT identity (November 26, 2012):

There is a useful identity that correlates the environmental impacts (greenhouse gases, in Governor’s Romney statement) with the other indicators. The equation is known as the IPAT equation (or I=PAT), which stands for Impact Population Affluence Technology. The equation was proposed independently by two research teams; one consists of Paul R. Ehrlich and John Holdren (now President Obama’s Science Adviser), while the other is led by Barry Commoner (P.R. Ehrlich and J.P. Holdren; Bulletin of Atmospheric Science 28:16 (1972). B. Commoner; Bulletin of Atmospheric Science 28:42 (1972).)

The identity takes the following form:

Impact = Population x Affluence x Technology

I went into more depth on the impact of energy use on carbon dioxide emissions later (February 24, 2015):

Figure 2, taken from the latest IPCC reports, shows the relative contributions of the four terms with the carbon intensity of energy defined as CO2/energy summarizing the last two energy terms. The balancing act of the socioeconomic terms with the energy terms is clearly visible, resulting in increased emission with the increased contributions from the socio-economic terms, dominated by the increased affluence of developing countries. The increase in emission associated with the first two terms of the equality is only partially compensated by the energy terms.

As bleak as these numbers can get, this identity can also apply to more enjoyable global happenings, such as the Olympics. It can take the following form:

Number of medals per country = population * (GDP/Capita) * (Sports/GDP) * (Athletes/Sports) * (Medals/Athletes)

Where Sports/GDP represents the fraction of the country’s GDP allocated to sports, Athletes/Sports represents the size of the country’s athletic delegation and Medals/Athletes represents the fraction of their athletes that won medals.

I can abbreviate the last identity as Medals = Population*Affluence*Olympics or MPAO.

This is called an identity because in all three cases, denominators cancel numerators to leave identical terms on the left- and right-hand sides of the equation. Figures 1, 2, and 3 present diagrams from my favorite visualizing site: Visual Capitalist. They identify the three key elements in the MPAO identity, giving us an instant understanding of the global distribution of these terms.

Figure 1 Distribution of medals in the Tokyo 2020 Olympic

Figure 2 Distribution of Global Population

Figure 3Global distribution of GDP/Capita (Affluence)

I have constructed Table 1 to provide all the terms in the MPAO identity for the 10 countries that got most of the Olympic medals in the Tokyo 2020 Olympics. I took the first three indicators in the identity from the figures above and found the number of athletes from each country from this Insider article. The (Sports/GDP)  was the term for which I had the most difficulty finding data. Most of the data for this term in Table 1 come from a 2008 factbook from the OECD (Organization for Economic Cooperation and Development). Its data for sports and recreation expenditures is even older (2005). The site distinguishes between household and government expenditures but most seem to be the former. Since neither China nor Russia is a member of the OECD, I found a Bloomberg article for China’s sports expenditures. The numbers are consistent with those from the OECD. I couldn’t find a similar site for Russia but the country has a Sports Ministry. I did find the budget of that office but as a fraction of Russia’s GDP, it came out almost an order of magnitude smaller than that of the rest of the countries. Not being able to verify this with other sources, I left this entry for Russia empty.

I am not the first to look into the correlation between the resources that a country dedicates to sports and its competitive successes in international competitions. Several social scientists have addressed the issue before.

Table 1 – Distribution of medals among top 10 countries

This table suggests that, within a factor of two, the efficiency of the athletic delegation, in terms of the number of medals per size of the delegation, is approximately constant. In other words, the more people you send, the more likely you are to get a medal—but it costs money to train those athletes. The actual amount put aside for the Olympics specifically is based on shaky data; great improvement in data for this category is essential before we can draw any other conclusions. That said, the fact that 8 out of the 10 top medal gatherers are rich countries strongly suggests that state support in one form or another is essential.

I wrote about the 2016 Rio Olympics while they were happening (September 8, 2016). At the time, I paid special attention to immigration and the definition of state in the context of the Olympics, where many athletes can “choose” which state to represent. This remained an issue in the Tokyo Olympics (see the Israeli baseball team). The medal distribution was also similar. The major medal winners listed in Table 1 are almost the same as those from the Rio Olympics, with the exception that the Netherlands has since replaced South Korea in the top 10. This time, South Korea ranked 15th, with a total of 20 medals. I suspect the outlay from these countries was and remains much higher than many of the lower-scoring countries. More than 200 countries participated in the Tokyo Olympics but the 10 countries in Table 1 took home 54% of the total medals.

Posted in Climate Change, US | Tagged , , , , , , , , , , , , , , , , , | Leave a comment

Infrastructure Timing

They did it! Today, after a long slog of debate, the US Senate has finally passed a bipartisan version of the infrastructure bill that came out of the American Jobs Plan the Biden administration proposed in April.

For more information on the original proposal, see my April 6, 2021 blog:

In Tables 1-3, I have highlighted the entries that can be associated with climate change, and which I will speak to specifically in future blogs. Of course, the whole effort addresses a multitude of overlapping issues; none of the items can be exclusively associated with one of the entries of my earlier Venn diagram. Rounding up from the sum of the estimated costs for all of the entries, we come to $1.9 trillion. With the addition of the $400 billion for in-home care, we reach the plan’s quoted $2.3 trillion. The sum of the highlighted, climate-related items comes to $1.35 trillion, 70% of the total cost.

The New York Times published an article about the relationship between the American Jobs Plan and the new infrastructure plan, which also looked at the changes between the original and the current versions of the plan and included the graphic below.

infrastructure, bill, bipartisan

Figure 1

At 2,702 pages, this infrastructure bill is the largest such bill in American history. It was released Sunday evening (August 1st).

As we can see from Figure 1, while roughly half of the original bill tackled climate change, the new version has eliminated nearly all of those measures. That said, we don’t have to despair just yet. The Biden administration seems to be repackaging the proposals separately, aiming to pass as many as possible through the very balanced but incredibly partisan Congress. R&D and Manufacturing was a significant category of the climate-related legislation in the old proposal. In June, the US Senate passed a separate major bill, the United States Innovation and Competition Act of 2021 (see my June 15, 2021 blog, “Sputnik and China”), almost unanimously. Although this particular legislation was designed to counter China, an in-depth examination shows that many of the proposed activities will relate to climate change. The same, I’d argue, is true of the new infrastructure proposal, even in its current, gutted form: as long as this particular climate action-dedicated executive branch is in charge of coordinating these activities, that priority will be visible during implementation.

This is not necessarily true for the other important theme of the original proposal: the social element. Some have labeled that element, which mainly focused on equity in its many forms, “soft” infrastructure. The Republicans (and some key Democrats) refuse to cooperate on these measures. They argue that tackling these issues will inject too much money into the market at once and trigger uncontrollable inflation.

The Democrats are planning to pursue a $3 trillion independent effort that they hope to be able to pass on their own, through a process known as “budget reconciliation.” The danger here is that the House Democrats are threatening not to even bring either of the bills I mentioned above to a vote, even though the Senate has reached bipartisan agreements and the White House has endorsed the compromises. In other words, so far, none of the legislative activities is secured.

In the context of mitigation and adaptation of anthropogenic climate change, these activities still lack an examination of the impacts that will come from our energy transition away from fossil fuel dependence.

Figure 2 shows the outline of  US energy use in 2019, as constructed by Visual Capitalist, based on data from the Lawrence Livermore National Laboratory. The units of energy used throughout are quads. For reference, here’s an approximate conversion:

1quad = 1×10¹⁵BTU = 1×10¹⁸Joules ≈ energy in 8 billion gallons of gasoline

On the left-hand side of Figure 2, we have the energy sources, 80% of which are fossil fuels. To decarbonize the system, we need to eliminate all fossil fuels from the input, and/or capture the carbon dioxide in the air, which we are not currently doing in any significant way.

energy, consumption, input, output, energy services, physics, residential, commercial, industrial, transportation

Figure 2Composite energy use in the US – 2019

Breaking down the distribution of the energy above, we find that:

37 quads from the input are going to the production of electricity

28.2 quads are going to petroleum use in transportation.

24.2 quads from the production of electricity are waste energy (marked as rejected energy) or heat that depends on the temperature that we are using in the energy conversion process.

In a previous blog (October 22, 2019), I discussed the limits of the efficiency of producing electricity from primary energy sources. These limits are fundamental and are an expression of the Second Law of Thermodynamics, a key aspect of physics with an unwieldy name. This law applies not only to electricity but also to any process that involves the conversion of heat to work (i.e., in physics, anything useful). Figure 2 describes everything useful that we get out of energy and lumps them all into “energy services.” Out of approximately 100 quads of energy input, we get a mere 32.7 quads of energy services. The total efficiency of this process is 32.7%, an efficiency that is critically dependent on the temperature of the conversion.

We have three ways to decrease the carbonization of our energy use:

  1. Decrease the number of our energy services
  2. Decrease the number of fossil fuels that we use and replace them with sustainable energy sources (defined here as primary energy that does not emit carbon dioxide) as much as possible
  3. Increase the efficiency of the conversion by increasing the temperature of the conversion

As we saw in an earlier blog (October 15, 2019), the most important strategy taking place in the energy transition right now is the shift to electricity from direct use of primary energy sources. Three of the four components of the energy services shown in Figure 2 already have major electrical contributions. The only sector with minimal electrical contributions is transportation. Presently (2019), transportation uses 28.2 quads of energy, 22.3 quads of which are wasted as (mostly exhaust) emissions. President Biden set a goal for 50% of new cars to be electric by 2030. However, electric cars are only as low carbon as the sources of their energy (see my March 19, 2019 blog for a description of the shift to electric cars). So, before we can create a carbon-free economy, we’ll need carbon-free electricity.

Figure 2 includes the industrial and commercial sectors in its breakdown of energy services. Table 1 gives a list of examples of energy use in the industrial sector:

Table 1 Examples of industrial sector energy use

industrial, energy, manufacturing, mining, refining

A revolution is now taking place, aiming not only to decarbonize this sector but make it fully sustainable, part of the “cyclical economy.” Due to the Second Law of Thermodynamics that I mentioned earlier, the energy part of this sector cannot be reused, but the chemical part can. A piece in The New York Times provides a good summary, with a few examples:

For the past few years, a number of start-ups have begun developing products that aim to fold in carbon dioxide captured from smokestacks and other sources of pollution, in an attempt to reach a new level of environmentally friendly manufacturing: one in which greenhouse-gas molecules are not only kept out of the atmosphere but also repurposed. This undertaking, usually characterized as carbon utilization, goes well beyond flooring — to plastics, jet fuels, diesel, chemicals, building materials, diamonds, even fish food.

Advocates of carbon utilization, or carbontech, as it’s also known, want to remake many of the things we commonly use today. But with one crucial difference: No emissions would have been added to the environment through their fabrication. Carbontech sees a future where the things we buy might be similar in their chemistries and uses but different in their manufacture and environmental impact. You might wake in the morning on a mattress made from recycled CO2 and grab sneakers and a yoga mat made from CO2-derived materials. You might drive your car — with parts made from smokestack CO2 — over roads made from CO2-cured concrete. And at day’s end, you might sip carbontech vodka while making dinner with food grown in a greenhouse enriched by recycled CO2. Many of these items would most likely be more expensive to the consumer than their usual counterparts, in part because they often need significant amounts of energy to make. But the hurdles to making them are no longer insurmountable.

As for the commercial sector, most energy use relates to the day-to-day running of a wide variety of buildings in the following categories:

The top five energy-consuming building categories used about half of the energy consumed by all commercial buildings in 2012, and they include the following types of buildings:

  • Mercantile and service (15% of total energy consumed by commercial buildings)
    • Malls and stores
    • Car dealerships
    • Dry cleaners
    • Gas stations
  • Office(14% of consumption)
    • Professional and government offices
    • Banks
  • Education(10% of consumption)
    • Elementary, middle, and high school
    • Colleges
  • Health care(8% of consumption)
    • Hospitals
    • Medical offices
  • Lodging(6% of consumption)
    • Hotels
    • Dormitories
    • Nursing homes

Last updated: September 28, 2018

It will be interesting to see how we do in decarbonizing these sectors, whether via legislative intervention, advances in technology, commercial competition, or a combination of these factors. Here’s hoping the House can keep the forward momentum of the Senate’s new legislation.

Posted in Climate Change, Economics, Energy | Tagged , , , , , , , , , , , , , , , , , , , , , , , , , , , , , , , , , , , , | Leave a comment

Heath Death Indicators

I have been spending most of my evenings watching the Tokyo Olympics.  One of the most frequent questions directed to athletes who have performed outdoors is how they handle the heat. Right now, Tokyo is having highs of 90oF, with 75% humidity. That humidity is on the high side for most US cities but the temperature itself is common. Using the heat index chart from last week’s blog, we see that Tokyo’s heat index comes out to 109oF—just on the dividing line between extreme caution and danger. Danger means a high likelihood of sunstroke, muscle cramps, and/or heat exhaustion. Unlike some of us, though, most of the athletes don’t have the option to stay home and turn on the air conditioning to escape the heat. The organizers of the Olympics have tried to mitigate the heat for some competitors: they sprayed water on the sand for beach volleyball and moved the marathon race about 500 miles north of Tokyo. However, this is not much consolation to tennis players or other track and field participants who still have to compete outdoors within city limits.

Additionally, these conditions are considerably harsher than those of the last Olympics that took place in Tokyo—in 1964. The average temperature for those games was around 70oF. However, part of the reason for this drastic difference is that they were held in October and not July-August. Even so, at the time, the average high temperature in July-August hovered around 80oF.

We already knew that climate change is a serious threat to the winter Olympics but it is becoming increasingly obvious that its effects will extend to the summer games: for safety’s sake, they will either need to shift them to a later date or move them to the southern hemisphere.

Olympics aside, what about the rest of us? What dangers do we face if forced to be outside under such extreme heat conditions? National Geographic had the most straightforward description that I have encountered:

The human body has evolved to shed heat in two main ways: Blood vessels swell, carrying heat to the skin so it can radiate away, and sweat erupts onto the skin, cooling it by evaporation. When those mechanisms fail, we die. It sounds straightforward; it’s actually a complex, cascading collapse.

As a heatstroke victim’s internal temperature rises, the heart and lungs work ever harder to keep dilated vessels full. A point comes when the heart cannot keep up. Blood pressure drops, inducing dizziness, stumbling, and the slurring of speech. Salt levels decline and muscles cramp. Confused, even delirious, many victims don’t realize they need immediate help.

With blood rushing to overheated skin, organs receive less flow, triggering a range of reactions that break down cells. Some victims succumb with an internal temperature of just 104 degrees Fahrenheit (40 degrees Celsius); others can withstand 107 degrees for several hours. The prognosis is usually worse for the very young and for the elderly. Even healthy older people are at a distinct disadvantage: Sweat glands shrink with age, and many common medications dull the senses. Victims often don’t feel thirsty enough to drink. Sweating stops being an option, because the body has no moisture left to spare. Instead, sometimes it shivers.

Even the fittest, heat-acclimated person will die after a few hours’ exposure to a 95° “wet bulb” reading, a combined measure of temperature and humidity that takes into consideration the chilling effect of evaporation. At this point, the air is so hot and humid it no longer can absorb human sweat. Taking a long walk in these conditions, to say nothing of harvesting tomatoes or filling a highway pothole, could be fatal. Climate models predict that wet-bulb temperatures in South Asia and parts of the Middle East will, in roughly 50 years, regularly exceed that critical benchmark.

By then, according to a startling 2020 study in Proceedings of the National Academy of Sciences, a third of the world’s population could be living in places—in Africa, Asia, South America, and Australia—that feel like today’s Sahara, where the average high temperature in summer now tops 104°F. Billions of people will face a stark choice: Migrate to cooler climates, or stay and adapt. Retreating inside air-conditioned spaces is one obvious work-around—but air-conditioning itself, in its current form, contributes to warming the planet, and it’s unaffordable to many of the people who need it most. The problem of extreme heat is mortally entangled with larger social problems, including access to housing, to water, and to health care. You might say it’s a problem from hell.

The Mayo Clinic provides information about how heat affects us in ways we might not have considered.  Indeed, we are seeing the deadly consequences:

Extreme heat causes many times more workplace injuries than official records capture, and those injuries are concentrated among the poorest workers, new research suggests, the latest evidence of how climate change worsens inequality.

Hotter days don’t just mean more cases of heat stroke, but also injuries from falling, being struck by vehicles or mishandling machinery, the data show, leading to an additional 20,000 workplace injuries each year in California alone. The data suggest that heat increases workplace injuries by making it harder to concentrate.

“Most people still associate climate risk with sea-level rise, hurricanes and wildfires,” said R. Jisung Park, a professor of public policy at the University of California, Los Angeles and the lead author of the study. “Heat is only beginning to creep into the consciousness as something that is immediately damaging.”

The findings follow record-breaking heat waves across the Western United States and British Columbia in recent weeks that have killed an estimated 800 people, made wildfires worse, triggered blackouts and even killed hundreds of millions of marine animals.

The graphic below provides some suggestions for how we can stay safer during heat waves:

While some of these seem relatively obvious, others are not necessarily as intuitive. For instance, in addition to the advice to build up a gradual heat tolerance, the part about how much water to drink (and keep drinking) is vital: don’t wait until you’re thirsty! According to the Mayo Clinic:

Thirst isn’t a helpful indicator of hydration.

In fact, when you’re thirsty, you could already be dehydrated, having lost as much as 1 to 2 percent of your body’s water content. And with that kind of water loss, you may start to experience cognitive impairments — like stress, agitation and forgetfulness, to name a few.

As we’ve discussed before, climate change means that the frequency and intensity of extreme weather will only get worse if we continue business as usual:

The study, conducted by international scientists with the World Weather Attribution group, found that the climate crisis was responsible for boosting peak temperatures by 3.6 degrees Fahrenheit (2 degrees Celsius). It also made the extreme temperatures at least 150 times more likely to occur. The research also shows that the heat wave was a 1-in-1,000-year event in our current climate, which means it’s still a rarity. But consider that it would’ve been a 1-in-150,000-year event in the pre-industrial era.

If the world heats up by another 0.8 degrees Celsius, breaching the Paris Agreement’s goal of limiting warming to 2 degrees Celsius (3.6 degrees Fahrenheit) above pre-industrial temperatures, events like this will become almost commonplace, occurring every five to 10 years.

The report itself isn’t peer-reviewed yet, but it relies on peer-reviewed techniques that have been repeatedly used for snap analyses, including recent heat waves in Siberia and Australia, and later peer-reviewed. That gives scientists confidence in the disturbing results.

The IPCC continues to warn about the future:

Millions of people worldwide are in for a disastrous future of hunger, drought and disease, according to a draft report from the United Nations’ Intergovernmental Panel on Climate Change, which was leaked to the media this week.

“Climate change will fundamentally reshape life on Earth in the coming decades, even if humans can tame planet-warming greenhouse gas emissions,” according to Agence France-Presse , which obtained the report draft.

The report warns of a series of thresholds beyond which recovery from climate breakdown may become impossible, The Guardian said. The report warns: “Life on Earth can recover from a drastic climate shift by evolving into new species and creating new ecosystems… humans cannot.

“The worst is yet to come, affecting our children’s and grandchildren’s lives much more than our own.”

But we are not just talking about the future; we’re suffering these extreme effects now. This is from just a month ago:

VANCOUVER/PORTLAND, June 30 (Reuters) – A heatwave that smashed all-time high temperature records in western Canada and the U.S. Northwest has left a rising death toll in its wake as officials brace for more sizzling weather and the threat of wildfires.

The worst of the heat had passed by Wednesday, but the state of Oregon reported 63 deaths linked to the heatwave. Multnomah County, which includes Portland, reported 45 of those deaths since Friday, with the county Medical Examiner citing hyperthermia as the preliminary cause.

By comparison all of Oregon had only 12 deaths from hyperthermia from 2017 to 2019, the statement said. Across the state, hospitals reported a surge of hundreds of visits in recent days due to heat-related illness, the Oregon Health Authority said.

In British Columbia, at least 486 sudden deaths were reported over five days, nearly three times the usual number that would occur in the province over that period, the B.C. Coroners Service said Wednesday.

Our only real remedy is to change the business-as-usual scenario we have been following—quickly! Next week, I’ll look at the timing necessary to accomplish such a transition.

Posted in Climate Change, Extreme Weather | Tagged , , , , , , , , , , , , , , , , , , , , , | 4 Comments