School Curriculum: The NYT

Why do we send our kids to school? Why did our parents send us to school? People are wondering this more than ever, now that many schools are still closed physically and have moved to an online educational experience. But it’s not a new question and will stay with us (likely to a considerably smaller degree) after the pandemic is over.

As I have mentioned in earlier blogs, I was born three months before the start of WWII in Warsaw, Poland and my early childhood was dominated by my Holocaust experiences (namely, the Warsaw Ghetto and Bergen-Belsen). But I was fortunate to be liberated by American soldiers in 1945. I was six weeks short of my sixth birthday. Soon after I turned six, I was able to start school in Israel (Palestine at the time)—a pretty normal starting age. I don’t think I would be the same person if I had started school later, for example at age 12.

Now that I teach in a college, we are constantly wondering: what do students, parents, and society in general expect us to provide in our education?

I see the educational experience as a necessary ingredient in preparing students for the future. On one side, students need to master certain skills in order to pursue various employment opportunities. On the other, we also regard education as key to helping make our students happy and productive individuals prepared to face the future. Of course, none of us—parents, students, or educators—are able to predict what that future will bring. The present pandemic is only the most recent evidence of this inability. We rely on the belief that understanding the past and the ever-changing present is the best and perhaps the only way to be able to confront the future.

Which brings me back to last week’s blog about The New York Times Weather Report. The NYT cares a lot about learning. Like many other publications, it offers deeply discounted (often free) academic rates for students and educators. The paper also has a whole Learning Network section online, which aims to:

1) Connect the classroom to the world.

2) Give students a voice — and strengthen literacy skills along the way.

3) Promote critical and creative thinking through multimedia.

The NYT summarizes the site in this way:

Welcome to The Learning Network. Here are three quick facts about our site:

  • The Learning Network publishes about 1,000 teaching resources each school year, all based on using Times content — articles, essays, images, videos, graphics and podcasts — as teaching tools across subject areas.

  • Most of our resources are free (only our lesson plans are limited to five per month for nonsubscribers).

  • Our intended audience is middle and high school teachers and students (teenagers 13 and up). That said, we know that our content is used in elementary schools and colleges as well, and much of it is appropriate for both.

The Learning Network section features over 100 lesson plans based on NYT articles. The areas of study include Science Technology and Health; Education; The Arts and Culture; Sports; American Politics, History and Civics; and Global History, Politics and Culture.

I, of course, searched for content related to either climate change or COVID-19. While I didn’t find a direct lesson plan on either of these topics, I found one about environmental issues and one that indirectly relates to climate change: “The World Can Make More Water From the Sea, but at What Cost.” I wrote some blogs about the latter (just put desalination in the search box) and the NYT has a full lesson on desalination:

Lesson of the Day: ‘The World Can Make More Water From the Sea, but at What Cost?’

In this lesson, students will explore the issue of access to clean and safe water and weigh the pros and cons of desalination as a possible solution to water scarcity.

Lesson Overview

Featured Article: “The World Can Make More Water From the Sea, but at What Cost?

The issue of water quantity and quality is increasingly a global problem. According to the Environmental Protection Agency, over 80 percent of the world is covered in water, but only 3 percent is fresh water. As more places face water scarcity, desalination is seen as a possible answer. However, energy and financial requirements limit how widely that process can be used.

In this lesson, students will explore the issue of water access, examine how desalination presents a potential solution, and finally, weigh the costs and benefits of various approaches to water scarcity.

Warm Up

Do you have access to clean and safe water? How concerned are you about access to quality water now or in the future?

Do you believe that your family, and Americans in general, use water wisely? Or do you think we take this vital resource for granted?

Before reading, look at the graph below and answer the following questions:

  • What do you notice?
  • What do you wonder? What are you curious about that comes from what you notice in the graph?
  • What story does the graph tell? Write a catchy headline that captures its main idea. If your headline makes a claim, tell us what you noticed that supports your claim.

water stress, fresh water

Questions for Writing and Discussion

Read the article, then answer the following questions:

  1. Scroll through the photos in the article: What do you notice? Which image stands out to you and why? What story do these photos tell?
  2. The article begins, “Desalinated seawater is the lifeblood of Saudi Arabia, no more so than at King Abdullah University of Science and Technology.” Why did Henry Fountain, the author, start by describing the water uses of one university? How does this single institution illustrate the needs of the entire country?
  3. How big a problem is water quality and quantity globally? What are the major causes of water scarcity worldwide?
  4. What challenges do Saudi Arabia and other countries face in making desalination affordable and sustainable? In what ways are engineers and researchers addressing these challenges?
  5. In your own words, describe the desalination process. Explain reverse osmosis.
  6. How is Saudi Arabia’s effort to find renewable and sustainable water sources linked to finding sustainable energy sources?
  7. What is your reaction to the article? What was most interesting, surprising or provocative to you? How does this article alter your opinion of the way you, your family and your community use water? What responsibility do we all have to using water responsibility?

Going Further

Imagine you are a member of local government in one of the high water-stress locations identified on the map in the warm-up activity. Should you invest in desalination technology? What factors would you consider? What are the pros and cons of using desalination to solve the problem of water scarcity?

As part of your analysis, consider whether other possible solutions might be more desirable, such as changing individual water consumption patterns, recycling sewage into drinking watercombating water pollutionincreasing agricultural efficiencyinvesting in green infrastructure and taxing water use?

(You can find more information on the countries facing water stress in “A Quarter of Humanity Faces Looming Water Crises.”)

What would you recommend?

The original article by Henry Fountain describes a desalination plant in Saudi Arabia. It mentions the financial cost as well as the environmental issues associated with having to dispose of the highly concentrated salt water that is the byproduct of the process. It also talks about trying to transition to sustainable energy sources like solar to drive the process. Many of the photographs included in the article illustrate life around the plant (guys playing golf and an empty Olympic swimming pool) rather than the facility itself.

One of the questions in the lesson plan directly relates to the global scarcity of fresh water (water stress). I especially applaud the lesson plan for urging students to look into other strategies and solutions for water stress. Unfortunately, the article itself is behind a paywall but you don’t need a subscription to look at a few lesson plans.

The NYT should be commended for running such a site. As I mentioned last week, I hope to convince the editors to digitize the Weather Report and make it public under the Learning Network section. Meanwhile, I strongly recommend heading over to the Learning Network site and looking at some of the great resources there.

Like the NYT, other publications and many universities—including mine—are starting to pay more and more attention to databases as a raw material for teaching students to quantitatively mobilize various aspects of the present in preparation for confronting the future. The NYT is collecting one of the most extensive databases on the new coronavirus and the resulting COVID-19. The database serves as an important source for understanding the impacts of the pandemic.

The Economist provides other useful databases that we can use to mobilize the present in the service of the future: the Democracy Index and the “Big Mac Index.” The latter uses the cost of a hamburger in different countries to compare the value of one currency against another, and whether they differ from official exchange rates.

Next week, I will get back to the multiple global threats that we are facing now.

Stay safe.

Posted in Anthropogenic, Climate Change, Education, Water | Tagged , , , , , , , , , , , , , , , , , , , , , , , , , , , , , | 2 Comments

Do-It-Yourself Climate Monitoring: the Weather Report

My wife and I start our day with breakfast and the print edition of The New York Times (NYT). When the paper arrives, we split it between us—she gets the front section and I get the rest. One of the first things I look for in the paper is the Weather Report—specifically, the global temperature listing shown in Figure 1. I am not looking for the weather in New York City. I get that information in a much timelier manner from one of the weather applications on my electronic devices. Rather, I want to see the global picture. What am I searching for? This time of the year I am looking at places with temperatures higher than 100oF and monitoring how long those heat waves last. The Weather Report in Figure 1 shows three cities in the US with temperatures consistently higher than 100oF: El Paso, Phoenix, and Tucson.

Weather report from NYT

Figure 1 The daily global temperature listing in The New York Times Weather Report

Brooklyn College’s academic year starts in a few weeks. I’ll be teaching three courses, each of which discusses climate change on some level. I have recently started to examine ways to use the NYT Weather Report as a teaching resource. I’ve been counting how many consecutive days the temperature stays above 100oF and I am starting to think about the heat index in these places (July 3, 2018 blog). With temperatures of 100oF and humidity (not given in the weather index) reaching between 40% and 100% in El Paso, the heat index in these cities can range between 109oF and 136oF. With prolonged exposure and/or physical activity, such a heat index can amplify danger. This includes instances of muscle cramps and heat exhaustion, as well as much more dangerous heat strokes. In other words—the whole range can be summarized as unlivable. I have a dear friend in Tucson (the editor of this blog) but she and her family are largely able to stay out of the heat. Others, including “essential” workers or those who live from paycheck to the paycheck, cannot. As I mentioned last week, such circumstances are also at play with coronavirus exposure right now.

Another way to analyze this database is to count the number of cities in each continent with temperatures above 90oF. The list provides three columns of temperature: yesterday, today, and tomorrow. A heat wave can be any event with three consecutive days of temperatures above 100oF.

The key is to get a sense of the time-dependence of some of these trends. Since my semester is a bit longer than three months, my students and I will spend about a third of it analyzing such trends.

It is obvious that the data set shown in Figure 1 is a biased one. It emphasizes NYC and the US, and a somewhat arbitrary selection of cities worldwide. The list shows more than 80 cities in the US, which has a population of 330 million, while it only mentions 7 cities in Africa, which has 1.3 billion people. So, any analysis to indicate a global trend has to be based on the same continental analysis that the report provides. One of the most important consequences of this bias is that—as with any data set—to make it useful, we must use the same parameters throughout our study and not change (or supplement) them. Our analysis also has to be sensitive to some properties of the planet. For instance, while it’s the height of summer in the northern hemisphere, it is winter in Australia and in South America. Obviously, we will not look for 100oF or 90oF temperatures in the winters.

The New York Times Weather Report, as we see in Figure 1, is somewhat simplistic. It’s certainly not up to my usual standards. It also bounces around between the paper’s sections. I tried to find the data set online and convert it to a nice figure. No such luck. I spent some quality time on the NYT application with no result. I suspected that for one reason or another, it might only be in the print edition. But, while I was able to find the print edition online, the Weather Report was not there. A more intensive search in the Replica Edition didn’t help. I finally found a note about the phenomenon in a meteorology course in the New York Times inEducation section:

Finding the weather forecast today on the internet or through apps is easy for just about any location on earth.   However, what about getting the forecast on one page for a cross-section of the major cities in the U.S. as well as around the world?   The internet and apps would require a lot of data entry.  What about the level of the NYC reservoirs or whether or not the current month’s temperature and precipitation are above or below normal and other environmental data?

The New York Times print edition provides this information every day.  It is not available on-line.  But if you can find a duplicate copy of the in-print “Weather Report” on line, you will be rewarded with 100 extra points in this lab, not at  http://www.nytimes.com/weather?8qa

I don’t honestly understand the reasoning here, nor the challenge to find something that likely doesn’t exist. If the information is already compiled for the print version, why not just publish it online with a date?

In any case, I want my students to follow the data set for one month, to clearly indicate the parameters that they intend to follow (such as the examples that I gave earlier) and write down the information with the corresponding date. Afterward, they will submit a graph with the related information as a function of time and draw conclusions from the graphic presentation.

The New York Times provides many resources for teaching and learning. It also offers free or discounted subscriptions to students and faculty in many eligible schools. It is obvious that the paper cares for education. I will try to take some steps to convince them to digitize the Weather Report. In spite of its time-dependent nature, publishing the data online would give better access to most and provide a valuable educational resource.

Next week I will try to continue my virtual discussion of The New York Times by examining their learning sections. I hope to communicate to them my desire to incorporate the Weather Report.

Posted in Climate Change, Education, Extreme Weather | Tagged , , , , , , , , , , , , , , , , , , , , , , , , , , | 2 Comments

Looking at the Future Through Coronavirus-Infected Eyes

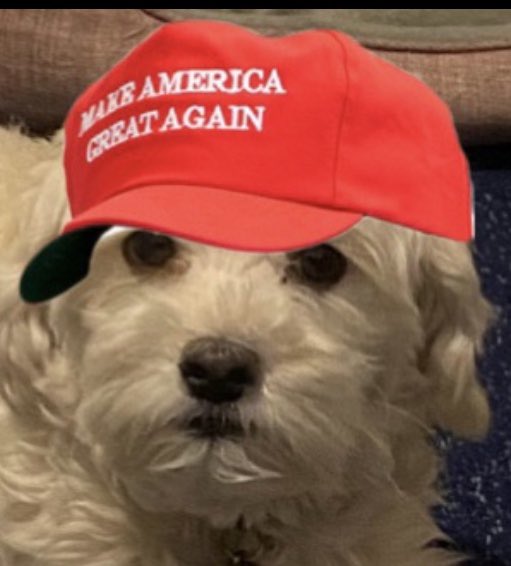
The iconic MAGA hat exemplifies the Trump administration’s unilateralist “America First” philosophy, to the detriment of global welfare

I am starting to write this blog on Thursday, August 6th. The coronavirus situation is currently:

Globally: around 19 million cases, more than 700,000 deaths

In the US: 5 million cases, around 160,000 deaths, and 31 million looking for unemployment benefits

I am one of the fortunate. I am old and vulnerable but I didn’t lose my job. I’ve been teaching online since early March. My wife is with me; she’s younger but still old and vulnerable. She holds a management position at my school and has to coordinate the online transition for 10 departments. She is working harder than ever before. In the five months since our lockdown began, we have probably been out around 5 times. We are lucky to live in a comfortable apartment that has two separate offices so we don’t get on each other’s nerves. It’s also well-equipped with functional electronics for all our communications needs. Facing a similar pandemic even 5 years ago, we probably would not have been able to shift to distanced learning and teaching. Our society would have had to completely shut schools and many other economic activities that have recently shifted online (the original Zoom was launched in 2013 with comparatively less functionality, Google Meet launched in 2017, and Blackboard went public in 2004 with different functionalities). Since we work at a university, we also have great tech support. We fully realize that we are incredibly privileged.

My wife and I live and work in New York City. Before the pandemic and the lockdown, we had an active social life. We love theaters and museums and we tried to enjoy NYC’s plentiful cultural offerings as much as we could. The lockdown has created a lot of free time for me but keeps my wife quite busy with work. I end up reading a lot of books and watching a lot of television—via both cable and multiple streaming platforms. I am particularly enjoying the availability of international TV series, movies, and documentaries.

Living under these conditions, trying to adapt and accommodate to the pandemic, I am constantly reminded that we all live in a global community in which similarities between people are much stronger than our differences. Again, I completely realize that, especially on a global scale, I am very fortunate. I have a comfortable place for my lockdown. I have the ability to get all the food and medicines that I need without leaving home (with the help of “essential” workers who expose themselves to vulnerability on my behalf).

I have lost friends in the pandemic but I am in contact with my family all over the world—they are OK and we share experiences based on similar situations. Not everyone, however—even those that are fortunate enough to share all of my advantages—shares my perspectives. The president of the United States is at the top of this list.

In an earlier blog (October 2, 2018), I described some details of the present US administration’s unilateralist policies. I ended that blog with this:

US National Security Adviser John Bolton summarized the philosophy in his own speech to the Federalist Society:

This Administration will fight back to protect American constitutionalism, our sovereignty, and our citizens. No committee of foreign nations will tell us how to govern ourselves and defend our freedom. We will stand up for the U.S. Constitution abroad, just as we do at home. And, as always, in every decision we make, we will put the interests of the American People FIRST.

The same John Bolton was fired less than two years after he joined the administration and recently wrote a revealing book, “The Room Where It Happened.”

I finished the 2018 blog with a two-word expression in Polish that summarizes the attitude:

In Polish we call such a philosophy, “Zosia samosia.” The phrase refers to someone independent who doesn’t need (or want) help or assistance from anybody. It’s usually used to describe a spoiled kid. This is a dangerous attitude for the most powerful nation in the world to espouse.

The 2018 blog also includes a list of four international treaties that the Trump administration had already left or had declared its intention to leave. Since then, he has also announced the US will leave two nuclear arms control treaties: the Open Skies Treaty and the Intermediate-Range Nuclear Forces Treaty. Additionally, in response to its criticism of his administration’s handling of the pandemic this year, Trump decided to leave the World Health Organization (WHO) and completely quit funding it. As I said last week, “Coronavirus for some is coronavirus for all. Nobody can mitigate the pandemic locally until one mitigates it globally.” Trump’s actions place the US in direct contradiction to this principle.

With regards to both the 2015 Paris agreement on climate change and the WHO, the Trump administration’s first act was to freeze funds that primarily benefit developing countries. Given that the US has long been a major contributor to these funds, its withdrawal has strongly impacted such countries’ mitigation abilities. This means that many will either die or try to immigrate to safer places—in the process, destabilizing the world.

None of these withdrawals is more destabilizing than those from international arms control treaties. This month marks 75 years since the only time atomic bombs were purposely dropped on populated targets (Hiroshima: August 6th, Nagasaki: August 9th). We still don’t know the exact number of people whom the bombs killed directly. Estimates range between 110,000 – 200,000, not counting the impacts of the fallout radiation. For years, the survivors of the bombing have done everything in their power to advance UN treaties that forbid any use of atomic weapons. These survivors are dwindling fast. The current unilateralist, anti-global policies negate the whole concept of international treaties and put all of us and next generations in much more danger.

Not only are we dealing with both a terrifying pandemic and the ongoing threat of climate change, this administration’s deliberate self-isolation has vast effects on global welfare, both now and in the future.

Posted in administration | Tagged , , , , , , , , , , , , , , , , , , , , , , , , , , , , , , , , , , , , , , , , , , , | 1 Comment

Inequity: The Intersection of Coronavirus, Poverty & Other Expected Trends

As with most of my blogs, I wrote this one over the weekend (starting Friday). Last week, I looked at the Sierra Club’s Venn diagram of the Green New Deal. I argued that in order to address the near future global trends that we will face in the coming years, the diagram should include COVID-19 and the projected changes in global population. I have done this in Figure 1.

Venn diagram of intersection between near-future global challenges-- equity, climate change, population, jobs, covid-19, coronavirus

Figure 1 – Venn diagram of expected current and near future global challenges

We are clearly witnessing how some of these challenges interact. Last week saw hurricane Hanna beating the southeast coast of Texas. Climate change amplifies and accelerates hurricanes and meanwhile, southeast Texas is currently one of the most concentrated COVID-19 hot spots in the US. People struggled to evacuate while maintaining social distancing. This weekend the picture seems to be repeating itself with hurricane Isaias, which is expected to hit Florida shortly and continue on a path northeast.

Figure 1 shows that all four trends I addressed last week, in addition to being connected to each other, also intersect with a circle that represents equity.

I am using the term equity here because the original Green New Deal refers to it. Equity is a socio-economic indicator that measures the balance/imbalance in poverty and wealth, access to civil rights, and many other elements. I am primarily concerned with global inequities regarding poverty.

Right now, the coronavirus—while a universal threat—clearly highlights the inequities of healthcare in poor countries and access to safety in richer ones. Let’s look at a list of five countries with some of the most severe COVID-19 outbreaks per capita right now.

Table 1 – Ranking of coronavirus cases per capita in 5 countries, as of 8/4/2020

Country Cases/1M population
USA 14,747
Qatar 39,724
Bahrain 24,520
Kuwait 16,083
Oman 15,469

The US is the third largest country in the world in terms of population. It’s also one of the richest countries in terms of GDP/capita and the clear leader in overall coronavirus cases (4,884,917). The other four countries in this list all belong to the Cooperation Council for the Arab States of the Gulf. These are small, rich countries, with some of the highest concentrations of COVID-19 cases measured per capita. As in the US, while some people are privileged enough to work from home and maintain social distance, many of the less fortunate have little choice but to keep working in dangerous situations. These countries rely heavily on foreign labor—guest laborers make up almost 75% of their work force. So it is unsurprising that almost all of the COVID-19 cases and deaths there occurred among that concentrated foreign labor force.

Many of the case numbers in individual US states exceed the numbers listed in Table 1 and most of America’s work force lives paycheck to paycheck:

Many people noted that their income would be just enough to cover their bills and basic necessities until the next paycheck comes along. This reflects just how many Americans are living paycheck to paycheck.

Depending on the survey, that figure runs from half of workers making under $50,000 (according to Nielsen data) to 74% of all employees (per recent reports from both the American Payroll Association and the National Endowment for Financial Education.) And almost three in 10 adults have no emergency savings at all, according to Bankrate’s latest Financial Security Index.

The coronavirus has only worsened the situation.

Figure 2 shows the distribution of the impact of COVID-19:

covid impact on distribution of American work force

Figure 2 – Impact of COVID-19 on the distribution of the American work force

This means that those in the bottom income brackets (often people of color and immigrants) who still have jobs have no choice but to keep working. Many of these people work in what we deem “essential services,” from grocery stores, farming, and online store fulfillment centers to public transportation and caregiving. We see the overlap between COVID-19, jobs, and inequity here.

In many aspects, the situation in a rich country like the US during this pandemic is not much different from the one in the Gulf states.

We have to absorb the lessons from the impact of COVID-19 to confront ongoing and upcoming disasters, such as climate change and major population decline. Both will strongly affect the age distribution of our work force, likely putting more strain on certain subsets of people and widening existing inequities. Although some places are already experiencing second surges of COVID-19, many developing countries are just now starting to experience the full impact of the first wave of the pandemic. The dangers there multiply relative to impacts on the much more limited health delivery systems, food supply levels, and inability to counteract lockdowns by printing money.

I would not be surprised to see a massive rise in people attempting to move from highly infected areas to “cleaner” ones. Obviously, that won’t work. Coronavirus for some is coronavirus for all. We can’t mitigate the pandemic locally until we mitigate it globally. The same holds true for the longer-range challenges depicted in Figure 1.

Posted in Climate Change, Economics, Sustainability, US | Tagged , , , , , , , , , , , , , , , , , , , , , , , , , , , , , , , | 1 Comment

The Green New Deal and Coronavirus: Intersections

Remember the Green New Deal (see the February 19, 2019 blog)? Representative Alexandria Ocasio-Cortez (AOC) and Senator Ed Murphy introduced the broad resolution to both houses of congress last year. To emphasize the breath of the resolution, here is a section of the bill:

Resolved, That it is the sense of the House of Representatives—

(1) that it is the duty of the Federal Government to create a Green New Deal—

(A) to achieve net-zero greenhouse gas emissions through a fair and just transition for all communities and workers;
(B) to create millions of good, high-wage jobs and ensure prosperity and economic security for all people of the United States;
(C) to invest in the infrastructure and industry of the United States to sustainably meet the challenges of the 21st century;
(D) to secure for all people of the United States for generations to come

(i) clean air and water;
(ii) climate and community resiliency;
(iii) healthy food;
(iv) access to nature; and
(v) a sustainable environment…

The Sierra Club summarized it in the form of a Venn diagram:

Green New Deal, climate, jobs, equity

Figure 1 – Venn diagram of the Green New Deal

Unsurprisingly, on March 25, 2019, the resolution failed to advance in the Republican-controlled Senate.

Less than a year later, COVID-19 started to spread throughout the world.

Two weeks ago, we saw a new analysis of expected population growth trends in the 21st Century:

July 14, 2020

Reposting of press release published by The Lancet

  • By 2100, projected fertility rates in 183 of 195 countries will not be high enough to maintain current populations without liberal immigration policies.

  • World population forecasted to peak in 2064 at around 9.7 billion people and fall to 8.8 billion by century’s end, with 23 countries seeing populations shrink by more than 50%, including Japan, Thailand, Italy, and Spain.

  • Dramatic declines in working age-populations are predicted in countries such as India and China, which will hamper economic growth and lead to shifts in global powers.

  • Liberal immigration policies could help maintain population size and economic growth even as fertility falls.

  • Authors warn response to population decline must not compromise progress on women’s freedom and reproductive rights.

This means that for a more complete look at what is going on in the world and what the future of the Green New Deal might look like, we are going to have to expand the Venn diagram from Figure 1. We will need to take into account both the COVID-19 pandemic and the expected changes in world population. So now we need at least 5 circles in the diagram. That is a lot to keep track of.

As the Venn diagram shows, the climate, jobs, and equity all overlap. The other two do as well. Next week I will try to expand the diagram to include the missing components of the pandemic and projected global population changes.

But not all of the circles have the same time dependence. When we talk about climate change and global population changes, our time span is the rest of the century. When we speak about jobs and equity, we are looking at the present and near future. As for the pandemic, we expect it to either disappear or at least become more manageable within the next year or two.

For now, we saw some of the overlap between the coronavirus and climate change over the weekend. Figure 2 shows the coronavirus distribution in the US. In my morning newspaper (the NYT) I see the updates to this map every day. I saw it in April when I was in the middle of the epicenter of the pandemic and I see it now as the virus moves to the Southeast and the West. Florida, Texas, and California are now the biggest hot spots.

Coronavirus hot spots in the US

Figure 2Coronavirus cases in the US from this weekend

But the pandemic is not the only emergency that these states are facing. The year’s first hurricane hit Texas this weekend. Figure 3 illustrates its trajectory. Authorities advised people in southeast Texas to evacuate. How do you evacuate while maintaining social distancing, though? How will the pandemic impact the rescue operations needed to mitigate the impact of the hurricane?

Figure 3projected path of Hanna, the first hurricane of 2020 (from Friday, July 24, 2020)

Climate change is amplifying both the frequency and the intensity of hurricanes and tornadoes all over the world. The same holds for fire as droughts increase. Arizona has seen an intersection between fires and the coronavirus. One fire raged in Tucson, Arizona for nearly two months, eating up almost 120,000 acres, even as Arizona’s coronavirus cases skyrocketed. These interactions will only amplify as long the pandemic persists.

Meanwhile, in politics, Joe Biden has endorsed the Green New Deal in every aspect but its name. An article in The Guardian elaborates:

On Tuesday, Joe Biden did something unprecedented for a Democratic candidate assured of nomination: he moved left. In a speech delivered from Wilmington in his home state of Delaware, Biden unveiled the most ambitious clean energy and environmental justice plans ever proposed by the nominee of a major American political party. The plans, which the Biden campaign described to reporters as “the legislation he goes up to [Capitol Hill] immediately to get done,” outline $2tn in investments in clean energy, jobs and infrastructure that would be carried out over the four years of his first term.

Forty percent of these investments would be directed to communities of color living on the toxic edge of the fossil fuel economy – communities that have also been among the most devastated by the coronavirus pandemic. Biden proposes to pair these investments with new performance standards, most notably a clean electricity standard that would transition the United States to a carbon pollution-free power sector by 2035.

 To get humanity through the rest of the century we will need strong leadership and commitments to mitigation (especially regarding climate change). The next few months will provide important yardsticks for how hard those goals will be to accomplish. We should be looking at two major events this autumn: the US presidential elections and the global COVID-19 situation. Specifically, we will be watching how the first wave of global infection begins to subside and when the (almost) inevitable second wave will show up. It’s likely that the latter will coincide with flu season, which might make everything much more complicated. The outcome of both events will depend on us (adults) and the degree of commitment that we have to our children and grandchildren.

The US election is especially important given the country’s central global roles in both economics and military power. We need to try to mitigate global disasters such as climate change, the pandemic, and projected shifts in population demographics. Denying the existence of these threats is the opposite of effective.

Joe Biden’s commitment to the spirit of the Green New Deal gives me hope. This is especially true in contrast to the despair that President Trump’s repeated denial of climate change has wrought. Two trillion dollars in four years looks like a lot of money at first. But the US has a GDP/capita of more than $20 trillion and the dollar so dominates global currency that up until now, we have almost been able to print money at will under emergency conditions.

In light of those facts, $4tr/4 years is petty cash. For reference, the US congress immediately approved the more than $2-trillion-dollar CARES Act, and followed it up with a similar chunk of money. The EU has also been working to put forth aid money. The rest of the world is trying to follow to the best of its ability. The amount of money in Biden’s Green New Deal proposal shouldn’t be controversial. The timing of the changes it lays out leaves plenty of ground for productive negotiation without endangering the future.

Next week I will look more at how the components in the Venn diagram above intersect with the pandemic and projected global population changes. I hope to emphasize the societal connections between equity and jobs, as well as how they tie in to other global calamities.

Posted in administration, Climate Change, politics, Sustainability, US | Tagged , , , , , , , , , , , , , , , , , , , , , , , , , , , , , , , , , , , , , , , , , , , , , | 1 Comment

Energy Saving on Specific Campuses

There are two branches to making campuses more sustainable: reducing carbon emissions (with the objective of zero carbon by mid-century) and increasing resiliency in the energy supply. We have dealt with both objectives throughout this blog. One campus’ conversion to zero carbon emissions is a small-scale part of the stuttering global energy transition. The goal is to mitigate climate change by both substituting sustainable energy sources for fossil fuels and increasing energy efficiency. With this shift comes the need to increase our energy storage. Given the inconsistent energy availability of renewables, we must be able to store at least as much as the expected required load.

Climate change worsens extreme weather events and makes them more frequent. (Note that climate change does not create these events; it fosters the environment that does.) That means we are facing prolonged heat waves and major storms. Both of these can overload power grids. We therefore need to increase the resiliency of our energy availability to counter such predicted major disruptions. One way to do so is to redistribute some of our energy away from centralized grids toward smart grids and micro—or-semi-independent—grids.

I have consistently said that we can use the energy transition on campus as a hands-on laboratory tool in teaching. We can, and should, engage students in major practical activities so that they can apply these skills post-graduation.

The National Renewal Energy Laboratory (NREL) has summarized state-of-the-art campus conversions to zero carbon emissions:

University Campus Goals

The higher education sector spends more than $6 billion on annual energy costs and totals an area of about 5 billion square feet of floor space (Better Buildings 2018). Universities are among the leaders in the United States in setting goals such as zero energy or carbon neutrality. The primary origin of significant U.S. university leadership on campus emissions reductions was the American College & University Presidents’ Climate Commitment (ACUPCC). The ACUPCC was launched in 2007, and 336 institutions had joined the initiative by September 15, 2007 (Second Nature 2017). As of early 2018, more than 650 institutions have signed up, with representation from all 50 states. Several university systems have pledged climate goals for their entire university system. For example, the University of California (UC) has pledged to become carbon neutral by 2025 (buildings and vehicle fleet), becoming the first major university system to commit to this goal (University of California 2013). Further, several university campus energy and sustainability ratings have emerged, such as the Sierra Club’s Cool Schools (Sierra Club 2017). One of the most rigorous sustainability ratings is the Association for the Advancement of Sustainability in Higher Education Sustainability Tracking, Assessment & Rating System (STARS). STARS is a self-reporting system that provides a bronze, silver, gold, or platinum sustainability rating. By June 2018, more than 900 institutions had registered to use STARS, but only four campuses have achieved the STARS platinum rating: University of California, Irvine (UCI); Stanford University; Colorado State University; and the University of New Hampshire (AASHE 2018). As the largest energy users at universities are buildings and infrastructure, with labs and food service as the highest energy using sectors, this paper focuses on the energy use of buildings and infrastructure (Better Buildings 2018).

The Japanese corporation Hitachi has recognized US schools’ work in sustainability and their potential for leading the way in non-centralized energy distribution:

North America leads all other regions of the world in terms of annual capacity and revenue in this customer segment. Total capacity in 2015 was 219.7 MW and is expected to grow to almost 1.2 GW annually by 2024 with annual revenue for this segment in North America expected to reach $4.2 billion by 2024. College/ university campuses are particularly attractive microgrid candidates due to their large electric and heating loads. Further, they frequently have their own electric and thermal infrastructure and typically have only a few points of interconnection to the utility, making projects technically easier and less expensive. Universities have found that maintaining power supply during a grid outage is an important point for many fee-paying parents in the USA. Further, the ability for microgrids to help address the aggressive sustainability targets that many colleges/universities have adopted as well as using the microgrids as a research and educational platforms are important considerations. Example microgrids include those at the University of California, San Diego; New York University; Fairfield University; and Princeton University.

New York University and the University of Texas at Austin have each had success in their attempts to integrate both trends.

NYU:

“Here’s why the lights stayed on at NYU while the rest of Lower Manhattan went dark during Hurricane Sandy” 

New York University continued to buzz and glow throughout the night. The reason?

NYU runs on a microgrid, a semi-independent energy system able to generate and store its own power.

When the storm hit, NYU kept humming along.

Cut off from a central utility, it continued to produce its own electricity.

“If you take a look at the blackouts that were in the New Jersey, New York, Connecticut realm of Superstorm Sandy, the only places that were up and operating were those places that had a microgrid,” said Steve Pullins, Vice President at Hitachi Microgrid Solutions.

In an effort to build more resilient power systems and provide more low-carbon energy, the New York State Energy Research and Development Authority is awarding $40 million for the design and construction of microgrids across the state. Microgrids can help communities keep the lights on during the next Sandy, all while providing cheaper and cleaner power than the local utility.

New York state is reforming its energy system so that utilities have a stake in renewable power. The New York Public Service Commission just approved a plan that incentivizes utilities to work with developers to set up microgrids. Under the new structure, utilities stand to earn money by the making systems more efficient and resilient. Speaking at a conference in Manhattan last month, New York Energy Czar Richard Kauffman said, “The good news is that there are going to be a lot more microgrids.”

University of Texas at Austin:

The University of Texas at Austin houses what is often described as the most integrated and largest microgrid in the US, a model for saving energy and money.

Built in 1929 as a steam plant, the facility has evolved to provide 100 percent of the power, heat and cooling for a 20-million square-foot campus with 150 buildings.

The university is known for its premiere research facilities, which demand high quality, reliable power.  And its microgrid has delivered with 99.9998 percent reliability over the last 40 years.

The facility features a combined heat and power plant that provides 135-MW (62-MW peak) and 1.2 million lb/hr of steam generation (300k peak).

The system also includes 45,000 tons of chilled water capacity in four plants (33k peak); a 4 million gallon/36,000 ton-hour thermal energy storage tank; and six miles of distribution tunnels to distribute hot water and steam. The microgrid engages in real-time load balancing for steam and chilled water. Since 1936, natural gas has fueled the energy plant.

… The plant’s CHP system allows it to recover heat energy that a conventional plant would waste – even a state-of-the-art supercritical unit might discard 40 percent of the heat it produces, Ontiveros said. But a CHP system extracts the heat from a steam turbine generator and re-uses it to heat the campus. Leveraging the existing distribution system captures more efficiency in cooling technology.

“We use all the tricks. We can do turbine inlet-air cooling, thermal storage, load shifting, load shedding. It’s all built into our load control system. We produce our all electric cooling at probably 40 percent (of the cost) that the rest of the world does,” he said.

The campus has become so highly efficient that despite its expansion it now uses no more fuel – and emits no more carbon dioxide emissions – than it did in 1976.

“The overall plant efficiency in those days was 42 percent; we’re at 86 percent now,” Ontiveros said.

Net Zero

While some microgrids sell power or services to the grid, UT Austin does not. This is because its energy plant is sized to be net zero, to produce only what it needs.

The university holds a 25-MW standby contract with the local utility for back-up power if equipment fails, at a cost of about $1 million annually, a small portion of the plant’s $50 million annual operating budget. Other than that, UT Austin operates with autonomy from the central grid.

“I see ourselves as at high risk anytime we are on the grid because we are more reliable than them,” Ontiveros said.

Energy reliability is extremely important to the university. Eighty percent of the campus space is dedicated to research valued at about $500 million.

“If a professor loses a transgenic mouse with 20 years of research built into it, that’s a nightmare. That’s what keeps me up at night,” Ontiveros said.

Another paper, “Living labs and co-production: university campuses as platforms for sustainability science,” does a great job explaining the concept of treating a campus as a learning laboratory.

I will probably spend the rest of my working time trying to push my university forward in this direction.

Posted in Climate Change, Education, Electricity, Energy, Sustainability | Tagged , , , , , , , , , , , , , , , , , , , , , , , , , , , , , , , , , , , , , | 2 Comments

School Energy Use: Smart Grids & the Long Term

Last week I outlined my school’s effort to measure its energy use during the COVID-19 lockdown. As I mentioned there, I got the data following my (approved) visit to the campus. While I was there, I realized that even without students, faculty or staff, the campus is still using about 80% of our pre-COVID-19 energy. Our Director of Environmental Safety addressed my observations and said that the school is working to minimize energy use when possible. However, she said that this work is done building by building by maintenance staff.

I believe that all these adjustments (e.g. A/C, lights) can be done electronically (and remotely). By coordinating all such matters in one place, this remote management could be a giant step in mapping and accelerating our campus-mandated conversion to zero carbon emissions status by mid-century. It would also save money and serve as an opportunity for our students to practice applied energy transitions that they can replicate in other facilities after finishing school. In my view, it’s never a bad thing to provide our students with preparation for the post-graduation job market.

Meanwhile, given that our campuses are already closed, it makes sense to take this time to plan for future contingencies. In terms of energy use, we need to learn how to convert the campus from a passive energy user to a participant in the energy distribution and delivery processes. This goal mirrors one of the campus’ missions: encouraging application of learned concepts in the real world.

I have discussed the two main terms that describe energy distribution—smart grids and microgrids—before. The figure below shows microgrids integrated with a smart grid:

smart grid

Schematic diagram of energy distributed through a smart grid and microgrids

National Renewal Energy Laboratory (NREL) defines a smart grid in this way:

[A] Smart grid is a nationwide concept to improve the efficiency and reliability of the U.S. electric power grid through reinforced infrastructure, sophisticated electronic sensors and controls, and two-way communications with consumers.

There are two parts to the smart grid concept:

  • Strengthen the transmission and distribution system to better coordinate energy delivery into the grid.
  • Better coordinate energy delivery into the grid and consumption at the user end.

Many large research campuses have already begun to build smart grids. Most operate electricity grids that include power generation; load control; and power import, distribution, and consumption. Because of their size and affiliation with electricity consumers on campus, plant managers often have better central management and greater opportunities to improve distribution and end-use efficiency than most electric utilities. Furthermore, most campuses already have two-way communications through interconnected building automation systems. Campus plant managers use these communications for energy management and load shedding, which are among the top goals of utility smart grid projects.

Ultimately, research campuses may play a central role in developing and testing smart grid concepts ultimately used to improve the national utility grids. The U.S. Department of Energy (DOE) is investing approximately $4 billion to encourage the development of smart grid technologies. More information regarding the demonstration projects can be located at the Smart Grid Projects website.

New York State, through its NYSERDA agency, is heavily involved in both research and some implementation of the concept. Here is an excerpt from my July 2, 2019 blog:

Other key issues, such as the “DG Hub,” were new to me; I needed some background:

The NY-Solar Smart Distributed Generation (DG) Hub is a comprehensive effort to develop a strategic pathway to a more resilient distributed energy system in New York that is supported by the U.S. Department of Energy and the State of New York. This DG Hub fact sheet provides information to installers, utilities, policy makers, and consumers on software communication requirements and capabilities for solar and storage (i.e. resilient PV) and microgrid systems that are capable of islanding for emergency power and providing on-grid services. For information on other aspects of the distributed generation market, please see the companion DG Hub fact sheets on resilient solar economics, policy, hardware, and a glossary of terms at: www.cuny.edu/DGHub.

I was particularly interested in a joint-published work by NREL (National Renewable Energy Laboratory) and CUNY, which offered a detailed analysis of the effectiveness of solar panel installations in three specific locations in New York. The paper included a quantitative analysis of the installations’ contributions to the resilience of power delivery in these locations. Below is a list of the different models that they have tried to match to the locations. The emphasis here is on the methodology and what they are trying to do, not on the sites themselves. REopt is a modeling platform to which they try to fit the data:

CCNY (City College of New York), one of CUNY’s major campuses, has an important research presence in the effort:

The CUNY Smart Grid Interdependencies Laboratory (SGIL) at the City College of New York is a research group focused on: the rising interdependencies between the power grid and other critical infrastructures; power system resilience; microgrids; renewable energy; and electric vehicles. We use our expertise with power system fundamentals, control, operation and protection, as well as analytical and machine-learning based tools to contribute to the national call for a greener, more efficient, reliable and resilient power grid.

Microgrids are localized grids that can contribute to a main grid or a smart grid. They can also operate completely independently. Likewise, microgrids themselves can be “smart.” Thus, they might be an important initial contribution to electric power delivery to smart grids, adding resilience to that power delivery. Portland’s recent PGE effort makes a great example.

Microgrids are also contributing to Europe’s energy transition:

According to the new report, titled New Strategies For Smart Integrated Decentralised Energy Systems, by 2050 almost half of all EU households will produce renewable energy. Of these, more than a third will participate in a local energy community. In this context, the microgrid opportunity could be a game changer.

The report describes microgrids as the end result the combination of several technological trends, namely, rooftop solar, electric vehicles, heat pumps and batteries for storage. The key is that these technologies are decentralized—they can easily be owned by consumers and cooperatives in local systems.

A team at the University of Calgary in Canada is also developing mobile microgrids that can be used for safety and resiliency.

The other branch of an effective transition to more efficient energy use is obviously the change in source. We need to replace some of the conventional power sources with sustainable ones such as solar and wind. But these bring their own issues. Sustainable energy sources depend on the weather and the availability of light and wind. Nor does this variability coincide with the variability in energy usage. Given that weather is mostly unpredictable, it is vital that we synchronize weather and load.

Universities are the ideal places to experiment with these technologies before they reach the larger market. I’ll look into some examples soon.

Posted in Climate Change, Electricity, Energy, Sustainability | Tagged , , , , , , , , , , , , , , , , , , , , , , , , , , , , , | 2 Comments

Using COVID-19 to Measure Energy Consumption at Brooklyn College

I am on the faculty at both CUNY Brooklyn College and the CUNY Graduate Center in Manhattan. CUNY is a huge institution:

The City University of New York is the nation’s largest urban public university, a transformative engine of social mobility that is a critical component of the lifeblood of New York City. Founded in 1847 as the nation’s first free public institution of higher education, CUNY today has 25 colleges spread across New York City’s five boroughs, serving 275,000 degree-seeking students of all ages and awarding 55,000 degrees each year.

I am scheduled to teach three undergraduate courses in the Fall 2020 semester, all of which focus on climate change. All three include both background and research components. I am also directly involved in implementing Brooklyn College’s mandate to become a carbon neutral facility by mid-century. Two of the three courses will research the similar NY State and City mandates to convert the state to carbon neutral by the same time (see last week’s blog and the June 418, 2019 blogs).

We still don’t know how next semester will play out. Whether we teach remotely or on campus (or alternate between the two) will depend on higher authorities—especially the status of the coronavirus within New York. We are using the summer to improve our remote teaching skills.

I want to look here at how we can use the lockdown to better understand Brooklyn College’s energy structure. Fortunately, we already have some data that can be of use.

During my single approved visit to the campus since the mid-March lockdown—to collect some papers from my office and that of my wife—I was struck by the beauty of the empty campus on a lovely spring day. I was also struck by the wasteful mid-day use of air conditioning and lights with hardly anybody around.

I forwarded my impressions to our Director of Environmental Safety and she responded that she was aware of the issue. She said that, “Facilities did go through the buildings and turn things (AC, lights) off where possible/access. However, some building utilities could not be shut due to IT closets, animals, chemicals, etc…” The CUNY central Office of Sustainability and Energy Conservation immediately followed her statement with a short communique including three graphs of Brooklyn College and CUNY energy use from mid-March through the end of May. I am including both the graphs and the attached explanations here:

Figure 1 – Brooklyn College energy consumption during the lockdown

Figure 2 –Brooklyn College reduction in base and peak loads of electricity used during the lockdown

All CUNY colleges achieved reductions in Base load and Peak load Demand during COVID-19 reduced occupancy. These graphs show reductions from a March (pre-COVID) Baseline. The Baseline is an average of Demand (kW) over the first 2 weeks of March.

Here’s what you need to know about peak loads and base loads:

Peak load is a period of time when electrical power is needed a sustained period based on demand. Also known as peak demand or peak load contribution, it is typically a shorter period when electricity is in high demand.

Base load, on the other hand, is the minimum amount of electrical demand needed over a 24-hour time period. Also known as continuous load, base load requirements do not change as much.

Figure 3 shows the schematics of base load and peak load on a daily basis:

Figure 3 Illustration of base load, intermediate, and peak load

The base load roughly corresponds to nighttime energy use and anything above it corresponds to intermediate load or peak load. However, weekends in many business places see demand that more resembles an increase in base load throughout the day and corresponding reduction (or shift) in peak load with an overall reduction in load. In that sense, the coronavirus lockdown should resemble most businesses’ weekend demands.

All three figures show power use. We convert power use to energy use by multiplying the power by the time; we can do this by measuring the areas under the curves. That’s much easier to do with the base load than with the peak load (the curve is usually simpler). In order to calculate the average reductions in base loads and peak loads throughout the time periods, we add the reduction %s in Figure 2, and divide the sum by the number of periods. The results come out as a reduction of 17%/week for the base load and 21%/week for the peak load at Brooklyn College.

We can then compare these to the corresponding numbers in NYC at the zenith of the pandemic (April 16th—see the June 2nd blog). The reduction in electricity use during that day compared to the amount used on the same day in 2019 was approximately 20%. Considering the differences between the two sets of data (baselines of one year vs. several months prior, datasets of one peak day for NYC vs. 6 weeks average for Brooklyn College), the similarities are almost too good to be true.

One of the focal points for students analyzing these kinds of data is to figure out what actual activities are responsible for the base load and the peak load and where we can institute saving. For instance, can we identify how much power goes toward A/C in nonessential buildings?

Next week, I plan to put forward some suggestions on how we can save energy once we get the data.

Posted in Electricity, Energy | Tagged , , , , , , , , , , , , , , , , , , , , | Leave a comment

How to Use COVID-19 to Make your Workplace Greener

The “lonely” Brooklyn College in June

This is the beautiful campus where I teach. There are almost no students; it looks lonely. Granted, I took the photograph on Sunday, June 21st, a day when the campus likely wouldn’t look much different under ordinary circumstances. It was the first time that I visited since the beginning of lockdown in mid-March. Like most schools in the country, Brooklyn College is still in lockdown; we can expect to see a similar picture through at least the beginning of the fall semester. Over this period, we will continue with distance teaching/learning. We are definitely getting better at it—both on the students’ part and that of the faculty. But the experience is different—all of us miss the mix of formal and informal interactions with each other that are an essential part of the college experience.

The NYT thinks this might become the new normal. Its article, “’We Could Be Feeling This for the Next Decade’: Virus Hits College Towns,” predicts some long-term impacts that the pandemic will have on college campuses.

Today, I would like to do something somewhat rare: emphasize an important advantage of this new reality.

In previous blogs (June 418, 2019) I described New York City and State’s detailed legislation regarding how to bring the state to carbon neutral by mid-century. This goal approximately conforms with the Paris agreement’s commitment to limit climate change to a temperature rise of 2oC by that time. My June 18, 2019 blog outlined my suggestions about how Brooklyn College (and other institutions) could use these requirements as a teaching moment for its students. By incorporating our students in our implementation of this transition, we could impart certain experiences that might be marketable in their post-graduation job searches.

Meanwhile, the COVID-19 pandemic and resulting lockdown have provided us with a unique opportunity to directly differentiate between student-driven and infrastructure-driven energy use on campus. This opens the door for a more detailed understanding of how we can reduce the energy needed to serve the same student population.

As I mentioned in the June 2019 blogs, NY State and City regulations do not directly target schools. Rather, they tackle buildings, businesses, transportation, and other large energy users. The emphasis is on carbon emissions. The two main tools to achieve the desired reductions in carbon emissions are: reducing the amount of energy used and transitioning the sources of that energy to non-fossil fuel sources (solar, wind, hydro, nuclear, etc.).

In other words, simply replacing energy sources and updating the corresponding storage capacity is not the full answer. We must also examine how we use energy, especially if that comes in the form of electricity use. Our energy saving should directly scale with our number of users. COVID-19 and the resultant shutdowns give us an important reference for how much energy we use to support the infrastructure with almost no individual users.

In my June 2, 2020 blog, I gave an anecdotal example of the consumption of electricity in New York City during the pandemic. In spite of the increase in domestic consumption because of the lockdown, the total electricity consumption has decreased relative to the pre-pandemic period. This is a direct result of the decrease in electricity consumption in the business sector. That power draw is now restricted to the electricity needed for immediate infrastructure use. Looking at this, my college hopes to find a way to minimize such infrastructure energy requirements without affecting the energy needs of its users.

The not so simple solution that is emerging—which will be the focus of my next semester—is localizing the electricity infrastructure and limiting energy use to absolute essentials. We can achieve this in part by more extensively incorporating microgrids into our local electrical sourcing.

I have written extensively on microgrids throughout the more than 8 years of this blog. You can search for the term for previous entries.

Microgrids are not new to CUNY. I have outlined their general definition as well as explained how they relate to my school. From the July 2, 2019 blog:

Electrical systems that can connect and communicate with the utility grid that are also capable of operating independently using their own power generation are considered microgrids. Single buildings or an entire community can be designed to operate as a microgrid. Microgrid infrastructures often provide emergency power to hospitals, shelters or other critical facilities that need to function during an electrical outage. Microgrids can include conventional distributed generators (i.e. diesel or natural gas gensets), combined heat and power (CHP), renewable energy such as PV, energy storage, or a hybrid combination of technologies. If inverters are used, such as for a resilient PV system, they must be able to switch between grid-interactive mode and microgrid (intentional island) mode in order to operate as a microgrid. For large microgrid systems that include distributed energy resources (DER), a supervisory control system (a system that controls many individual controllers) is typically required to communicate with and coordinate both loads and DER.

Obviously, CUNY is not the only institution interested in microgrids. A piece from the Journal of Higher Education from January 2018 summarizes the more general attention:

The Department of Energy defines a microgrid as: “a local energy grid with control capability, which means it can disconnect from the traditional grid and operate autonomously. A microgrid, for the most part, operates while connected to the traditional grid but can break off, or island itself, and operate on its own. It can be powered by distributed generators, batteries and renewable sources.”

Essentially, these energy systems are capable of balancing captive supply and demand resources to maintain stable service within a defined boundary.

… Schools such as UC San Diego, MIT, Montclair, Princeton, and Santa Clara University, have stepped up to the call for greater resiliency. Although the microgrid industry is relatively young, it’s popularity is growing in higher ed …

Resiliency is another huge draw for universities, especially in the wake of Hurricane Sandy in 2012, and most recently, the devastation from Harvey, Irma, and Maria.

Brief brownouts, let alone blackouts, are highly detrimental in the event of extreme weather, where universities are looked upon to be strongholds for the community. The threat of cyber attacks is yet another push. The ability to operate independently from the central power grid is invaluable in the face of disaster, as proved by Princeton’s resilient response while half a million people lost power during Superstorm Sandy.

I have also looked into how certain developing countries are using microgrids:

We tried to monitor this process through a documentary film; to accomplish this we needed some help but the result, along with the full list of contributors, can be seen in the short film “Quest for Energy.”

The film illustrates the initial delivery of electricity in the small town of Gosaba. This delivery comes by way of a microgrid that runs through some of the main streets in town. Here, the microgrid doesn’t function as an additional, supplemental aspect of the main grid. In fact, since in this case, the microgrid is the only grid, in a sense, it resembles the main grid in the US more than 100 years ago.

My school has collected some preliminary data on our use of electricity during COVID-19 shutdowns. I will try to analyze these in next week’s blog and draw some conclusions about applying the methodology in the larger context of more general applications outside of the home.

Posted in Climate Change, Electricity, Energy, Sustainability | Tagged , , , , , , , , , , , , , , , , , , , , , , , , , , , , , , , , , | 1 Comment

Extreme Weather & the Energy Transition

All over the world, people are getting tired of the lockdowns and frozen economies, and yet the virus is still on the rise in many places. As countries and states reopen, carbon emissions are resurging. Here is what that means in terms of the transition between fossil fuels and sustainable energy sources:

As countries begin rolling out plans to restart their economies after the brutal shock inflicted by the coronavirus pandemic, the three biggest producers of planet-warming gases — the European Union, the United States and China — are writing scripts that push humanity in very different directions.

Europe this week laid out a vision of a green future, with a proposed recovery package worth more than $800 billion that would transition away from fossil fuels and put people to work making old buildings energy-efficient.

In the United States, the White House is steadily slashing environmental protections and Republicans are using the Green New Deal as a political cudgel against their opponents.

China has given a green light to build new coal plants but it also declined to set specific economic growth targets for this year, a move that came as a relief to environmentalists because it reduces the pressure to turn up the country’s industrial machine quickly.

These are characteristic approaches. Europe, more than ever, is trying to accelerate the transition away from fossil fuels. The US federal government continues in its denial of the necessity to do so, and China is still vacillating.

But the US government does not always speak for its residents or industries. Four days ago, the NYT ran an article about how climate change is becoming an important consideration in financing projects:

Changes to the housing market are just one of myriad ways global warming is disrupting American life, including spreading disease and threatening the food supply. It could also be one of the most economically significant. During the 2008 financial crisis, a decline in home values helped cripple the financial system and pushed almost nine million Americans out of work.

But increased flooding nationwide could have more far-reaching consequences on financial housing markets. In 2016, Freddie Mac’s chief economist at the time, Sean Becketti, warned that losses from flooding both inland and along the coasts are “likely to be greater in total than those experienced in the housing crisis and the Great Recession.”

Threats of large climate change-induced fires are starting to have similar impacts on the financial industry. As climate change continues to intensify extreme weather phenomena and make them more frequent, it would not be surprising to see more such concern in financial sectors.

Meanwhile, in correlation to these shifts, investments in renewables are beginning to surpass those in oil. So too has renewable energy production surpassed that of coal in the US:

Solar, wind and other renewable sources have toppled coal in energy generation in the United States for the first time in over 130 years, with the coronavirus pandemic accelerating a decline in coal that has profound implications for the climate crisis.

Not since wood was the main source of American energy in the 19th century has a renewable resource been used more heavily than coal, but 2019 saw a historic reversal, according to US government figures.

Coal consumption fell by 15%, down for the sixth year in a row, while renewables edged up by 1%. This meant renewables surpassed coal for the first time since at least 1885, a year when Mark Twain published The Adventures of Huckleberry Finn and America’s first skyscraper was erected in Chicago.

Are these changes convincing major energy companies to shift their investments? Not yet:

Investments in solar and wind energy projects by the world’s oil majors over the next five years are expected to reach $17.5 billion, a Rystad Energy analysis finds. But a closer look at the numbers reveals that some $10 billion, or 57% of the amount, is expected to be invested by a single company, Equinor, the only investor whose majority of greenfield capex will be towards renewable energy.

Equinor, the Norwegian state-controlled energy giant, will drive renewable investment among majors, spending $6.5 billion in the next three years to build its capital-intensive offshore wind portfolio. We do not expect this forecast to be heavily affected by the fluctuating oil price or capex cuts, as much of the company’s renewable portfolio is already committed, such as the massive Dogger Bank offshore wind project in the UK.

What about the politics?

Is the world at large (aside from Europe, the US, and China) ready to adapt some of the lessons of the pandemic to try to mitigate the ongoing climate change disaster? Among the 10 most populous countries that make up roughly 60% of the total global population (see my May 5, 2020 blog about their pandemic levels), the loudest anti-climate change mitigation voices are those of the presidents of the US and Brazil. We rarely hear much from the other 8 countries. Most of the mitigation-supporting voices come from the European Union, the UK, and the many small countries that climate change threatens directly.

Our presidential election is scheduled for November. This election will likely decide the US’s attitude to climate change going forward. Please make sure you vote! If the federal approach to the problem were to change, the US could potentially match Europe in its commitment to mitigation.

Posted in Climate Change, Extreme Weather, Sustainability, Trump, US | Tagged , , , , , , , , , , , , , , , , , , , , , , , , , , , , , , , , , , | 3 Comments