What does it mean for oil companies to shift toward being “greener”? How can we measure that change? More than 8 years ago, I talked about how we can use the amount of unextracted fuels as a marker for this shift (July 17, 2013 blog):
The Security and Exchange Commission (SEC) made an administrative decision to categorize untapped oil reserves as part of the capital value of a company, for accounting purposes; this decision can be reversed through an administrative order. In reality, these reserves are no more capital than would be the “good ideas” of the company’s staff scientists. They contribute to the capitalization process through good name, track records, etc., but do not add to the explicit pricing or marketability of the good idea. If the accounting rules were changed, so as to remove those reserves from the capitalization appraisal, the company would still retain the ownership and exploration rights of the real-estate in which the reserves are buried, but the reserves would only factor into the capitalization when they were ready to be marketed. The assessment of the value of this real estate would, instead, follow the same objective procedures that other commercial real estate properties enjoy. Once we put a “cap” on extraction, if the market were to exceed this “cap,” the price of the real estate would rise, thus benefiting the company, and rendering moot the need to use its resources to oppose the “cap.” This is an example of a situation where a change in the status quo could potentially benefit almost all parties.
Essentially, oil companies claim the value of oil on their land, even if it hasn’t been extracted. If you limited how much they could extract in the future, it would have major effects on their valuing system.
I haven’t heard anything further about that particular strategy since that time but an alternative approach might be to check their expansion capability by limiting exploration for new reserves.
As it stands, it does not seem like either has been acted upon. Figure 1 shows that oil companies have only cut back on their exploration efforts when the price of oil has fallen, making the ventures less economically feasible. In other words, it’s not because they’ve had a major change in philosophy.
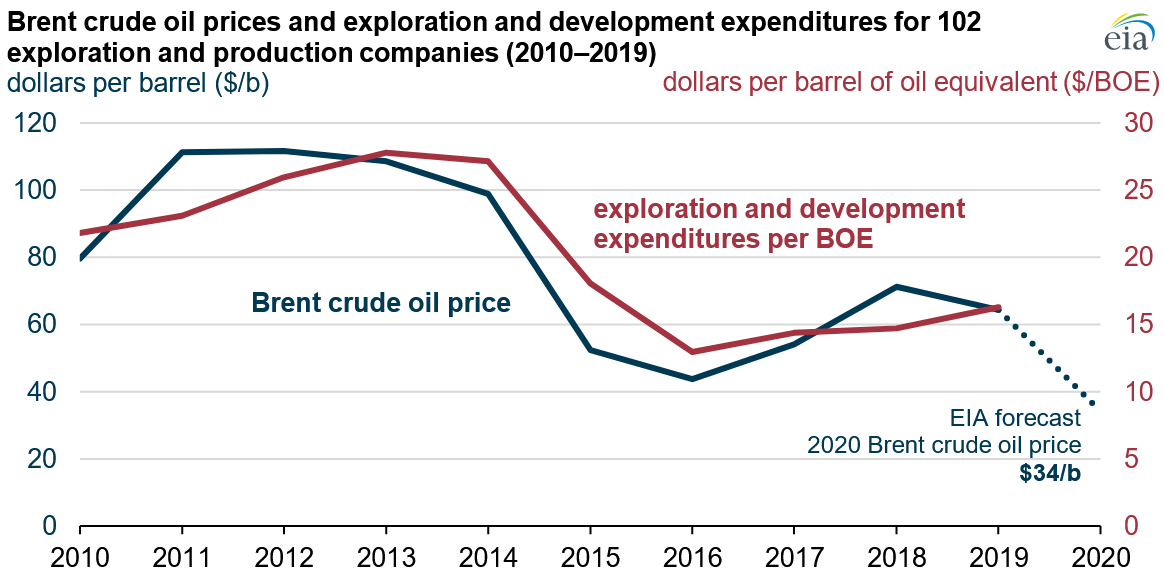 Figure 1 – Price of oil vs. new exploration and development
An alternative way to shift toward sustainability is to do what a German utility did at the end of 2014 (see my December 9, 2014 blog). Below is a citation from an article in The Economist that I used in that blog:
For many Germans, E.ON, the country’s biggest utility, is a symbol of stability. But on November 30th it surprised by announcing it would split itself up. In 2016 it will float a new company which will include its power generation from nuclear and fossil fuels, as well as fossil-fuel exploration and production. The rump—which will keep the E.ON brand—will make money from renewable energy, distribution and ‘customer solutions’, a grab-bag of offerings such as advice, smart-metering and the like. The firm’s boss, Johannes Teyssen, said that as a sprawling integrated utility E.ON could only be ‘mediocre’. Two focused ones would do a much better job.
That kind of change in business model is a bet that staying in the energy field but moving to sustainable energy sources will be so financially rewarding in the long-term that it is worth rebranding their current company now.
More recently, Royal Dutch Shell sold off its holdings in the Permian Basin in Texas and New Mexico:
Houston — Royal Dutch Shell sold its oil and gas production in the Permian Basin, the biggest American oil field, to ConocoPhillips for $9.5 billion in cash on Monday.
The deal marks a turning point for Shell, which had put considerable effort into developing the 225,000-acre field since buying it from Chesapeake Energy nine years ago, expanding its production to about 200,000 barrels a day.
The sale is the latest sign that Shell, like other European oil companies, is under pressure to sell off oil and gas production and move toward producing cleaner energy in response to growing concerns about climate change among investors and the general public.
I don’t know yet who the buyers are and we can only speculate about what Royal Dutch Shell will do with the $9.5 billion they got from the sale but they seem to be acting based on the external motivators I discussed last week.
Perhaps, the only really productive scenario would be if oil companies developed the technology to not only efficiently capture the carbon dioxide produced by burning fossil fuels but also repurpose that carbon dioxide for something useful. This would allow them to extract and sell fossil fuels to supply societal energy needs but create a much smaller carbon footprint. Several companies are now working hard to convince the government to finance such a system:
Over the last year, energy companies, electrical utilities and other industrial sectors have been quietly pushing through a suite of policies to support a technology that stands to yield tens of billions of dollars for corporate polluters, but may do little to reduce greenhouse gas emissions.
Some environmentalists say that is exactly what is happening. They argue that the money being appropriated by Congress is likely to allow polluting power plants and petrochemical facilities to continue operating longer into the future, while doing little to reduce the nation’s emissions. They also say that, even if the technology is able to cut carbon pollution from petrochemical plants or refineries, it won’t address other toxic chemicals those operations send into communities that are home to many people of color. Electrifying industry and reducing the use of plastics and petrochemicals, these advocates argue, would be far cheaper and safer.
The most powerful forces pushing for carbon capture have been fossil fuel companies, which have promoted CCS for decades but have increased their lobbying and marketing for the technology in recent years as they have fallen under increased pressure to address climate change.
Carbon Capture and Storage (CCS) has operated on this planet for more than three billion years, in various forms of the photosynthetic process. Without our recent anthropogenic contributions, emissions, as reflected in the carbon cycle (see my March 25, 2014 blog) would balance with absorption, to reach an equilibrium. This worked until the beginning of the last century. We are now shifting the balance, and with it, triggering climate change. If oil companies could actually accomplish more efficient/effective CCS, it would be great but, as the article above points out, it would not be the whole solution.
As I have discussed in earlier blogs, perhaps the most popular (and easiest) method of enhancing carbon capture is planting more trees; it has become a common part of many commitments to shift to zero-carbon technology. It’s also a very important task. As much as (live) trees are known for their remarkable carbon capture, recently, some have argued that dying trees contribute more carbon dioxide than the burning of fossil fuels.
An alternative (or supplementary) activity is to chemically synthesize new fossil fuels by reacting the already emitted carbon dioxide with “green” hydrogen. For example, a team of researchers is attempting to synthesize methane (the main component of natural gas) from CO2 and renewable hydrogen.
Meanwhile, Iceland is taking big steps in direct air capture of its carbon.
In the next blog, I will try to explore some of the ways society may respond to the consequences if energy companies keeping their commitments and move toward renewables on the way to a carbon-zero society.


 Figure 1
  Figure 2