I started this series on February 20, 2018 to explore the IPAT identity. The last term within that identity that I have yet to cover includes the nature of the fossil fuels used. The popular perception is that use of coal is down while use of natural gas has risen. This blog examines this issue with the same set of countries that I have studied in the last few blogs.
As before, I am using statistical data from British Petroleum (BP). I will end this blog by citing BP’s short summary of how it views the nature of the energy transition that we are undergoing.
Next week I will conclude this series by using graphics from different sources to demonstrate the trends expressed in this series. I will also add BP’s regional summary of trends, including those within Africa, China and the US.
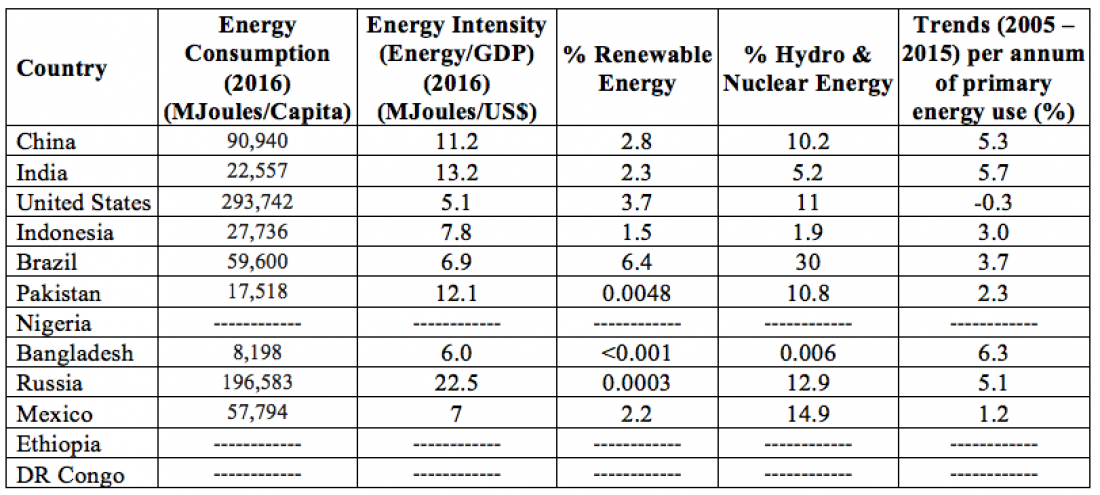
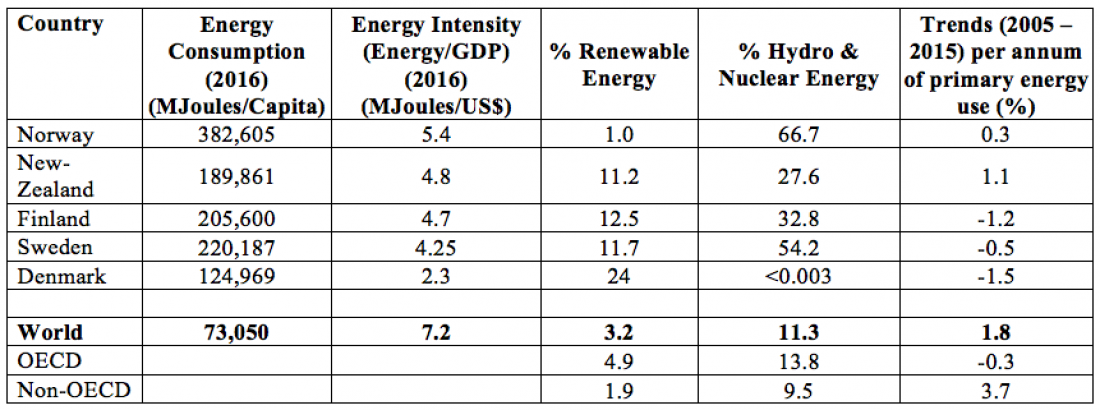
Table 1 illustrates trends in the use of coal and natural gas by the world’s twelve most populous countries (whose combined populations account for more than half the global total and the full spectrum of economic development). Table 2 includes the five much smaller, developed countries that we have used throughout this series as examples of sovereign states farther along in their energy transitions.
The data in both tables are expressed as percentages of the total primary energy use:
Table 1 – Indicators related directly to carbon emissions of the 12 most populous countries
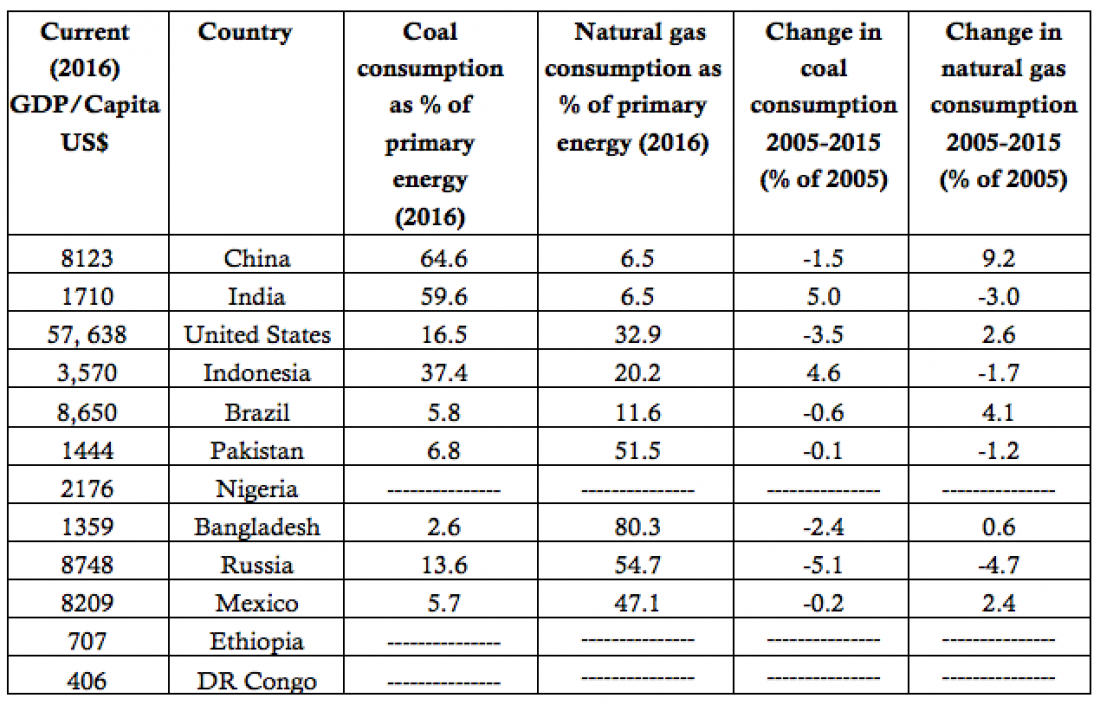
Table 2 – Same indicators as in Table 1 for the world and five small, developed countries that are ahead in their energy transitions

BP provides a summary of what it calls Energy Outlook based on present and past performances on its website:
BP Energy Outlook
The Energy Outlook explores the forces shaping the global energy transition out to 2040 and the key uncertainties surrounding that transition. It shows how rising prosperity drives an increase in global energy demand and how that demand will be met over the coming decades through a diverse range of supplies including oil, gas, coal and renewables.
The speed of the energy transition is uncertain and the new Outlook considers a range of scenarios. Its evolving transition (ET) scenario, which assumes that government policies, technologies and societal preferences evolve in a manner and speed similar to the recent past, expects:
- Fast growth in developing economies drives up global energy demand a third higher.
- The global energy mix is the most diverse the world has ever seen by 2040, with oil, gas, coal and non-fossil fuels each contributing around 25%.
- Renewables are by far the fastest-growing fuel source, increasing five-fold and providing around 14% of primary energy.
- Demand for oil grows over much of Outlook period before plateauing in the later years.
- Natural gas demand grows strongly and overtakes coal as the second largest source of energy.
- Oil and gas together account for over half of the world’s energy
- Global coal consumption flat lines with Chinese coal consumption seeming increasingly likely to have plateaued.
- The number of electric cars grows to around 15% of the cars, but because of the much higher intensity with which they are used, account for 30% of passenger vehicle kilometers.
- Carbon emissions continue to rise, signaling the need for a comprehensive set of actions to achieve a decisive break from the past.
Looking forward to 2040
- Extending the Energy Outlook by five years to 2040, compared with previous editions, highlights several key trends.
- For example, in the ET scenario, there are nearly 190 million electric cars by 2035, higher than the base case in last year’s Outlook of 100 million. The stock of electric cars is projected to increase by a further 130 million in the subsequent five years, reaching around 320 million by 2040.
- Another trend that comes into sharper focus by moving out to 2040 is the shift from China to India as the primary driver of global energy demand. The progressively smaller increments in China’s energy demand – as its economic growth slows and energy intensity declines – contrasts with the continuing growth in India, such that between 2035 and 2040, India’s demand growth is more than 2.5 times that of China, representing more than a third of the global increase.
- Africa’s contribution to global energy consumption also becomes more material towards the end of the Outlook, with Africa accounting for around 20% of the global increase during 2035-2040; greater than that of China.
You can compare the BP Energy Outlook with the data in the last four blogs.