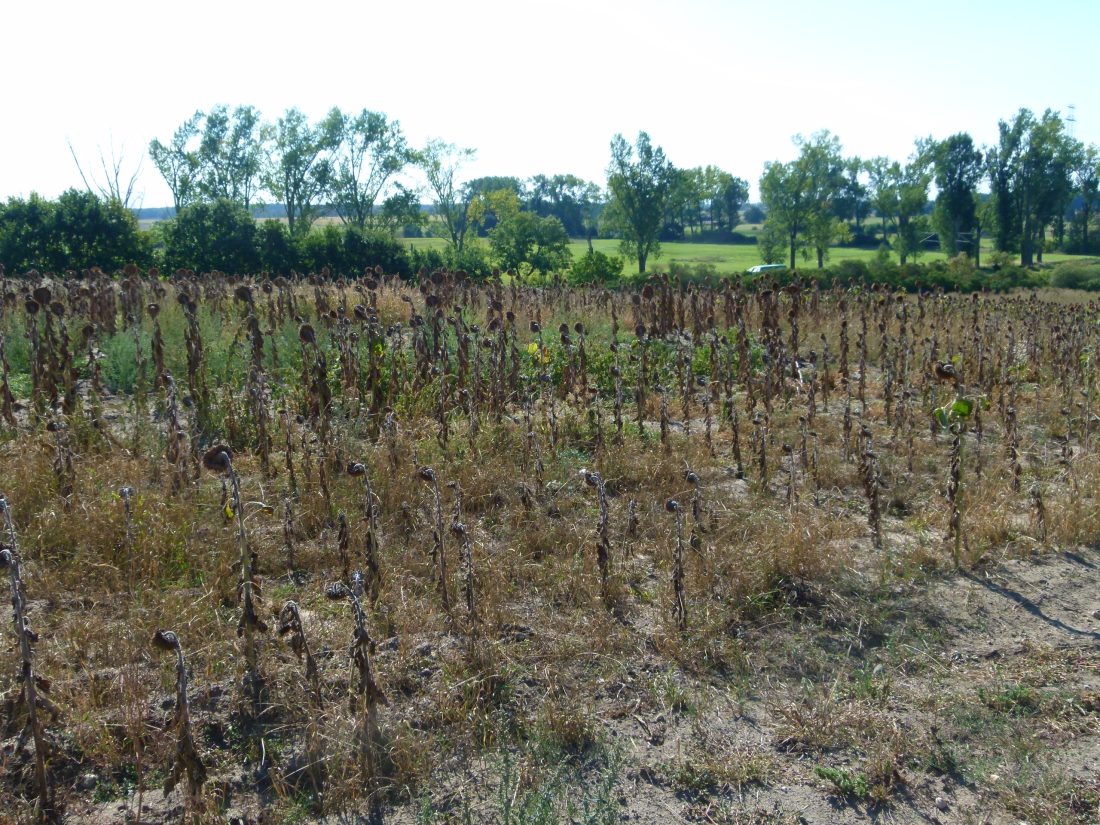
Campus as a Lab: Part 2

My July 12th blog summarized why laboratory training has been found to be essential in teaching STEM (except for Mathematics) and for that reason, why teaching science is more expensive than teaching other disciplines. I based my arguments there on an 1886 Harvard report that is as valid today as it was then. A more detailed argument was published somewhat more recently (in 1990):

Shulman and Tamir, in the Second Handbook of Research on Teaching (Travers, ed., 1973), listed five groups of objectives that may be achieved through the use of the laboratory in science classes:

  1. skills – manipulative, inquiry, investigative, organizational, communicative

  2. concepts – for example, hypothesis, theoretical model, taxonomic category

  3. cognitive abilities – critical thinking, problem solving, application, analysis, synthesis

  4. understanding the nature of science – scientific enterprise, scientists and how they work, existence of a multiplicity of scientific methods, interrelationships between science and technology and among the various disciplines of science

  5. attitudes – for example, curiosity, interest, risk taking, objectivity, precision,confidence, perseverance, satisfaction, responsibility, consensus, collaboration, and liking science (1973, p.1119).

What this list is missing is that—in most cases—laboratory experience is also an early opportunity for students to practice working in teams. I described this in a previous blog (December 19, 2017), where I covered my own experience in team-based learning (TBL) within exclusively lecture-based teaching settings. Because of the expense associated with laboratories, in most schools, the number of available experimental setups is smaller than the number of students that take the class. Therefore, teamwork has necessarily become the norm. Often, this translates to reports that include both individually and collectively gathered data.

Other schools and academic institutions generate equivalent laboratory experiences for their students. Schools of Education use real classroom environments to ensure that students don’t only learn “about” teaching but also practice it in various settings, with plenty of opportunities to learn on the job (from both their students and their teachers). Likewise, Art schools have plenty of opportunities for students to learn through doing, both collectively and individually.

This leaves Humanities and Social Studies. Recently, with the advance in computation as one of the main tools that social scientists use, and the advance in data analysis, laboratories have also started to spring up in Social Sciences in various forms.

Columbia University is one example:

The Columbia Experimental Laboratory for the Social Sciences (CELSS) has opened at Columbia. CELSS resides on the 5th floor of the International Affairs Building and is an interdisciplinary venue for researchers in Economics, Political Science, Sociology, SIPA and the Business School. It has 24 computers for participants and one computer for the experimenter. The goal is to enable students and faculty to run laboratory experiments in a controlled setting.

Cornell University can serve as an example of an institution that offers “laboratories,” for a long list of topics. They are especially known for introducing labs as a method or opportunity to study real issues that are likely to confront graduates once they enter the job market.

The Social Sciences that are probably ahead of most in this context are Business and Economics. The Bloomberg Terminals that I discussed in some earlier blogs (see March 5, 2019) are a useful tool that has become available to many institutions. They often serve the purpose of allowing students to learn through direct work on real problems.

Now we are being offered new opportunities that are not based on perceived future needs but instead, represent campus-mandated societal and institutional transitions in various areas. I have experimented with my students, investigating various examples, and written about them in previous blogs, including campus decarbonization (see June 18, 2019). An example of a single poster made by a group of my students is shown below (see it larger here). You can see broader examples and a collection of more posters here.

In the coming semester, I will use similar settings and ask my students to develop their own curriculum that takes advantage of the process.

I am starting now to get involved in my school’s effort to reduce the use of single-use plastics (SUP) (see April 5, 2022 blog), and I will try to explore how we can construct courses from which students can learn by participating in the efforts that their campus is pursuing.

Taking from the decarbonization example, a typical structure of the first half of such a course is targeted at the background of climate change, using TBL (team-based learning methodology). This also provides the necessary prerequisites, which are especially helpful because some of these students have never taken any Chemistry or Physics classes. After the midterm exam, we start to work on the class projects, for which the campus serves as our laboratory. The administration agreed to share with me the details of our campus energy use, including the energy use of individual buildings. I don’t share all of this data with my students. We discuss what information the students need to carry out their individual projects and I transfer that specific data to the students for further analysis.

Since the course, in which I am experimenting with these approaches, consists of honor students who come from majors in different disciplines, it allows me to experiment with interdisciplinary work, one of the greatest attractions of the Campus-as-a-Lab (CAL) project.

As I mentioned in the July 12th blog, there is a range of topics that seem to be fertile for CAL, including other projects that investigate college transitions. Other projects include investigations of the campus sewage for virus identification and finding ways to successfully run a campus with a declining student population, etc.

To be productive, all these topics must be intensively interdisciplinary and work in full cooperation with the administration of the college.

Stay tuned.

Posted in Education, Sustainability | Leave a comment

Creation

My plan was to write a continuation of the previous blog about Campus as a Lab (CAL) (July 19, 2022) but as usual, reality interfered in a big way! I got a Facebook message from a friend that included the picture below. My friend is a lawyer; he has been instrumental in helping me to uncover my early history and, to my knowledge, has nothing to do with science. The picture in his Facebook message came with a Hebrew “caption” shown above the figure, taken from Chapter 1 of the book of Genesis. I am also including the English translation of the Bible here:

וְהָאָרֶץ, הָיְתָה תֹהוּ וָבֹהוּ, וְחֹשֶׁךְ, עַל-פְּנֵי תְהוֹם; וְרוּחַ אֱלֹהִים, מְרַחֶפֶת עַל-פְּנֵי הַמָּיִם

The Book of Genesis, Chapter 1: “And the Earth was without form, and void; and darkness was upon the face of the deep. And the spirit of God moved upon the face of the waters.”

This landscape of “mountains” and “valleys” speckled with glittering stars is actually the edge of a nearby, young, star-forming region called NGC 3324 in the Carina Nebula. Captured in infrared light by NASA’s new James Webb Space Telescope, this image reveals for the first time previously invisible areas of star birth. (Source: NASA)

I also included the original NASA caption below the photograph. The image has become a well-known example of data from the new James Webb Telescope. I teach cosmology, so I had obviously seen this photograph before. The key word in the Hebrew caption was “Tohu-Vavohu.” The English Bible translated it as, “without form, void” but Wikipedia gives a much broader interpretation of the concept. The original translation, in my opinion, shouldn’t even be included in the broad interpretation because it directly implies absolute void, which Tohu-Vavohu doesn’t cover. My preferred translation is complete chaos. The interpretation that I took from my friend’s posting was that NASA was finally able to take a photograph of the world’s chaos before the spirit of God flew above water to put some order in the universe.

My response was that—actually, normalized to size, our little inhabited planet is much more chaotic than the universe around us, a statement supported by science.

To make progress, it helps to have some background information about the Webb Telescope, again from Wikipedia:

The James Webb Space Telescope (JWST) is a space telescope designed primarily to conduct infrared astronomy. As the largest optical telescope in space, its greatly improved infrared resolution and sensitivity allow it to view objects too old, distant, or faint for the Hubble Space Telescope. This is expected to enable a broad range of investigations across the fields of astronomy and cosmology, such as observation of the first stars and the formation of the first galaxies, and detailed atmospheric characterization of potentially habitable exoplanets.

The U.S. National Aeronautics and Space Administration (NASA) led JWST’s development in collaboration with the European Space Agency (ESA) and the Canadian Space Agency (CSA). The NASA Goddard Space Flight Center (GSFC) in Maryland managed telescope development, the Space Telescope Science Institute in Baltimore on the Homewood Campus of Johns Hopkins University operates JWST, and the prime contractor was Northrop Grumman. The telescope is named after James E. Webb, who was the administrator of NASA from 1961 to 1968 during the MercuryGemini, and Apollo programs.

The James Webb Space Telescope was launched on 25 December 2021 on an Ariane 5 rocket from KourouFrench Guiana, and arrived at the Sun–Earth L2 Lagrange point in January 2022. The first image from JWST was released to the public via a press conference on 11 July 2022.[8] The telescope is the successor of the Hubble as NASA’s flagship mission in astrophysics.

The Wikipedia entry is much longer than the three paragraphs above and includes the history of the development of the JWST. The concept started in the 1980s, with some serious planning in the 1990s. The initial budget of 1 billion US$ mushroomed to more than $10 billion. Those who are now part of our past were looking at an uncertain future. The picture that we see and the few others that came with it show how well those efforts worked. All of us are justifiably very proud.

Let me now shift to the content of the picture. The NASA caption tells us that it covers a star-forming region called NGC 3324 in the Carina Nebula, a part of our Milky Way. Star-forming regions have always been the most fascinating products of major telescopes. Just search Google Images for “star birth” and you will be exposed to the most fascinating collection of cosmological photographs—most of them from well before the JWST. “Our” photograph is part of this collection.

Meanwhile, Wikipedia can give us a short description of the Carina Nebula:

The Carina Nebula[7] or Eta Carinae Nebula[8] (catalogued as NGC 3372; also known as the Great Carina Nebula[9]) is a large, complex area of bright and dark nebulosity in the constellation Carina, located in the Carina–Sagittarius Arm of the Milky Way galaxy. The nebula is approximately 8,500 light-years (2,600 pc) from Earth.

The nebula has within its boundaries the large Carina OB1 association and several related open clusters, including numerous O-type stars and several Wolf–Rayet stars. Carina OB1 encompasses the star clusters Trumpler 14 and Trumpler 16. Trumpler 14 is one of the youngest known star clusters at half a million years old. Trumpler 16 is the home of WR 25, currently the most luminous star known in our Milky Way galaxy, together with the less luminous but more massive and famous Eta Carinae star system and the O2 supergiant HD 93129A. Trumpler 15, Collinder 228, Collinder 232, NGC 3324, and NGC 3293 are also considered members of the association. NGC 3293 is the oldest and furthest from Trumpler 14, indicating sequential and ongoing star formation.

The most important indicator of any cosmological observation is the object’s distance from us (or the telescope that now sits about 1.5 million km from Earth). The Wikipedia entry tells us that this Nebula is 8,500 light years away from the telescope. While a light-year sounds more like a unit of time and not distance, it refers to the distance that light can travel in a year, in free space. The speed of light is the fastest speed that can be attained in our universe. It amounts to 300 million meters/sec or 300,000 km/sec or 186,000 miles/sec. We can multiply this number by the number of seconds in a year (365 x 24 x 60 x 60 = 31,536,000) to find that one light year amounts to 9.46 trillion km. So, the distance of the Carina Nebula from us is 9.46 x 8500 = 80,410 trillion km = 80.4 quadrillion km. Most science uses the metric system but if you prefer it in miles, just multiply this number by 0.62.

The interesting part is what light JWAT “saw” from the nebula. It took light 8,500 years to travel from the nebula to the telescope. The picture that the JWAT saw is not how the nebula looks now but how it looked 8,500 years ago.

How did Earth look 8,500 years ago? To get back to the message that my friend sent to me with the Hebrew caption, when did Judaism actually start?

The origins of Judaism date back more than 3500 years. This religion is rooted in the ancient near eastern region of Canaan (which today constitutes Israel and the Palestinian territories). Judaism emerged from the beliefs and practices of the people known as “Israel”. What is considered classical, or rabbinical, Judaism did not emerge until the 1st century CE.

For all we know, the Carina Nebula, and all the fascinating structures in the JWAT photographs, might even not exist today but we are able to monitor the distant past now because of the perseverance that NASA showed in its push forward in the face of an uncertain future.

Let us now move to the present and ask ourselves: are we capable now of showing the same perseverance in striving for a safe future? Our collective existence depends upon our doing so. To probe that, I will shift our attention to a recent speech by the secretary general of the United Nations, given at the Petersberg Climate Dialogue in Berlin earlier this month:

The United Nations secretary general, António Guterres, issued a dire warning on Monday to representatives from 40 countries at the Petersberg Climate Dialogue, calling for more concrete action to tackle what he called a “climate emergency.”

“We have a choice,” Mr. Guterres said in a video message. “Collective action or collective suicide. It is in our hands.”

Mr. Guterres did not directly address the heat wave punishing much of Europe, but his comments came as swaths of the continent faced dangerously high temperatures on Monday, spurring wildfires in some areas.

Well, Mr. Guterres is a native of Portugal. He is fully aware that the number of heat deaths from the recent heat wave in Spain and Portugal approached 2,000. He gave us a choice between collective action and collective suicide—the same one that I have posed since the beginning of this blog. This is almost equivalent, if we go back to a biblical scale, to the idea that the absence of collective action indicates that a flag is rising to invite us all to hell. I will obviously return to this issue in future blogs.

Posted in Climate Change | Tagged , , , , , , , , , , , , | 1 Comment

Campus as a Lab: Part 1

diagram of connections between campus operations, research, curriculum, institutional sustainability, and living laboratoriesSource: Rutgers Living Laboratories

Campus as a lab (CAL) is becoming a teaching and organizational tool across campuses. I am including a schematic diagram of the dynamics of the concept, taken from the Rutgers University site, above. If you Google “Campus as a Lab,” you will get a handful of results but if you Google “College as a Lab,” you’ll only get a single entry. I am using the two terms interchangeably for reasons that I will elaborate on next week. In this blog, I will summarize aspects of the efforts taken at a few randomly selected campuses; next week, I will summarize some of my thoughts about its implementation elsewhere.

Here’s the general concept, taken from Campus as Living Lab.org:

The Campus as Living Lab Framework provides a systematic description of innovation projects combining campus and local/regional sustainability, research mobilization, student learning, civil society towards societal challenges.

The Framework is developed for practitioners setting up or managing Living Labs in and around University Campuses, such as Sustainability Coordination Officers (SCOs). Initial Living Labs for Sustainability can be set up and handled as projects, as they have a beginning and most probably as well a clear end of financial resources but as engagement- and empowerment processes are time consuming processes and are based on trust, they have to be considered as well as continuously ongoing processes. In co-creation meetings ideas have to be developed and research questions defined out of them, with changing participants and stakeholders. With this understanding the once started process has a big potential but demands as well responsible interacting and tailored communication plans to provide and share information with each stakeholder to keep the empowerment process ongoing.

A list of Columbia University’s individual offerings, based on its past efforts, is given below. The website includes descriptions of each project:

  • Proposing Offsets and Standards for Columbia’s Transportation Emissions
  • Advancing Sustainability at Faculty House
  • Water Exploratory to Inform Sustainability Planning
  • Campaign to Reduce Columbia-related Travel
  • Quantifying GHG Emissions from Air Travel
  • Commute and Fleet Emissions Data Analysis
  • Intercampus Shuttle Opportunities for Efficiency and Service Improvements
  • Break the Ice
  • SIPA Zero Waste & Sustain-a-Bottle
  • Cup It
  • Pedal 2 Power
  • Columbia Watermark Initiative

Not surprisingly, the Columbia task list, like most other campuses’ efforts, reads more like an advertisement for how well their campuses do at making schools more sustainable. Students, faculty, and administrators are involved in the efforts but an element that is missing is an evaluation of what students are learning from their participation in the effort.

Meanwhile, Duke University provides examples of the sites that it uses for CAL:

What are examples of CAL sites?

Duke University is home to a wide variety of buildings, ecosystems, and other spaces on campus that provide opportunities for students to apply what is learned in the classroom in the real world. Examples of these on-campus sites that are exemplary models of the Campus as Lab program ethos include the Duke Forest, Duke’s Reclamation Pond, a wide variety of sustainable buildings on campus (e.g. Student Wellness Center and Environment Hall), the Duke Campus Farm, and many more. These sites are a representation of the CAL program’s goal to bridge on-campus issues and their solutions with the global issues they represent. The CAL program hopes that by tying world issues to a tangible on-campus site that students will be able to connect their course learnings and campus experiences to better understand world issues. A CAL-endorsed site serves as an excellent starting point to learn about global problems, to be inspired to complete a CAL project, or to even appreciate the Duke campus a little more.

Princeton’s action plan includes details for projects to:

It also provides a detailed plan for 2026 and beyond.

All of this sounds good. Much of this is student-driven because many students are at an age when they want to contribute to making the world a better place. I am taking part in some similar initiatives focused on fighting climate change and decreasing the use of single-use plastics (SUP). However, almost by their nature, these programs are designed to change the schools, not necessarily to educate the students. Most academic institutions are proud to have rules that restrict academic decisions to faculty councils and committees. Administrators always have a say on such issues because, among other considerations, they involve budgetary issues. However, they don’t get a vote in these academic decisions.

I wrote before about the intricacies of academic politics (December 28, 2021). In that blog, I described my long experience in co-creating and running the Environmental Studies Program, which resembles many aspects of CAL use. I also previously discussed (June 18, 2019) the CAL program in the context of the mandated decarbonization of energy use in my school. One constant criticism that has been directed at the Environmental Studies Program and other interdisciplinary programs is that they would function better if students selected their primary discipline of study before faculty incorporated other interdisciplinary issues. This attitude is now shifting a bit due to new practices of collectively hiring faculty from different disciplines who will (hopefully) work together on interdisciplinary issues. Such hiring is now labeled “cluster hiring”:

Many universities now recognize interdisciplinary research and collaboration as the means to address grand challenges facing our society. University leaders also recognize the value of diversity in higher education and have expanded their definitions of diversity to incorporate multiple perspectives, methodologies, and worldviews. An inclusive campus climate that values diversity is one of the determinants of institutional excellence, and leaders seek strategies to further develop and improve the climate at their institutions.

Faculty cluster hiring is an emerging practice in higher education and involves hiring faculty into multiple departments or colleges around interdisciplinary research topics, or “clusters.” Some cluster hiring programs also aim to increase faculty diversity or address other aspects of institutional excellence, including faculty career success, collaboration across disciplines, the teaching and learning environment, and community engagement.

In a previous blog (January 19, 2022), I also described the NSF’s (National Science Foundation) new emphasis on funding interdisciplinary educational opportunities. As I mentioned in that blog, one of the conditions for getting new funding for such initiatives is that they must be new. Unfortunately, this means that none of us know how to structure them, and it would be presumptuous for us to suggest revolutionizing a college curriculum based on some scheme that none of us has experience with. In next week’s blog, I will outline my thinking on this issue and suggest how my school can start constructing a trial in this direction.

Posted in Education, Energy, Sustainability | Tagged , , , , , , , , , , , , , , , , , , , , , , , , , , , , , , , , , , | Leave a comment

What Am I Doing??

An elderly man smiles into the camera

Over the last few blogs I cried, together with many others, about the direction in which the country and the world are going. It reached a stage where a friend told me that she didn’t celebrate the 4th of July because the country is “misbehaving.” I thought that the time has come for a chat with myself in the “mirror” about what I intend to do about what’s going on.

In our modern age, you don’t just look at yourself in the mirror, you take a selfie and distribute it. I took one and showed it to my wife. She didn’t like it because I didn’t smile, so I looked like a frozen corpse. Fortunately, we had a relative over for dinner who is, among his other qualifications (such as being a former faculty member at Brooklyn College) a Brooklyn artist and a photographer. So, he took the “mirror” image above.

I am now on summer break. This is our third summer under the COVID-19 pandemic. Almost everybody has gotten sick of pandemic-related restrictions. Last semester I taught in person, taking all the mandated precautions, and I will continue to so in the next semester. All of my classes will address changing social issues in which the physical environment and the human environment are central. In physics, as in many other disciplines, we now have a sub-discipline that focuses on such issues: social physics (see February 2, 2021 blog). Wikipedia defines it:

Social physics or sociophysics is a field of science which uses mathematical tools inspired by physics to understand the behavior of human crowds. In a modern commercial use, it can also refer to the analysis of social phenomena with big data.

Social physics is closely related to econophysics which uses physics methods to describe economics.

Throughout the last year of the pandemic, many of us took local trips to visit friends and family, taking all the necessary precautions not to get infected or infect others. My wife and I haven’t flown anywhere yet but plan to go abroad in August to visit friends and family that we haven’t seen for years. At the same time, Bergen-Belsen Memorial, the concentration camp in which I spent two years with my mother and my uncle during WWII (see April 12, 2022, blog), decided to make a delayed celebration of the 75th anniversary of our liberation. The organizers invited me and my wife to attend. The timing, at the beginning of September, a week after our Fall semester starts, could have made it difficult. However, Labor Day made it possible for us to travel there without missing any classes. So, we will end up spending most of August in Europe visiting friends and family, return home for a week of classes, and then fly back to Germany for 5 days. We obviously, under the circumstances, got insurance for all of our flights.

One of the main objectives that most academics have during their summer break is to prepare new teaching material for the coming academic year. Since I teach topics related to social physics and the social reality is changing so fast, I thought that I had better use the summer to prepare. As I have written in earlier blogs, the Russian invasion of Ukraine is currently determining much of the changing global reality. My coming trip to Bergen-Belsen is giving me an opportunity to compare the invasion to the Nazi atrocities in WWII.

To try to do that in quantitative way consistent with the requirements of physics, I decided to focus on the economics of the Nazi regime, both before and during the war. I bought and have been reading Adam Tooze’s The Wages of Destruction: The making and breaking of the Nazi Economy (Penguin Books, 2006). It’s a long book—800 pages with references, tables, and index—but I’m almost finished by now. It is not surprising that there are many differences and similarities between the events described in the book and the current Russian invasion of Ukraine. One central similarity is the terrain. However, one thought has not left me throughout the long reading: what would have happened if Nazi Germany had had functional nuclear weapons in its arsenal? I have described the role of nuclear weapons in the present Russian invasion in previous blogs (see March 22 and April 19, 2022). As I mentioned in those and other blogs, the Russian government has made numerous threats to resort to nuclear weapons in case conventional war doesn’t satisfy their objectives.

For those of us not fluent in the history of nuclear weapons (we teach a course on the topic in school), the first demonstration of nuclear fission took place in 1938 by Otto Hann and Fritz Strassman in Germany. A short descriptive paragraph from the Britannica entry on Hahn is given below:

By the end of 1938, they obtained conclusive evidence, contrary to previous expectation, that one of the products from uranium was a radioactive form of the much lighter element barium, indicating that the uranium atom had split into two lighter atoms. Hahn sent an account of the work to Meitner, who, in cooperation with her nephew Otto Frisch, formulated a plausible explanation of the process, to which they gave the name nuclear fission.

The possibility that Hitler’s Germany could have developed an analog of the Manhattan Project is not farfetched. Wikipedia specifically says, “There were fears that a German atomic bomb project would develop one first, especially among scientists who were refugees from Nazi Germany and other fascist countries.”

Tooze’s book makes it clear (at least to me) that if the Nazi hierarchy had realized the possibilities and had the time and resources available to the Americans, they would have used an atomic bomb, probably on England. The threat itself would likely have prevented the US from joining the war against Germany.

On a much more local level, I am trying to find out how schools can take advantage of the transitions that we are all experiencing and use them as a learning opportunity. For instance, we can use the (often mandatory) adaptation measures of campuses to teach students how to adapt to these changes in real life after they leave college. The reality, of course, is that faculty members haven’t gone to any school to teach us how to implement this. Faculty, administrators, and students are trying to find their way like everybody else. But this is also the case in any research project: if it’s not new, it is not research. Most schools are now encouraging students and faculty to work together, recommending that students join research at the earliest possible stage.

Laboratory research has long been known to be necessary for teaching science:

Science educators have believed that the laboratory is an important means of instruction in science since late in the 19th century. Laboratory activities were used in high school chemistry in the 1880s (Fay, 1931). In 1886, Harvard University published a list of physics experiments that were to be included in high school physics classes for students who wished to enroll at Harvard (Moyer, 1976). Laboratory instruction was considered essential because it provided training in observation, supplied detailed information, and aroused pupils’ interest. These same reasons are still accepted almost 100 years later.

Mostly for this reason, STEM (Science, Technology, Engineering and Mathematics) courses have been found to be more expensive than humanities:

Universities spend more money on STEM courses than on humanities and social science courses, according to a working paper released Monday by the National Bureau of Economic Research.

The paper shows that STEM (science, technology, engineering, mathematics) fields such as electrical engineering, physics and chemistry tend to require greater funding than humanities and social sciences such as English, history and psychology. One notable exception is mathematics, which has the lowest instructional cost of all the fields studied.

Paper co-author Fernando Furquim, a doctoral student at the University of Michigan, said researchers found sizable cost differences across the disciplines they studied, and making these variations known could help higher education practitioners manage budgets.

Climate change require colleges, and everybody else, to adapt. The decarbonization of the campus is a fertile ground for using colleges as a laboratory for students to learn about these topics for use after graduation. I am both teaching students at various levels and working through the process at the same time (See November 23, 2021 blog). This work requires knowledge of a whole variety of disciplines, including most sciences and many social sciences. It is my job to provide students with the background appropriate for their level that will enable them to benefit from the course and use the learning in unanticipated situations. The research projects of my sophomore Honors College students provide a good example of how this can work. You can see their posters here.

Other projects that can use college transitions for a similar purpose include efforts to clean the campus of single use plastic, check the campus sewage for viruses, and find ways to run the campus with a declining student population, etc. This methodology has been labeled “Campus as a Lab” or “College as Lab.” Princeton University is using the concept extensively as part of their effort to increase environmental sustainability on campus.

I will expand on the concept in future blogs.

Posted in Climate Change, Education | Tagged , , , , , , , , , , , , , , , , , , , , , , , , , , , | 4 Comments

The Sky as an Inspiration

Sunset over NYC

A week ago, I got a new email from a young friend, reacting to the recent verdict by the Supreme Court that negates Roe vs. Wade, which has defined the abortion landscape for the last 50 years:

I was reading about roe v wade. Feel like it’s going to create a lot of logistical problems for women who need to get an abortion for legitimate reasons (ectopic pregnancies, etc.). Perhaps the Supreme Court was considering the economic impact of the declining fertility rate in our country.

The life-tenured conservative majority that now leads the Supreme Court was just warming up. Next, they decided that the long-standing New York State law that requires a special license to carry arms in public places is unconstitutional, in spite of the major increase in mass-killings in schools and other public places. The Court also decided that people with authority can force public prayers at events under their control. After that, they ruled that the president and Executive Branch have only limited authority to enforce greenhouse gas emissions limits for electrical utilities. This decision will seriously hinder our ability to fight climate change. At the same time, we are still dealing with the global impacts of issues that are not directly connected to Supreme Court decisions, such as the Russian invasion of Ukraine and its impact on energy inflation (see last week’s blog), as well as COVID-19 and general inequality.

My first order of business in confronting these issues is to separate global ones from national ones. Such a determination, obviously, will help us narrow down who to blame for our problems and what can we do to be less miserable.

Everybody around me is depressed. I have written a great deal about the impacts of global issues including Russia’s invasion of Ukraine, declining fertility, COVID-19, and climate change (just put any of these terms in the search box). Until now, I hadn’t written anything about the Supreme Court because it was off-topic but that is no longer the case. Because of the dominant global position of the United States, the lifetime tenure of the justices determines almost all aspects of our national reality, and through us they have large impact on the rest of the world.

In the middle of all of this, I looked at the sky for inspiration. For a short period of time, the “fight” between the dark clouds and the still sunny ones that covered my city seemed to me, the right analogy. I took the picture that is shown at the top of this blog. I knew who would “win” that battle – night always takes over after day. What, then, will the future hold for all of us???

If we look closely, many of the Court’s recent decisions didn’t make any direct judgments about the issues on which they decided to address. Instead, they were saying that it is not their business to decide, and shunting the responsibility back to the “people,” saying we should decide such matters through elected representatives. The one big exception to this argument was its ruling about the requirement for special permissions for New Yorkers to carry weapon in public places. Here, the Supreme Court decided that the elected representatives of New York who voted on this law contradicted the Second Amendment of the American Constitution, thus making these laws invalid. To understand this reasoning, we should examine the relevant part of the Second Amendment:

A well regulated Militia, being necessary to the security of a free State, the right of the people to keep and bear Arms, shall not be infringed.

It is basically one sentence. Its interpretation over the years has rested primarily on different interpretations of one word: people. Does this word refer to every person? or alternatively to a nation or state, as in, “We the people….” To rephrase the question, does the right to bear arms refer to us as individuals or does it refer to the state in a way that separates the current, sovereign state from its colonial past? Over the last generation, this issue has become highly politicized, and the current version of the Supreme Court just ruled in favor of the “individual” interpretation. Even so, they have tried, in every decision that relates to this issue, to argue that legislators can limit both the individuals who are allowed to carry arms and the locations where they can do so.

The Court’s other monumental new decisions, including the reversal of Roe vs. Wade and restrictions to the Environmental Protection Agency (EPA), make statements about separation of powers between the three independent branches that govern the Republic (legislative, judicial, and executive):

separation of powers, division of the legislativeexecutive, and judicial functions of government among separate and independent bodies. Such a separation, it has been argued, limits the possibility of arbitrary excesses by government, since the sanction of all three branches is required for the making, executing, and administering of laws.

This action was always political and as such, in democratic countries, is always determined by voters. A valid question is who has the last say? In a Constitutional Democracy, the constitution is the ultimate authority:

CONSTITUTIONAL DEMOCRACY is the antithesis of arbitrary rule. It is democracy characterized by:

  1. POPULAR SOVEREIGNTY. The people are the ultimate source of the authority of the government which derives its right to govern from their consent.
  2. MAJORITY RULE AND MINORITY RIGHTS. Although “the majority rules,” the fundamental rights of individuals in the minority are protected.
  3. LIMITED GOVERNMENT. The powers of government are limited by law and a written or unwritten constitution which those in power obey.
  4. INSTITUTIONAL AND PROCEDURAL LIMITATIONS ON POWERS. There are certain institutional and procedural devices which limit the powers of government. 

From there, the Supreme Court has the last word in interpretation the constitution. A politicized Supreme Court can and often does politicize such interpretation. Judges of the Supreme Court have lifetime appointments but as was shown recently, their decisions do not. Additionally, they can be impeached and the balance in the court can be shifted through changes in the number of judges and the lifetime appointment is not constitutionally guaranteed.

My last blog tried to analyze the balance between the top-down and the bottom-up efforts that are now taking place to fight inflation, with a particular emphasis on energy inflation. Time will tell how effectively these efforts will be. In democracies, much of the power is bottom-up: that of the individual citizens. However, plenty of examples from all over the world are emerging that show those in power (top-down) are working to find ways to manipulate those at the bottom so they can hold onto their institutional leadership and power.

Modern communication technology contains a great deal of resources to facilitate such manipulation. The New York Times recently provided a good example when it exposed the use of these technologies in China:

‘An Invisible Cage’: How China Is Policing the Future The more than 1.4 billion people living in China are constantly watched. They are recorded by police cameras that are everywhere, on street corners and subway ceilings, in hotel lobbies and apartment buildings. Their phones are tracked, their purchases are monitored, and their online chats are censored.

Now, even their future is under surveillance.

The latest generation of technology digs through the vast amounts of data collected on their daily activities to find patterns and aberrations, promising to predict crimes or protests before they happen. They target potential troublemakers in the eyes of the Chinese government — not only those with a criminal past but also vulnerable groups, including ethnic minorities, migrant workers and those with a history of mental illness.

So, I know how the sky will turn out after my beautiful sunset. My ability to guess the next step in my human landscape is much more complicated. The only thing we can do is to do what we can and hope for the best. Meanwhile, I hope that you all had a great 4th of July.

Posted in administration, Climate Change, politics | Tagged , , , , , , , , , , , , , , , , , , , , , , , , , , , , , , , , , , , , , | 3 Comments

Fighting Energy Inflation: Top-Down vs. Bottom-Up

Two weeks ago (June 14, 2022), I referred to Gina Raimondo, the US Commerce Secretary, whose thoughts of gas prices CNN summarized: “there is not much more the White House can do to tackle record high gas prices for Americans, [Raimondo cast] blame on Russia’s invasion of Ukraine.” The secretary restricted herself to top-down activities coming from the White House. More recently, President Biden tried to prove her wrong by proposing that congress enact a temporary (3 month) “holiday” from federal taxes. The reaction in the political arena was not encouraging. The arguments against such proposals are well known. Figure 1 shows the components of gasoline pricing over the last three years. Taxes are actually a relatively small component in gas pricing; it’s obvious from the figure that the inflation in gas prices is driven primarily by the price of crude oil, which is determined internationally. Furthermore, Figure 2 shows that in most states, state taxes are higher than federal ones. President Biden added a recommendation that states join the “tax holiday.” However, many voices predict that such measures will not help: oil companies will just “absorb” the saved tax into their own balance-sheet, with no impact or relief for consumers.

The New York Times piece where I found Figure 1 (based on the Energy Information Administration data) summarizes some of the issues:

Gas prices in the United States are at record highs. And even when adjusting for inflation, they are on average at levels rarely seen in the last 50 years, including during the energy crisis of the late 1970s. When fuel prices go up, consumers are hurt directly at the pump, but also indirectly when higher transportation costs raise prices on everything from food to diapers to construction materials.

The single biggest factor driving the spike now is the price of crude oil. As of April, according to the Energy Information Administration, the cost of the raw material accounted for 60 percent of the price of a gallon of regular gasoline. That compares to 52 percent the same time a year ago, and just 25 percent in April 2020 — when the pandemic sapped demand for fuel, along with most other goods and commodities.

A visual representation of monthly input costs for a gallon of regular gasoline, U.S. average

Figure 1 – Components of gas pricing

                             Chart comparing federal and state taxes of each US state

Figure 2 Composition of gas taxes

The most effective remedy is not top-down but bottom-up: drive less, try not to drive alone, be comfortable with slightly lower heating temperature, keep track of your use of electricity, and wherever possible, follow Phil Gallagher, last week’s guest blogger, and try to supplement your energy input with fossil-independent sources. For some of us, these choices mostly have to do with convenience and will not have major impacts on our lifestyle. But, for many who live from paycheck to paycheck and are dependent on driving to earn livelihood, some of these changes are existential.

I have repeatedly mentioned selective measures to help many of the “losers” in this needed energy transition (see the December 18, 2018 blog about the Yellow Vest demonstrations in France). In this context, we do need top-down help. Particular attention should be now directed toward Europe. Some of the difficulties that Europe is now facing, and the steps that they trying to take to overcome them, are summarized in the following WSJ piece:

Europe is hitting roadblocks as it tries to find alternatives to Russian gas in the Middle East and North Africa, as talks with big producers like Qatar, Algeria and Libya have become complicated.

The issues that have snarled negotiations range from the pricing of Qatari gas to stability in Libya and the politics of Western Sahara, a disputed North African territory. The challenges mark another indication that Europe will struggle to fully replace energy from Russia, which supplies 38% of the continent’s natural gas.

The WSJ piece mainly focuses on the short-term resiliency requirements of moving Europe away from its dependence on the Russian energy supply, especially given the immediate energy needs for electricity and heat in preparation for the coming winter. Resilience on such a short time scale invariably requires replacing one source of fossil fuels with another. Fortunately, Europe is much more advanced than many other regions in its transition to sustainable energy sources. This brings into focus another aspect of the European energy transition that can be adapted globally: modernizing the power grid by extending its boundaries as far as possible.

The US is not dependent on import of fuel supply from belligerent countries. However, many states are still fully dependent on coal as their primary energy source and climate impacts vary across states, commensurate with the requirements of their electricity load. Resiliency necessitates a timely transfer of power supply to prevent massive shortages. There is progress in all these areas, but it is too slow.

Our collective and individual challenges should not be used to weaponize difficulties in addressing energy distribution as a tool to replace the people in power. Instead, we need to work together to help solve these important challenges by increasing our efficiency in using the available energy.

In this globally connected environment, the interplay between top-down and bottom-up efforts to control various aspects of our lives is all consuming. We are all living through it. I will return to this in future blogs.

Posted in Energy | Tagged , , , , , , , , , , , , , , | 1 Comment

Guest Blog by Phil Gallagher: Going Solar in 2022 

This week, we have a guest blog from one of my friends, a retired Brooklyn College History professor, who just installed solar power in his home in Brooklyn.

Going Solar in 2022

My wife and I recently succeeded in going solar on our home in Brooklyn, choosing Brooklyn SolarWorks (BSW) to do the installation. We had attempted to do this back in 2015 with two other companies that were participating in the “CUNY-Sunshares” program. What happened back then is instructive; anyone considering going solar should be aware of the various factors that are involved, even if they are not mentioned up-front by the would-be installers.

The first salesperson we dealt with seemed informed and provided us with a written proposal within a few hours of our initial meeting. After considering the proposal, we were nearly ready to go forward and sign a contract with company #1 but decided to see what company #2 had to offer.

The salesperson for that company set up an appointment to meet but then canceled abruptly, calling to say that their engineers had determined that the needed number of panels couldn’t be installed on our flat 16′ x 40′ roof due to NYC Fire Code restrictions. This prompted us to ask company #1 if it was certain that it could install the needed number of panels and be within the Fire Code; the reply was that their engineers had approved installation and that it was a “go” – Company #1’s engineers found no problem with the NYC Fire Code requirements. But a few days later, the company called again and informed us that an additional $7,500 would be needed to finance the necessary NYC Fire Code permits. This had not been mentioned in the initial written proposal. Either the company was duplicitous in dealing with us or seriously unaware of the NYC fire code for flat roof solar panel installations, which require that paths be left on the roof for possible firefighter use.

Needless to say, we were disappointed. We had very much wanted to install solar panels. What we learned from the encounter was how important it is that every aspect of photovoltaic system installation and how it relates to the NYC Fire Code be fully understood by everyone involved.

In mid-January of 2022 we were approached at the front door by another company, Brooklyn SolarWorks (BSW). We agreed to receive a phone call. On January 25th, we and their salesperson met at our home for about 90 minutes. We listened, asked questions, took notes on the conversation, and provided a Con Edison summary of our electric use during 2021. Within days, 2 BSW engineer/mechanics came to the house; I accompanied them to our flat roof where they took measurements and worked out a plan for installation on tilted racks that would meet both the NYC Fire Code and our electrical needs. On January 30th, we received a contract proposal for a 4 kW Flat Roof–Tilt Rack Photovoltaic System; it included a 3-D sketch of where the needed panels would be placed.

3-D sketch of planned placement of solar panels

Among the details of the 11-page contract was a listing of the crucial components: 10 400-watt LG solar panels and an SMA SunnyBoy Inverter. On January 31st, we signed a contract and made a down payment. During February and March, we were regularly informed of the steps in the NYC application and permitting process and of the anticipated dates as the paperwork between BSW and NYC Department of Buildings (DOB) went forward.

In early March, we received word that BSW’s application for our system had been approved by NYC DOB and that the application for an NYS incentive grant had been filed and approved. A few weeks later, installation was scheduled for April 15th. The morning of that day, a team of 7 comprising 4 mechanics and 3 electricians arrived at 9 AM; they completed the process in 6 ½ hours. We were very pleased with their efficiency and with the care with which they proceeded. I followed them around from the basement to the roof, photographing most aspects of the process. In the basement they installed the conduit-protected wiring that descended from the solar panels and inverter, and connected it to Con Edison’s grid and meter. On the roof, they set up the heavy-duty racks and bound the panels to them. By the end of the day, we were generating electricity.

Two steps remain before we get credit from Con Edison for the electricity we generate. Next week, NYC DOB is scheduled to inspect the system to be sure everything has been completed to code. If it has all been done appropriately, Con Edison will begin to monitor what we generate and give us credit for it via a process called net metering. When we use more electricity than we generate, we pay ConEd; when we generate more than we use, ConEd pays us—that is, the value of what we generate is subtracted at market rate from our monthly bill. At least, that’s what we’ve been promised.

The system comes with a 30-year warrantee from SolarInsure that covers materials and labor. Like every insurance policy, it’s important to read the fine print, but it appears to be a solid policy. Only time will tell.

Lastly, there’s the question of money. There are federal, state, and NYC tax incentives for installing a photovoltaic system on your home. They are payable in the four years following installation.

Update: A few minutes ago, our mail arrived, and with it came the first bill from ConEd since the new setup. The bill for the same period last year was $86.43. Today’s bill totaled $21.30, which they called a “delivery” charge; the charge for electricity was $0.00.

Phil Gallagher retired from Brooklyn College in 2012 after 45 years teaching Medieval European History. With his family, he has enjoyed 50 summers in their off-the-grid log cabin on a mountain lake in Maine, where they fish, hike, swim, cook, read, and write. Their cabin has just enough solar panels to keep a few LEDs and their computers and cell phones going.

A man with a white beard, a baseball hat, and a pair of sunglasses smiles at the camera

Posted in Energy, Guest Blog | Tagged , , , , , , , , , , , , , | 4 Comments

Analyzing Global Energy Inflation

In almost every news broadcast, fuel inflation holds the top spot. This is not surprising. With an energy inflation growth of around 30% per year (see Figure 1) and the average price of gasoline at around $5/gallon (occasionally up to $10/gallon in parts of California), consumers are unhappy. Almost every report on the issue includes comments from consumers that they cannot support a government that has allowed (or is causing) such increases and if given a chance they will vote for people that are not part of the current administration. However, in a recent interview, Gina Raimondo, the US Commerce Secretary, responded to the issue:

Commerce Secretary Gina Raimondo conceded Tuesday that there is not much more the White House can do to tackle record high gas prices for Americans, casting blame on Russia’s invasion of Ukraine.

“Unfortunately, that is the brutal reality,” Raimondo said in response to CNN’s Kate Bolduan saying there’s not much action left that President Joe Biden can take.

In this blog, I will try to analyze the situation and the challenges that it invokes.

Figures 1 and 2 summarize the timelines. For reference, President Biden was inaugurated on January 20, 2021. That same month, effective vaccination for COVID-19 started to become available within the US, less than a year after it was declared a global pandemic.

Four graphs depict the change in consumer price index for core goods, core services, energy, and food

Figure 1The recent growth of the yearly Consumer Price Index (CPI) (Source: Brookings)

The key part of Figure 1 is the energy price (C). It underlines all other inflation markers. The only marker that seems not to be affected is the Core Services (B), but that might well just involve a time-lag marker in the case that inflation persists. An important aspect of the data that is directly linked to the energy inflation markers is its globality. Recent data show that the inflation rate is at about the same level of above 8% both in Europe and the US. The inflation levels in many developed countries are significantly higher because they are sensitive to the exchange rates with global trading currencies such as the US$ and the Euro. For example, the inflation rate in Brazil exceeds 12% and in Turkey, it is around 75%.

As I have mentioned before, the start of the changes in the energy prices coincided with two events: the inauguration of President Biden and the availability of effective vaccines against the COVID-19 pandemic. Republicans, not surprisingly, point to the former; the globality of the phenomenon strongly suggests the latter.

Figure 2 shows the expansion of the changes in oil prices over the last 10 years. In a sense, it is the extension of earlier changes in oil prices in response to political events that had a strong influence on global oil prices. My January 13, 2015 blog, in particular, discusses the changes in oil prices between 1947 and 2015. That blog shows that toward the end of 2014, the price reached negative territory. Namely, it cost the oil companies more to store oil than they could recoup from selling it. Figure 2 shows a minimum but not a negative number. This might be due to a different reference for the value of the US$. However, Figure 2 shows that toward the end of 2020, at the height of the pandemic, when everything was at a global stand-still, with no relief in sight, the oil price reached a minimum that was considerably lower than that of late 2014. The energy inflation in the marker in Figure 1 is plotted against that minimum.

Timeline of oil prices over the last 10 years

Figure 2Timeline of oil prices over the last 10 years

Figure 1 doesn’t show what happened in 2022 after the February 24th Russian invasion of Ukraine. Suddenly, Europe, much more than the US, has found itself dependent on an energy supply from a country that is a major security risk to the existence of many of its members. As I discussed earlier this year (February 8, 2022), energy export is a major income generator that fuels Russia’s military. The need to change Europe’s role in this became immediate. Energy “independence” has become a rallying cry. Energy security became another face of the energy transition—not dependence on a few petrostates but control of a country’s own energy supply and ability to create alliances based on it. The transition, on this level, starts in Europe. Europe was also at the forefront of the climate change-related energy transition, acknowledging its need to decarbonize its energy sources.

After President Biden’s inauguration, American policy too began to join in the transition, as symbolized by an immediate return to the Paris agreement, with commitments to decarbonize completely toward mid-century and decarbonize its electricity supply by 2035. These have now became long-term commitments. Meanwhile, the immediate goal is to use everything short of military action to deprive Russia of its energy income and disable it from military expansion. In view of the much greater dependence of Europe on Russian energy supply, the President of the European Commission, Ursula von der Leyden, visited the White House to outline a joint strategy on how the US can help Europe in the transition without resorting to steps that impact the longer-term transition to sustainable energy. The document cited below shows the results:

Today, President Joe Biden and European Commission President Ursula von der Leyen announced a joint Task Force to reduce Europe’s dependence on Russian fossil fuels and strengthen European energy security as President Putin wages his war of choice against Ukraine.

This Task Force for Energy Security will be chaired by a representative from the White House and a representative of the President of the European Commission. It will work to ensure energy security for Ukraine and the EU in preparation for next winter and the following one while supporting the EU’s goal to end its dependence on Russian fossil fuels.

The Task Force will organize its efforts around two primary goals: (1) Diversifying liquefied natural gas (LNG) supplies in alignment with climate objectives; (2) Reducing demand for natural gas.

Diversifying LNG Supplies in Alignment with Climate Objectives

  • The United States will work with international partners and strive to ensure additional LNG volumes for the EU market of at least 15 bcm in 2022, with expected increases going forward.
  • The United States and the European Commission will undertake efforts to reduce the greenhouse gas intensity of all new LNG infrastructure and associated pipelines, including through using clean energy to power onsite operations, reducing methane leakage, and building clean and renewable hydrogen-ready infrastructure.
  • The European Commission will prepare an upgraded regulatory framework for energy security of supply and storage, as well as working with EU Member States to accelerate regulatory procedures to review and determine approvals for LNG import infrastructure. The United States will maintain its regulatory environment with an emphasis on supporting this emergency energy security objective and the REPowerEU goals.
  • The European Commission will work with EU Member States toward the goal of ensuring, until at least 2030, demand for approximately 50 bcm/year of additional U.S. LNG that is consistent with our shared net-zero goals. This also will be done on the understanding that prices should reflect long-term market fundamentals and stability of supply and demand.

Reducing Demand for Natural Gas

  • The United States and the European Commission will engage key stakeholders, including the private sector, and deploy immediate recommendations to reduce overall gas demand by accelerating market deployment of clean energy measures.
  • Immediate reductions in gas demand can be achieved through energy efficiency solutions such as ramping up demand response devices, including smart thermostats, and deployment of heat pumps. The REPowerEU plan estimates that reductions through energy savings in homes can replace 15.5 bcm this year and that accelerating wind and solar deployment can replace 20 bcm this year, and through EU’s existing plans such as “Fit for 55” contribute to the EU goal of saving 170 bcm/year by 2030.
  • As global leaders in renewable energy, the United States and the European Commission will work to expedite planning and approval for renewable energy projects and strategic energy cooperation, including on technologies where we both excel such as offshore wind.
  • We will continue to collaborate to advance the production and use of clean and renewable hydrogen to displace unabated fossil fuels and cut greenhouse gas emissions, which will include both technology and supporting infrastructure.

The emphasis of the document is on diversifying supply, reducing demand, and strengthening the transition to sustainable energy. Everybody at the meeting fully realized that direct commitments by governments require a transformation of these guidelines into policy. This, by necessity, involves major political persuasion. The options are very complex. As I argued in the last blog, in complex situations, it is much easier to vote “against” something as opposed to “for.” Republicans are currently using the word “inflation” at every opportunity. It is effective. In last week’s blog, I mentioned the recent House Republicans’ related approach:

An example of this strategy for voting “against” something can be seen in the new House Republican platform:

  • Republicans this week introduced a road map describing how they would mitigate rising gasoline prices and address climate change if the party wins control of the House in November’s midterm elections.
  • The plan arises from the energy, climate and conservation task force established last year by House Minority Leader Kevin McCarthy, R-Calif., and involves proposals that run counter to the warnings of climate scientists.
  • The strategy provides a broad overview of how the party would address high energy prices but doesn’t set specific greenhouse gas targets.

It can be summarized as “drill, drill, and drill some more.” The plan helps reduce dependence on Russian oil but does so by endangering the longer-term energy transition to decarbonized energy sources. It’s a complex issue and I will try to follow along with the process.

In future blogs, I will try to respond to Commerce Secretary Gina Raimondo’s comment that I mentioned at the opening of this blog: that governments basically have very few tools left to directly impact the energy supply part of the energy inflation, and try to make the case that all of us have a major role in directly impacting the energy demand part of the equation.

Posted in Energy | Tagged , , , , , , , , , , , , , , , , , , , , , , , , , , , , , , , , , , , , , , , , , , , , , , , , , , , , | 2 Comments

Changes Too Quick to Follow!

Confetti fills the air above graduates in mortarboards

Figure 1 – Brooklyn College graduation at Barclays Center

My summer break started last week. A day after Memorial Day we had our first in-person commencement ceremony since the start of the pandemic. It took place in the local Barclays Center with a capacity of 20,000. The top photograph shows the reaction after the announcements of the new degrees. Attending faculty was required to be vaccinated and to wear masks throughout the ceremony. I have no idea about the requirements for the guests, but we were surrounded by people who didn’t wear masks. The ceremony was the most impressive that can I remember. We had, among some of our very distinguished guests: the US Senate Majority Leader, the Mayor of NYC, the Public Advocate of NYC, and the Brooklyn Borough President. Brooklyn College also gave an honorary degree to Leymah Roberta Gbowee, a Nobel Peace Prize recipient known for her human rights work in Liberia. The day was the warmest of the year so far (93oF) but the atmosphere was exciting, and we were delighted with our students’ achievements. After two years or so of COVID-19 restrictions, it felt like we were finally on our way to “normal.”

As a part of this process toward normalcy, I thought I’d use this blog to help me go full speed in confronting the longer-term threats of climate change. Among other reasons, it would help prepare my classes for the fall semester on the topic. My latest series of blogs focused on the IPAT identity and I had planned to continue this week with an analysis of ESG as a tool for socially and environmentally responsible investment.

Returning home, I had lunch and opened the paper, only to realize that not only are we far from back to normal but it has very little to do with the pandemic. Reality is now changing too fast to have many thinking “long term” (25 years?).

Massive gun violence in the US is consistently at the top of the news (with very little time between each event!). Since the beginning of the year, gun violence has resulted in 261 dead and 1,000 injured, with half the country’s governing body blaming it on “evil” and claiming that nothing can be done apart from praying. The Russian invasion of Ukraine is now 100 days old and is having a major global impact. In spite of the fact that the global pandemic forced many of us to live our lives “remotely,” carbon emissions, temperature, fires, and floods were at their most extreme this past year:

Humans pumped 36 billion tons of the planet-warming gas into the atmosphere in 2021, more than in any previous year. It comes from burning oil, gas and coal.

The amount of planet-warming carbon dioxide in the atmosphere broke a record in May, continuing its relentless climb, scientists said Friday. It is now 50 percent higher than the preindustrial average, before humans began the widespread burning of oil, gas and coal in the late 19th century.

There is more carbon dioxide in the atmosphere now than at anytime in at least 4 million years, National Oceanic and Atmospheric Administration officials said.

The concentration of the gas reached nearly 421 parts per million in May, the peak for the year, as power plants, vehicles, farms and other sources around the world continued to pump huge amounts of carbon dioxide into the atmosphere. Emissions totaled 36.3 billion tons in 2021, the highest level in history.

The Russian invasion of Ukraine was largely financed by petrodollars (See the February 8, 2022 blog). At last, the “West” (mainly Europe) has decided to try to reduce the flow of oil and gas in a major way:

BRUSSELS — The European Union on Friday formally approved an embargo on Russian oil and other sanctions targeting major banks and broadcasters over Moscow’s war on Ukraine.

EU headquarters says Russian crude oil will be phased out over six months, and other refined petroleum products over eight months.

It says that “a temporary exception is foreseen” for landlocked countries – like Hungary, the Czech Republic and Slovakia – that “suffer from a specific dependence on Russian supplies and have no viable alternative options.”

Bulgaria and Croatia will also get “temporary derogations” for certain kinds of oil. EU leaders say the move means that around 90% of Russia’s oil exports to Europe will be blocked by year’s end. The EU imports around 25% of its oil from Russia.

Not surprisingly, this and the preceding expectations that something like it would take place have had a major impression on the global prices of energy. People are complaining. Energy is at the base of the economy and has a major impact on inflation. People seem to be upset with the gun violence, upset with Russia’s invasion, upset with the large fluctuations in the stock markets, trending down, and still upset with the pandemic. Most of all, they seem upset with the national average of almost $5/gallon and the rise in the price of travel. This is the time when voters often vote current lawmakers out of power because they want “changes.” In this way, convenience is prioritized over “future” disasters such as mass shootings, with the hope that “it will not happen here.” There’s a sense that it’s more effective to vote “against” politicians and policies that we don’t like than it is to vote “for” those that we support.

In terms of energy availability and pricing, there are alternatives. One obvious alternative is to use less energy overall. The idea of postponing vacations or other travel plans is unpleasant—especially after two years of being stranded by the pandemic. However, it seems to me that avoiding “unpleasantry” should be less important than trying to ensure the safety of others.

Other options include amplifying efforts to develop domestically-produced sustainable energy alternatives. As Figure 2 shows, this is already happening, especially in Europe:

In 2021 Russia supplied 40% of Europe’s gas. Since the invasion of Ukraine, the picture has changed rapidly. On May 31st Gazprom, Russia’s state-owned energy giant, announced that it would stop supplying GasTerra, a Dutch firm, and Orsted, a Danish one, after they refused to pay for gas in roubles. Shell’s supply to Germany was also cut off. The decision looked like retaliation: the previous day the EU had announced a ban on Russian oil, covering 75% of imports from the country and 90% by the end of the year. Russia had already cut off gas companies in Bulgaria, Finland and Poland.


Figure 2Global increase in use of wind and solar energy in 2021 (Source: Visual Capitalist via Big Think)

This map is already outdated. It shows the U.S. sourcing 13.1% of its electricity from wind and solar in 2021. This April, and for the first month ever, the country generated 20% of its power from those two renewable sources.

The conversion to sustainable and local energy sources is impressive but still too slow. Bloomberg notes:

The invasion of Ukraine has put the US and Europe on a wartime mission to abandon Russian fossil fuels. This series looks at speeding up zero-carbon alternatives by lowering political and financial barriers…

It will cost more than the gross domestic product of the entire world to rewire the global economy to run on clean energy.

Policy makers and campaigners focused on ginning up the estimated $100 trillion needed over the next three decades know that governments alone cannot foot this bill: Wall Street must get on board with the energy transition. The odds of decarbonizing the world depend to a significant extent on bankers being swayed to direct their dollars away from fossil fuels and toward renewables.

The power grid is a weak point in both the US and Europe:

The nation’s power grid is under stress like never before, with regulators warning that the kind of rolling outages that are now familiar to California and Texas could be far more widespread as hot summer weather arrives.

A large swath of the Midwest that has enjoyed stable electricity for decades is now wrestling with forecasts that it lacks the power needed to get through a heat wave. The regional grid is short the amount of energy needed to power 3.7 million homes.

New Mexico’s attorney general is preparing for “worst case scenarios” after a regional utility warned of possible blackouts. North Dakota regulators advised the state to be ready for rolling outages, Arkansas officials are preparing emergency energy conservation measures, and power companies in Arizona are already sounding alarms about next year.

The issue of equity in fighting the prevailing difficulties is important. If not addressed, the reaction will be that the next election will bring down the people that are trying to work toward solutions (voting “for”) and replace them with people that make promises that they will do the job better (voting “against”), (see my December 18, 2018, blog about the Yellow Vests demonstrations in France).

An example of this strategy for voting “against” something can be seen in the new House Republican platform:

  • Republicans this week introduced a road map describing how they would mitigate rising gasoline prices and address climate change if the party wins control of the House in November’s midterm elections.
  • The plan arises from the energy, climate and conservation task force established last year by House Minority Leader Kevin McCarthy, R-Calif., and involves proposals that run counter to the warnings of climate scientists.
  • The strategy provides a broad overview of how the party would address high energy prices but doesn’t set specific greenhouse gas targets.

In other words, the party is relying on voters to choose its platform as an alternative to the status quo (“against”). There are a lot of promises but some of the details are either missing or misleading.

Posted in Electricity, Energy, Russia/Ukraine, Sustainability | Tagged , , , , , , , , , , , , , , , , , , , , , , , , , , , , , , , , , , | 3 Comments

Electric Utilities Through the Lens of the IPAT Identity

The last two blogs focused on applying the IPAT identity to sub-country organizations. For obvious reasons, I started this analysis with a focus on oil companies and their supposed commitments to net-zero carbon emissions in the “near” (mid-century) future.

One of the main challenges for the oil companies is to balance their reliance on selling fossil fuels with their net-zero commitments. Many think that such a balance doesn’t exist but some of the oil companies are relying on carbon capture and storage (CCS) to prove that it does. Last week’s blog focused on incorporating CCS into the IPAT identity.

Figure 1 – Top 30 GHG emissions per capita by US investor-owned utilities (IOUs)
Numbers in gray circles represent total CO2 metric ton emissions, innermost numbers on bars represent emissions per capita (Source: Visual Capitalist)

In this week’s blog, I will focus on electric utilities. One of my reasons for doing is shown in Figure 1, taken from my favorite infographic site, Visual Capitalist. The figure illustrates the top 30 emissions per capita of the largest investor-owned utilities in the US. I live and work in NYC and we get our electricity from Con Edison. Our utility is doing very well on this chart and once I saw it, I forwarded it to the administrators of my school so they can be proud of being ConEd customers.

However, Figure 2 demonstrates the main reasons why we should care about how well the electric utilities are doing in reducing their carbon footprints. This figure, also posted by Visual Capitalist, is the best description that I am familiar with; it shows the importance of carbon-free electricity in the energy transition. It shows that the electricity generation sector takes the largest amount of energy in the US. More than that, as I have repeatedly mentioned throughout this blog, the flexibility of electricity use makes it the most important tool in the energy transition. The second-largest field of energy use is transportation. The shift to electric cars is mostly motivated by the claim that they use carbon-free energy; however, that depends on the availability of decarbonized electricity (examine the situation in China as it shifts to electric cars).

The industrial, commercial, and residential uses of energy are, to an important degree, associated with heating and cooling. Both functions can be accomplished using heat pumps driven by electricity. In other words, our ability to decarbonize our lives depends on our ability to decarbonize our electricity. In addition, one of the main impacts of climate change is water stress. In a world whose surface area is 70% ocean, one of our best ways to mitigate water stress is through desalination. However, the ability to alleviate water stress in this way while not contributing further to climate change is conditional upon decarbonized electricity sources.

In an earlier blog (June 29, 2021), I showed a figure similar to Figure 1, also from Visual Capitalist. However, that figure showed the “targets” of decarbonization by utilities, whereas Figure 1 shows the most recently available data (2020, with one exception of 2019).

Going back to IPAT, the identity (without the CCS term) looks like this:

formula of IPAT identity

We can learn from Figure 1 what the terms mean for companies: The “population” refers to the number of customers. The GDP is equivalent to revenues. The “energy” term applies to the primary energy used and the other two terms that list the kind of energy sources that are used have the same meaning as the original IPAT.

I will focus here on Consolidated Edison (ConEd or Con Edison) as an example.

Figure 2 – Estimated US energy consumption in 2019 (Source: Lawrence Livermore National Laboratory, via Visual Capitalist)

Electricity is a secondary energy source that is produced from primary energy sources. The efficiency of the conversion is around 30%. The remaining 70% is rejected energy: heat (shown here in light gray). Since, as Figure 2 shows, our largest energy use goes toward electricity generation, any effort to decarbonize our energy use has to go through decarbonizing our electricity use.

If we get our electricity from an electrical utility, we must know how to handle the carbon balance of our utility. This form of emission is labeled as Scope 2 emission (June 18, 2019), indicating that we are not directly using the fossil fuel (Scope 1) but, instead, the product (electricity) that another party (electric utility) makes from it.

Since ConEd is my supplier of electricity both at home and at work, and since my state and city mandates now have laws demanding that both must reduce carbon emissions, I had to learn how to do so. Two blogs from exactly a year ago (May 25 and June 1, 2021) explored the procedure. The June 1 blog deals specifically with ConEd. As Wikipedia mentions, ConEd works through subsidiaries. As in that earlier blog, the main two subsidiaries that I will explore here are CECONY, which is regulated for its fuel mix by NYISO, and ConEd’s own subsidiary that is not regulated in terms of its fuel mix. Missing more detailed data, I am assuming that a smaller subsidiary, labeled O & R, which is focused on electricity delivery outside NYC, is included in the CECONY accounting. The fuel composition posted below is from the June 2021 blog:

CECONY [Consolidated Edison Company of New York] Fuel Mix Allocated by NYISO

  • Natural Gas 51.1%
  • Nuclear 37.5%
  • Hydro 7.4%
  • Other 1.3%
  • Oil 1.1%
  • Wind 1%
  • Coal 0.3%
  • Solar 0.2%

Con Edison Owned Generating Capacity (Total 3,463 MW)

  • Solar 64.1%
  • Natural Gas 21.4%
  • Wind 12%
  • Petroleum 2.5%

In its report, the ConEd-owned and generated subsidiary is called Clean Energy Business.

From Figure 1, I learned (not knowing previously which subsidiaries were considered), that the 2020 carbon emissions from ConEd were 6.3 million metric tons and the per capita emissions were 1.6 million metric tons. From that, I  learned that the number of customers that were taken into account reaches nearly 4 million:

6,300,000/1.6 = 3,937,500

ConEd’s own website says they have 3.4 million customers.

ConEd is not only an electricity supplier; it delivers other services such as gas supply and grid services. I don’t have enough data to fine-tune the analysis.

The total electricity production for full-service customers and the total revenue are available in the annual 2021 report.

The company’s total 2021 revenue was listed as $13.7 billion, with a total energy of 20.7 billion kWh from CECONY and 7.52 million kWh from the Clean Energy Business. These numbers indicate that the actual energy delivered by the Clean Energy Business can be neglected compared to the CECONY delivery. So now we are in the position to calculate the carbon footprint of ConEd through the IPAT and compare it with the one calculated in Figure 1.

In the June 1, 2021 blog, we directly calculated the carbon intensity of ConEd based on their fuel composition. The result was that for every kWh delivered we must use 8000Btu of primary energy. If we neglect the contributions of the 1.1% oil and the 0.3% coal, putting all these numbers into the IPAT formula gives us 20 billion kWh. In this configuration, the only fossil fuel that ConEd uses to produce its electricity is natural gas, which accounts for 8×10¹³Btu of primary energy. If 1Btu of natural gas heat produces 0.063g of carbon dioxide, we can calculate the total carbon footprint of ConEd at 5 million tons of carbon dioxide, which roughly agrees with the value in Figure 1 (6.3 million tons).

For people who hate numbers, this is very complicated. To add to the complication, the reports that contain all this data are far from accessible. They are directed at investors, not students or readers who feel a need to follow the progress of the energy transition that we are forced to go through. As I mentioned in the last blog, ESG was designed to be a step toward allowing investors to consider social benefits as part of their investment considerations. In future blogs, I will try to correlate the IPAT perspective with ESG calculations.

However, there should be little argument about the importance of such analysis.  A few days ago, the G7 (United States, Canada, France, Germany, Italy, Japan, and the United Kingdom, as well as the European Union) made a decision to “fully” decarbonize electricity by 2035, only allowing for fossil fuels based on the extent of available carbon capture

The G7, which represents the world’s biggest advanced economies, agreed on Friday to achieve “predominantly decarbonized” electricity sectors by 2035, a goal that experts say is a major step in helping the world avert catastrophic climate change.

G7 climate, energy and environment ministers made the new pledge in a 40-page communiqué at the conclusion of their meeting in Berlin, in which they also committed to an eventual phase-out of coal power generation, but gave no deadline for when they would do so.

The decision on decarbonization does, however, leave countries open to continue using fossil fuels if their greenhouse gases are “abated,” which means they emit less when burned, or “captured.” Current technology cannot capture 100% of greenhouse gases emitted by the burning of fossil fuels.

A fully decarbonized electric sector is the necessary condition for a fully decarbonized economy because, as I have mentioned often, almost all of our energy use comes from our use of convenient electricity.

I neglected the energy contribution of the Clean Energy Business of ConEd in the total energy analysis above because it is much smaller than that of CECONY. However, ConEd lists its capacity as 3,463 MW (million watts). This totals to 3.5GW (billion watts). If this capacity is available for energy delivery over a full year, it amounts to 30 billion kWh (3.5×109x360x24 = 3×10¹⁰kWh). This amount of energy is 50% higher than CECONY is delivering now. True, the Clean Energy Business sources of energy include 21.4% gas and 2.5% petroleum. However, electricity delivery has to include safety considerations (look at Europe in light of the Russian invasion) and price. ConEd has 13 years to eliminate these sources to serve as a working example for the rest of the utilities.

Posted in Climate Change, Energy | Tagged , , , , , , , , , , , , , , , , , , , , , , , , , , , , | Leave a comment