In the July 31st blog and several of the ones following it, I focused on an effort by four Republican senators to investigate federal grant making as it pertains to climate change:
“Research designed to sway individuals of a various group, be they meteorologists or engineers, to a politically contentious viewpoint is not science — it’s propagandizing,” the senators wrote to the foundation’s inspector general.
A few days ago, my editor (Sonya Landau) sent me an email linking to an op-ed by a group of 60 writers, politicians, and academics, published in The Guardian:
There’s a great piece from yesterday in The Guardian about the same matter (https://www.theguardian.com/environment/2018/aug/26/climate-change-is-real-we-must-not-offer-credibility-to-those-who-deny-it):
“We are no longer willing to lend our credibility to debates over whether or not climate change is real. It is real. We need to act now or the consequences will be catastrophic. In the interests of “balance”, the media often feels the need to include those who outright deny the reality of human-triggered climate change.
Balance implies equal weight. But this then creates a false equivalence between an overwhelming scientific consensus and a lobby, heavily funded by vested interests, that exists simply to sow doubt to serve those interests. Yes, of course scientific consensus should be open to challenge – but with better science, not with spin and nonsense. We urgently need to move the debate on to how we address the causes and effects of dangerous climate change – because that’s where common sense demands our attention and efforts should be”.
In 2015, John Holdren, President Obama’s Science Adviser, asked the National Academy of Sciences to assemble a workshop of experts to discuss how best to characterize climate change risks. They did so:
OPENING REMARKS
Planning committee chair Joseph Arvai noted in opening the workshop that uncertainty cannot be eliminated from scientific projections but that the NCA4 is an “opportunity to address risk even in a climate of uncertainty.” John Holdren of the White House Office of Science and Technology Policy and Thomas Karl of the USGCRP provided an overview of the primary objectives they hoped the workshop would accomplish, which was followed by discussion of some of the most important challenges for the NCA4. The assessment and characterization of risk, in Holdren’s view, should address the needs of those who will use the information: the makers and implementers of policy, firms and businesses, and individuals who make decisions about mitigation and adaptation, as well as voters. Up to now, he suggested, risk has been defined in terms of physical and biological events that can follow from climate change as “the sum over all possible events of probability times consequences.” Less attention has been given to the consequences of these events for human well-being, that is, to characterizing the probabilities of their occurrence, as well as the character and quality of the consequences. To prepare for the future, he said, it is critical that people have a much clearer picture of how likely different possible consequences are, understand the strength of the available evidence, and have a realistic understanding of what it will mean for society if “the worst is true.” Many people assume that the uncertainty in climate change projections means it is just as likely that the outcomes could turn out to be favorable as not, Holdren noted. In his view, it is actually the case that “there is a larger chance that things will be worse than we currently expect than better.” Because of this gap in understanding of the risks, he said, it is critical that the NCA4 be very clear not only about what is known, but also about how it is known, and that it clearly explains the implications of what is known for mitigation and adaptation. He suggested that the NCA4 could move in this direction by providing the following:
USGCRP stands for The US Global Change Research Program and NCA4 is the 4th National Climate Assessment. I added the emphasis on one sentence because it summarizes one of the biggest problems climate scientists face. In essence, Holdren agrees with the op-ed in The Guardian that excluding deniers from future media exposure will help. The rest of the paragraph is background.
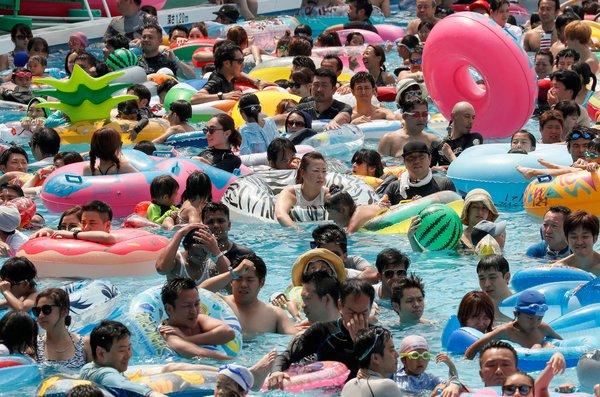
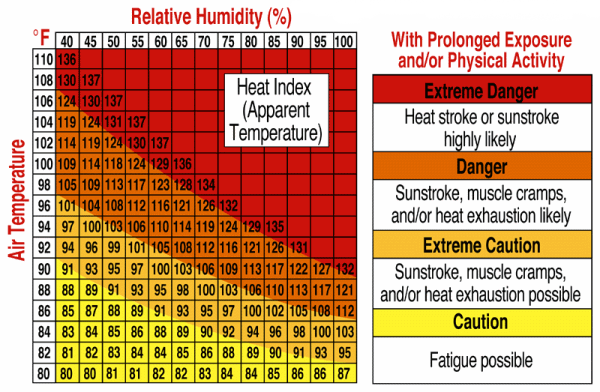
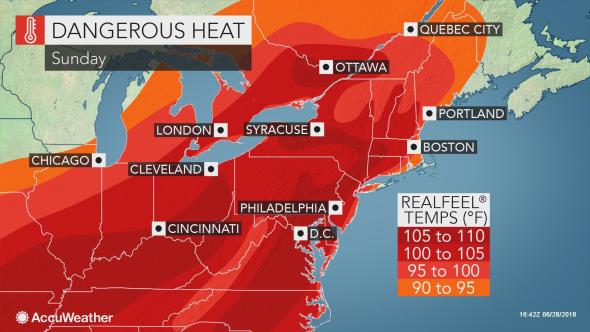
I teach climate change to 100 students and my semester just started last Monday (August 27th). From Tuesday – Thursday we had peak temperatures around 95oF with high humidity. The people in charge of Brooklyn College’s facilities sent this notice on Thursday, following a similar, slightly less alarming one from Wednesday:
ONE MORE TIME…
A heat advisory is again in effect for Brooklyn today. Our power supplier has asked us to cut energy use between 3 pm – 4 pm to avoid blackouts and other power disruptions. The Facilities Department takes steps to cut our power use during these times at our central chilling plant. We try to meet our energy saving goal without causing any noticeable decrease in service to the campus, however we need your help to meet our goal by taking the following steps:
– Turn off unnecessary lighting.
– Turn off computers and other equipment when not in use. Unplug small electronics, such as coffee makers.
– Lower shades to block heat from the sun.
– If you have a window a/c, turn it off at the end of the day.
– If you have central a/c, make sure all windows are closed.
There were strong voices on campus asking to cancel classes but since we couldn’t do so unilaterally, it ended up not happening. My two classrooms are relatively new and well equipped with air conditioners. Some of the buildings’ corridors were nice and cool with centralized air conditioning, while some were very hot and uncomfortable. I have no idea if working air conditioners were available in all classrooms.
Should I have started my climate change course with a “balanced” view, telling the students that some people think climate change is a hoax perpetrated by the Chinese to destroy the American economy, while others, like myself, strongly believe that it is a reality caused by our energy use and that future summers (and springs) are likely to be even worse?
Should I try to explain the science with the risk that some might view my efforts as propagandizing? How exactly should I teach the science without connecting the burning of fossil fuels with the accumulation of carbon dioxide in the atmosphere? The science is clear that this increase of carbon dioxide changes the planet’s energy balance and results in the impacts that we now feel on an almost daily basis.
This political insistence on false balance is now expanding well beyond topics such as climate change. This week, President Trump started a series of tweets complaining that Google Search is purposefully biased against him and that Google is censoring out all the pro-Trump searches:
In a pair of tweets, Trump said Google search results for “Trump News” showed only the reporting of what he terms fake news media.
“They have it RIGGED, for me & others,” he said, blaming Google, part of Alphabet Inc, for what he said was dangerous action that promoted mainstream media outlets such as CNN and suppressed conservative political voices.
“This is a very serious situation-will be addressed!” Trump added. He did not offer any details.
The president promised that the government would look into the practice and take “appropriate actions.” Google is already familiar with this kind of governmental censorship. It’s exactly what kept the search engine out of China for many years, but now the company is trying to regain its market there by cooperating with the Chinese government to create a separate search engine with built-in censorship. At the same time, it is also gathering tools with which to deal with our president.
Over this last weekend (Thursday – Sunday) we all witnessed the sad yet inspiring memorial/funeral events mourning the death of Senator John McCain. There was no escaping the repeated comparison between the version of the US that Senator McCain was fighting for and the state of the country under our current government. Next week’s blog will focus on the late senator’s attempts to mediate our efforts to confront climate change.


 [CC BY 2.0 (https://creativecommons.org/licenses/by/2.0)], via Wikimedia Commons")

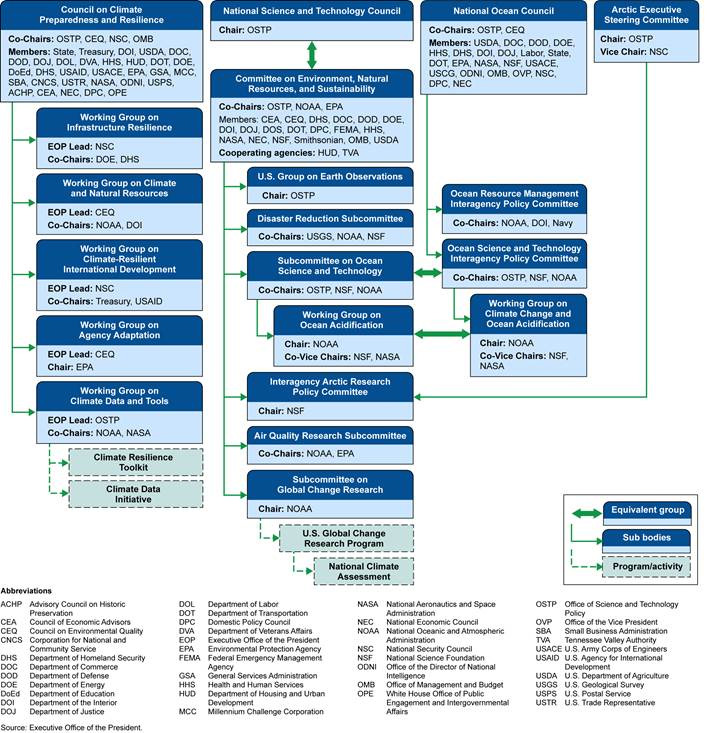
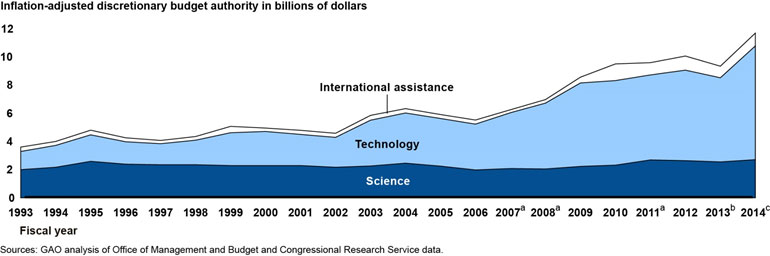 Figure 1 – Reported Federal Climate Change Funding by Category, 1993-2014