Robotics

Earlier this month (February 1, 2022), I mentioned the steps that Germany and the US have taken recently to remediate the decline in their workforces. Both countries basically declared that they are going to initiate brain drains from abroad (mainly from poorer countries). Germany said that it intends to initiate the yearly immigration of 400,000 skilled workers, while the US announced a new policy to facilitate the attraction of students in the sciences, presumably with the thinking that many of them will stay once they finish their studies.

The decrease of the “native” (excluding immigration) workforce follows a global decrease in fertility rates and an increase in life expectancy. Type “population decrease” into the search box and you will find multiple earlier entries that relate to the topic. However, only one significant entry pops up if you search for “robotics” (February 11, 2014) and it’s from 8 years ago. It addresses the global shipment of robots, using data through the year 2011. It’s time to revisit the issue.

robot, manufacturing, jobsFigure 1

Figure 1, taken from The Robot Report, summarizes the issue as it stands presently. The site adds the following information:

There are more than three million industrial robots operating in factories around the world, according to the International Federation of Robotics (IFR). In 2020, there was $13.2 billion of new robot installations.

Robot density, a metric used by the IFR, measures the number of robots per 10,000 workers in an industry. From 2015 to 2020, robot density nearly doubled worldwide, jumping from 66 units in 2015 to 126 units in 2020. In 2020 alone, robot density globally jumped from 113 units in 2019 to 126 units.

Regionally, Asia has the highest robot density in 2020, sitting above the global average at 134 units. Europe is slightly below the global average, with 123 units, followed by the Americas with 111 units.

The total number of people employed worldwide is estimated at 3.3 billion. In contrast, about 3 million industrial robots operate around the world, meaning they account for only 0.1% of the global workforce. However, in South Korea (the Republic of Korea) robots already account for 10% of the workforce and globally, the growth rate of robotics is 10%. These are significant numbers. Presently, the shift to robotics is confined to rich countries (including S Korea).

Figures 2 – 6 show the recent population changes that are taking place in the five countries with the largest robot densities, as shown in Figure 1. Each of these countries has its own dynamic.

population, decline, Japan, South Korea, Korea

Figure 2Population changes in Japan and South Korea (Source: World Economic Forum)

Singapore, population

Figure 3Population changes in Singapore (Source: Countryaah.com)

Germany, population

Figure 4Population changes in Germany (Source: Visual Capitalist)

What deserves special attention is the relative changes in the age group composition in Germany, as shown in Figure 5.

Germany, population, change

Figure 5 Changes in the age distribution of the German population (Source: Visual Capitalist)

Sweden, population, growth

Figure 6 Changes in the population growth of Sweden (Source: Statista)

The increases in robotics and brain drain haven’t yet caused social and governmental disruptions on the level of increased immigration but we are still at the beginning of the trend. This gives us some time to address the social consequences that are sure to come.

Posted in Economics | Tagged , , , , , , , , , , , , , , | 1 Comment

Petrostates

Right now, in the energy transition, there is an emerging weaponization of energy. Russia’s confrontation with the West over Ukraine is the present focal point. The following two publications provide some details:

“What Happens if Russia Cuts Off Europe’s Natural Gas?” – The New York Times

While Russia masses troops and military equipment near its border with Ukraine, parallel tensions have been building in world energy markets.

It is not hard to see why. Natural gas flowing through a web of pipelines from Russia heats homes and power factories across much of Europe. Russia is also one of the continent’s key sources of oil.

Now Western officials are considering what happens if Moscow issues a doomsday response to the tensions — a cutoff of those gas and oil supplies, in the depths of Europe’s winter.

The standoff over Ukraine comes at an inopportune time. World energy prices are already elevated as supplies of oil and natural gas have lagged the recovery of demand from the pandemic.

Russia Isn’t a Dead Petrostate, and Putin Isn’t Going Anywhere – The New York Times Opinion

Some may see Russia’s actions as the last gasp of a fading petrostate before the energy transition robs the country of geopolitical power. But that would be wishful thinking. The transition to a clean energy economy may actually empower Vladimir Putin, Russia’s president, and other petrostate leaders before it diminishes them.

In a world that is “net zero” on its carbon emissions, major fossil fuel producers — especially Russia — will be greatly diminished in their power, assuming they do not find a way to remake their economies in the interim. But in the next 10 to 20 years, the energy transition will make opportunities for petrostates to wield significant geopolitical and economic power. There are at least three reasons this is the case.

Petrostates obviously have the ability to use energy supply as a weapon, one reason that they are also the most desperate to slow the transition away from fossil fuels. I am sensitive to these dynamics. I have mentioned often on this blog that I grew up in Israel. At the time, Israel was surrounded by petrostates that were in a state of war with my country, trying to weaponize their energy. As a student, I chose to specialize in alternative energy use—not because of climate change but in an attempt to help develop alternatives to the state’s energy supply.

Below is how Wikipedia defines petrostates:

petrostate is a nation whose economy is heavily dependent on the extraction and export of oil or natural gas. The presence alone of large oil and gas industries does not define a petrostate, as countries like Norway, Canada, and the United States are major oil producers, but also have diversified economies.[1] Petrostates also have highly concentrated political and economic power, resting in the hands of an elite, as well as unaccountable political institutions which are susceptible to corruption.[2]

While the largest oil-producing states are often petrostates, this is not always true. In 2014, for example, the United States and Canada were among the top-five oil producing countries, but are not defined as petrostates due to their diverse economies.[1] Various countries have been identified as current or former petrostates:[2][1]

Although Norway, the US, and Canada are among the largest exporters of fossil fuels, their economies are diversified, meaning that they can handle fluctuations of the energy markets much better than the countries Wikipedia defines as petrostates. Before the pandemic and the emergence of the Russia-Ukraine crisis, The Economist ran an article with some updated data about the need for energy producers to diversify:

Figure 1The dependency of major energy producers on income from energy exports

Revenues from oil and natural gas have plunged in recent years, as prices have fallen. A new report from the International Energy Agency (IEA) puts the challenge in stark relief. In six large petrostates the IEA examined—Iraq, Nigeria, Russia, Saudi Arabia, the United Arab Emirates and Venezuela—net income from oil and natural gas in 2016 was less than one-third of its level in 2012. Such a huge drop-off is painful. In Russia, oil and gas receipts account for about 40% of the government’s revenue. In Iraq they account for 90%.

The response to sinking prices has varied. Many countries ran deficits rather than slash their generous domestic spending programmes. Bahrain requires a crude price of $113 a barrel to support its budget, according to MUFG, a bank. But most countries have started talking more earnestly about diversification. Fatih Birol, director of the IEA, predicts that countries’ efforts will gain more urgency for two reasons.

Russia stands out in this analysis both in terms of its dependence on this income and the income’s changes over time.

I have repeatedly emphasized the need to pay attention to both the winners and losers of the various transitions that we are going through— (see for example, “Winners and Losers: COVID and Coal” from February 9, 2021; “Yellow Vests, Al Gore, President Trump, Conflicts Between Present and Future” from December 18, 2018; and “Wisdom from Germany: How to Transition Away from Coal” from October 8, 2019).

As the current crisis with Russia shows, the price of not paying attention to the losers can be deadly.

Posted in Energy, Sustainability | Tagged , , , , , , , , , , , , , , , | Leave a comment

Back to the Energy and Population Transitions: Electrification and Brain Drain

In this blog, I will look at the ongoing global energy transition and the declining populations of rich countries around the world. I am specifically interested in attempts to redefine sustainable energy sources, as well as the ways in which brain drains from developing countries are affecting the populations of rich countries.

As a background, Figure 1 shows an infographic, constructed by Visual Capitalist, of the global use of nuclear energy to power electricity production:

Figure 1Global use of nuclear power for electricity production

Attempts to Define Sustainable Energy Sources

Figure 2 shows that, at least in the US, coal is on its way out. In other developed countries, the trend is similar. The issue is how to replace it as the primary energy source for electricity generation.

Figure 2Changes in US coal use for electricity generation (source: CleanTechnica)

Europe is finding itself with severe energy shortages and price increases. In an attempt to remedy the shortage, the EU declared natural gas and nuclear energy to be “sustainable energy sources.” This declaration didn’t come without serious opposition, however

Advisers to slam EU plan to label gas, nuclear investments as green-draft:

BRUSSELS, Jan 21 (Reuters) – Experts advising the European Union on its green investment rules will warn Brussels not to go ahead with draft plans to label gas and nuclear energy as sustainable, according to a document seen by Reuters.

The Commission’s proposals would grant gas plants a green label until 2030 if they meet criteria including an emissions limit of 270g of CO2 equivalent per kWh, or if their annual emissions average 550kg CO2e per kW or less over 20 years.

Germany cries foul over nuclear energy in EU’s green investment rule book:

BERLIN, Jan 22 (Reuters) – German Chancellor Olaf Scholz’s three-party coalition government has voiced its objections to a European Union draft plan to label nuclear power plants as a sustainable energy source in a formal letter to Brussels, ministers said on Saturday.

The EU taxonomy aims to set a gold standard for green investments, helping climate-friendly projects to pull in private capital and stamping out “greenwashing”, where investors and companies overstate their eco-credentials.

“As the federal government, we have once again clearly expressed our rejection of the inclusion of nuclear energy. It is risky and expensive,” Vice Chancellor and Economy Minister Robert Habeck said in a joint statement with Environment Minister Steffi Lemke, both senior members of the Greens party.

The US is not far behind. As Figure 1 shows, the US is the largest user of nuclear energy for the production of electricity. However, in the US, nuclear energy is not currently facing serious objections.

Many US states view natural gas as a somewhat sustainable energy source because of its considerably lower carbon output per unit of electricity production, compared to coal (See May 25, 2021 blog). However, its use has not escaped the current political divide within the US. Figure 3 shows that various states have taken legal steps to either prohibit or advance the use of natural gas in the construction of new power stations.

Figure 3US States advancing and prohibiting the use of natural gas to power electrification (source: CleanTechnica)

These policy shifts are starting to have consequences.

Brain Drain From Developing Countries

In another facet of the future, there is a tremendous brain drain currently taking place among front-line personnel. Doctors and nurses from around the world have turned out to help confront the COVID-19 pandemic, especially in rich countries but this will inevitably have an effect on the countries that they leave behind. Indeed, Germany already announced plans detailed plans continue to draw such people:

Germany wants to attract 400,000 skilled workers from abroad each year:

BERLIN, Jan 21 (Reuters) – Germany’s new coalition government wants to attract 400,000 qualified workers from abroad each year to tackle both a demographic imbalance and labour shortages in key sectors that risk undermining the recovery from the coronavirus pandemic.

“The shortage of skilled workers has become so serious by now that it is dramatically slowing down our economy,” Christian Duerr, parliamentary leader of the co-governing Free Democrats (FDP), told business magazine WirtschaftsWoche.

The US announced its intention to attract foreign students in the sciences, with the hope that many of them will stay after finishing their studies:

The Biden administration on January 21 announced policy changes to attract international students specializing in science, technology, engineering and math — part of the broader effort to make the US economy more competitive.

The State Department will let eligible visiting students in those fields, known as STEM, complete up to 36 months of academic training, according to a notice in the Federal Register. There will also be an initiative to connect these students with US businesses.

Homeland Security will add 22 new fields of study — including cloud computing, data visualization and data science — to a program that allows international graduates from US universities to spend up to three additional years training with domestic employers. The program generated about 58,000 applications in fiscal 2020.

The programs are designed to ensure that the US is a magnet for talent from around the world, attracting scientists and researchers whose breakthroughs will enable the economy to grow. Government data shows that international students are increasingly the lifeblood of academic research.

Such brain drains, as a response to population decline, are bound to have deadly global consequences for both rich and developing countries.

Next week’s blog will start to focus on individual countries that lead attempts to confront various global transitions. I will start with the petrostates.

Posted in Climate Change, Electricity, Energy, Sustainability | Tagged , , , , , , , , , , , , , , | 1 Comment

How to Explain Reality

Courtesy of Wonderopolis

Last week’s blog focused on the name change of Facebook to Meta and on the cherry-picking phenomenon of selectively picking reality to fit our biases and trying to recruit more adherents to our views of reality. The borderlines between virtual, alternate, and “real” reality are getting increasingly blurred.

I have been using the break between semesters and the COVID-induced travel restrictions as an opportunity to try to learn a bit more about the nature of reality–real or virtual or somewhere in between. I started this process at the same time last year, summarizing these efforts with my February 2, 2021, blog on the “Physics of Reality.” The main arguments in that blog were that physics is quantitative and uses the scientific method,  and that the emergence of social physics now includes some human activities (climate change and networking as examples). I started addressing this even earlier, with the October 6, 2020 blog, “Arguing Over Different Realities.” Today, I will try to go a bit deeper.

I will start with some definitions.

Merriam-Webster’s most general definition of “science” is: “knowledge about or study of the natural world based on facts learned through experiments and observation”.

Its definition of “reality” is: “something that actually exists or happensa real event, occurrence, situation, etc.”

Merriam-Webster defines “virtual realityas: “an artificial environment which is experienced through sensory stimuli (such as sights and sounds) provided by a computer and in which one’s actions partially determine what happens in the environment”

Wikipedia gives us a more detailed version of the latter:

Virtual reality (VR) is a simulated experience that can be similar to or completely different from the real world. Applications of virtual reality include entertainment (particularly video games), education (such as medical or military training) and business (such as virtual meetings). Other distinct types of VR-style technology include augmented reality and mixed reality, sometimes referred to as extended reality or XR.[1]

Currently, standard virtual reality systems use either virtual reality headsets or multi-projected environments to generate realistic images, sounds and other sensations that simulate a user’s physical presence in a virtual environment. A person using virtual reality equipment is able to look around the artificial world, move around in it, and interact with virtual features or items. The effect is commonly created by VR headsets consisting of a head-mounted display with a small screen in front of the eyes, but can also be created through specially designed rooms with multiple large screens. Virtual reality typically incorporates auditory and video feedback, but may also allow other types of sensory and force feedback through haptic technology.

It seems that we are much better at defining virtual reality than the real-world variety.

As I mentioned in last week’s blog, I teach three courses on the undergraduate level: two related to climate change and one on cosmology. Within our studies of climate change, there is an obvious need to distinguish between reality (i.e. what is “factual” or “true”) and an alternative understanding of the world, based on biases and self-confirmation. The common adage is, “follow the science.” Well, that’s what I am teaching. To many, cosmology is “pure” science: anchored on the scientific method. For many others, it is heavily influenced by religious beliefs—something that I discuss in the course. Understandably, there are those that use religion to explain the things that science cannot fully understand. In my classes, after early warnings to students to try not to mix religion with science, I continue to describe cosmology as the scientific description of reality on the grandest scale.

Most of us are experiencing interesting aspects of our “true” reality. As I mentioned throughout previous blogs, I have family living in every continent other than Antarctica. The pandemic prevents us from seeing each other face-to-face, so we try to maintain contact through telephone calls or virtual meetings through systems such as Zoom. I have family in Melbourne, where the Australian Open is now taking place. The event has been in the news beyond just sports coverage because of COVID-19 vaccination issues with player Novak Djokovic. The time difference between NYC and Melbourne is 16 hours; if we want to make virtual contact with Australia, we know how to adjust the timing to be convenient for all of us. However, we never think about the possibility that time itself might change with the distance: that seconds, minutes, and hours might have different lengths on our respective watches. Such changes are essential to Einstein’s Theories of Relativity, which are essential to understanding cosmology.

I used my semester break to revisit The Road to Reality, a book by Roger Penrose, whom Wikipedia describes as a “British mathematician, mathematical physicist, philosopher of science, and Nobel Laureate in Physics.”

Penrose received the Nobel Prize in Physics in 2020 for his work on black holes, much of which was done in collaboration with Stephen Hawking. In his book, Penrose quotes Hawking: “I don’t demand that a theory corresponds to reality because I don’t know what it is, Reality is not a quality you can test with litmus paper. All I’m concerned with is that the theory should predict the results of measurements.”

Penrose’s book is full of advanced mathematics that most of us are not equipped to follow but there are some publications that break down the issues in ways that are more accessible for the general public, including an article in Scientific American and Michio Kaku’s new book, The God Equation (Doubleday, 2021).

Admittedly, the type of reality that Penrose and Hawkins are trying to understand is at the furthest fringes of cosmology, which include the Big Bang and black holes. While we can use the scientific method for everything that leads up to them, measurements, as invoked by Hawkins, cannot be carried out directly in such extreme conditions. This leaves us with some open questions, on which we use mathematical theories based on the data that we actually can measure.

Often, even attempts to understand reality on such a level are compared to efforts to second-guess God’s creations. However, even on this level, cherry-picking is prevalent, mostly pertaining to our favorite mathematical theories. In Penrose’s book, he is very careful to mention whenever a statement is subjective and his opinion is not necessarily shared by many others. Most of us are not that good at differentiating.

Posted in Climate Change, Education | Tagged , , , , , , , , , , | Leave a comment

Meta (Facebook) and Cherry Picking

A recent announcement from Facebook informed us all that “Connection is evolving so are we … welcome to Meta.”

While I was not born there, I grew up in Israel, so Hebrew is my “native” language. In Hebrew, “meta” refers to a dead female. Following this line of thinking, Facebook chose to describe itself as a dead female company. However, according to the Oxford Learner’s Dictionary, meta is an adjective: “(of a film, work of literature, art, etc.) showing awareness of itself or its genre.” Its synonym is “self-referential.” In this context, the company presents itself as a self-referential communicator of reality. I am paying attention.

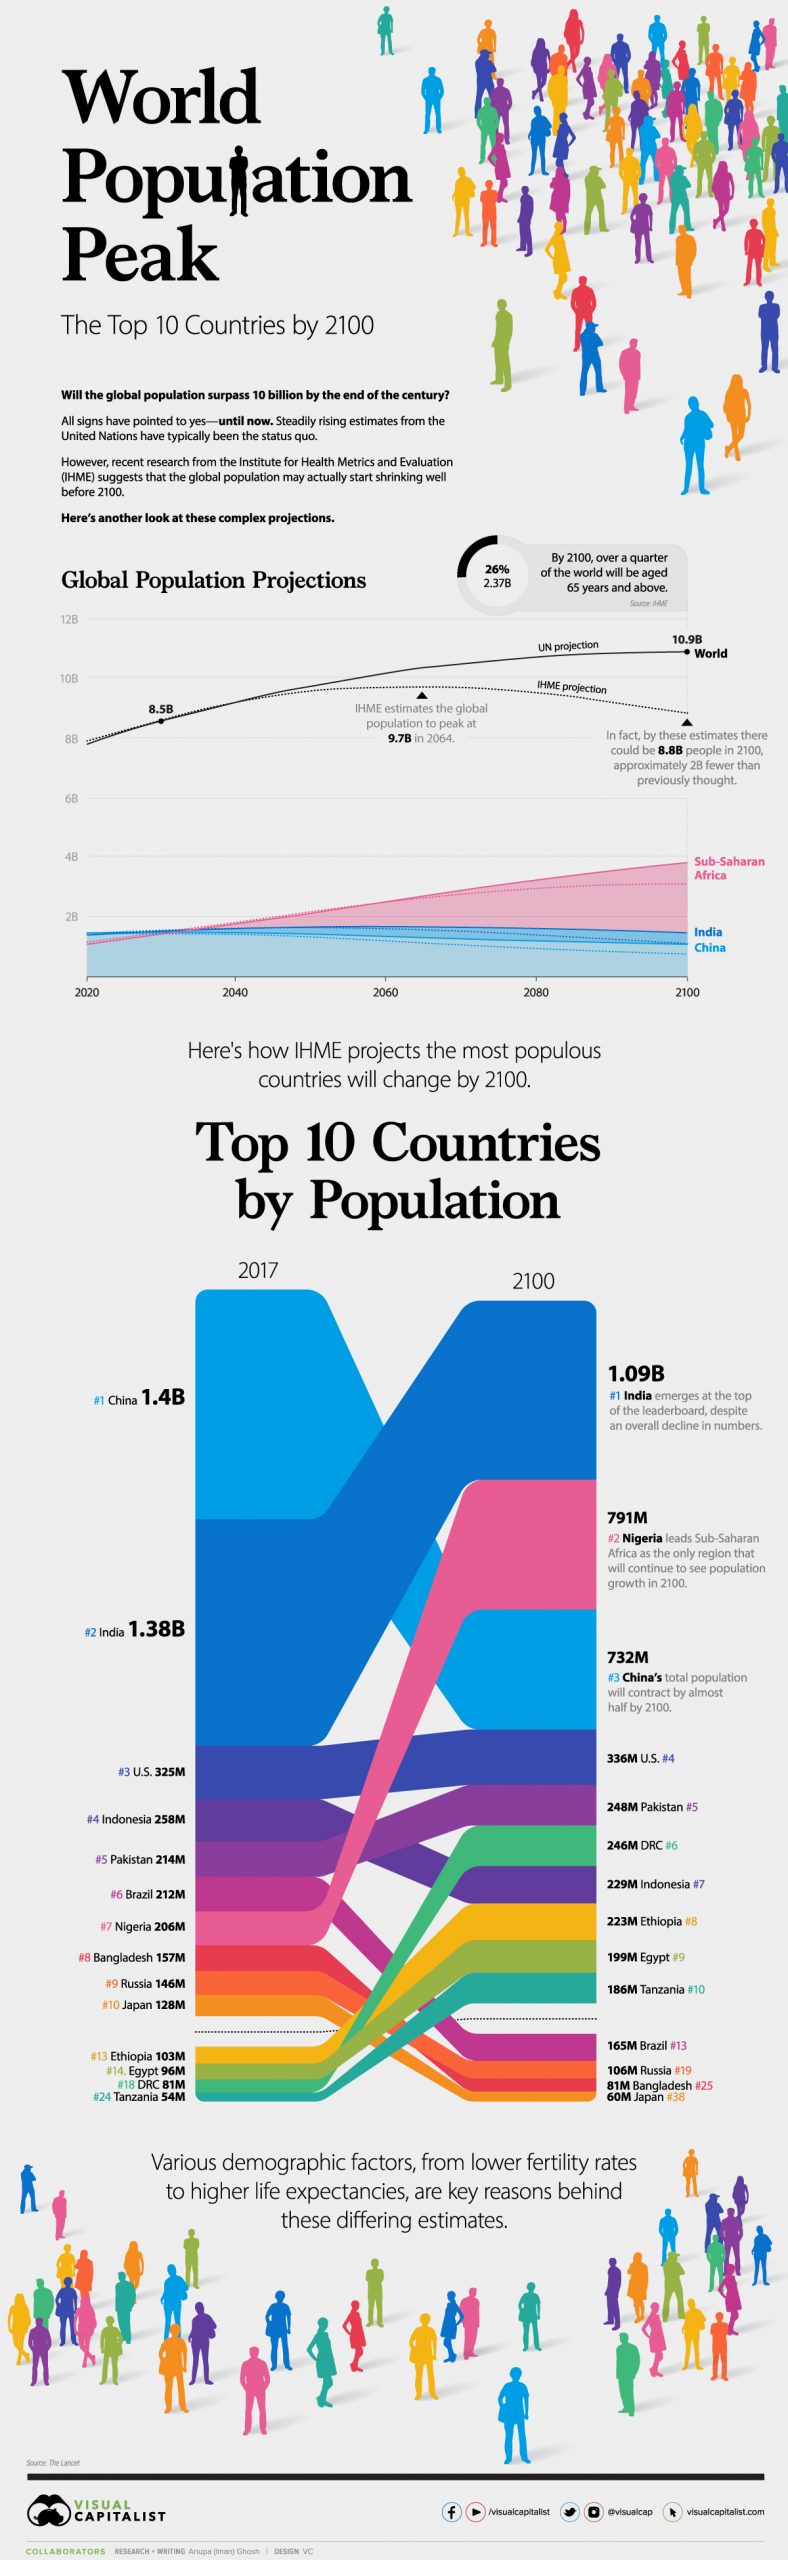
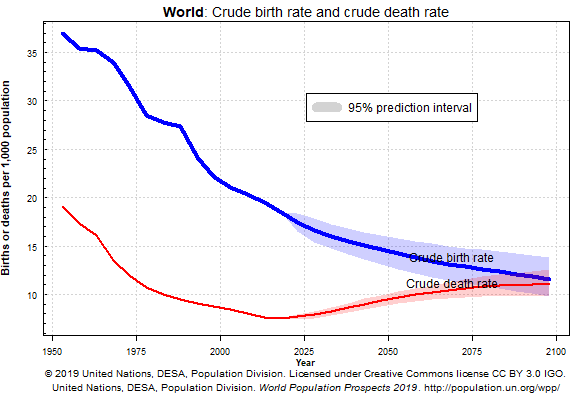
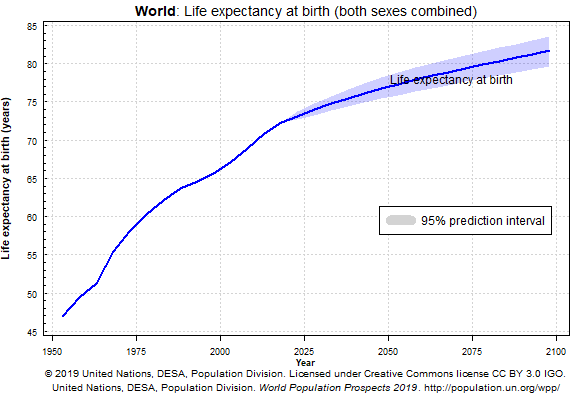
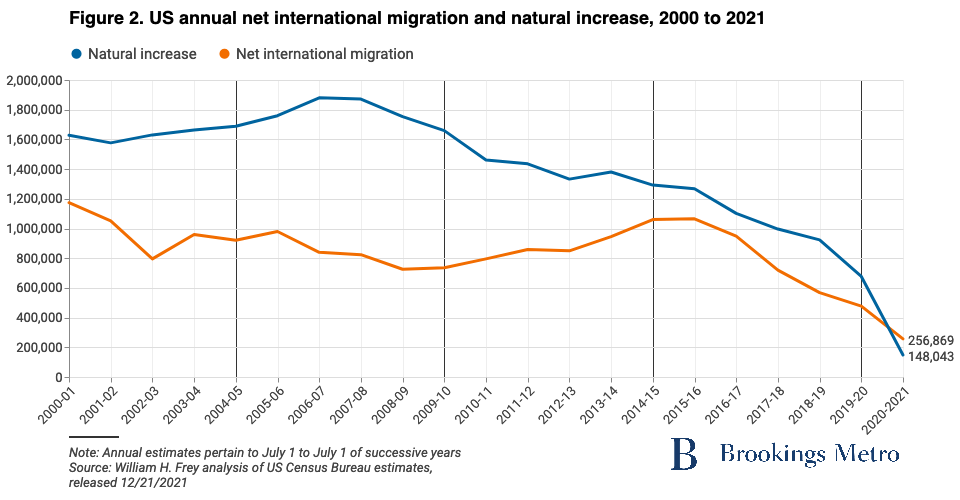
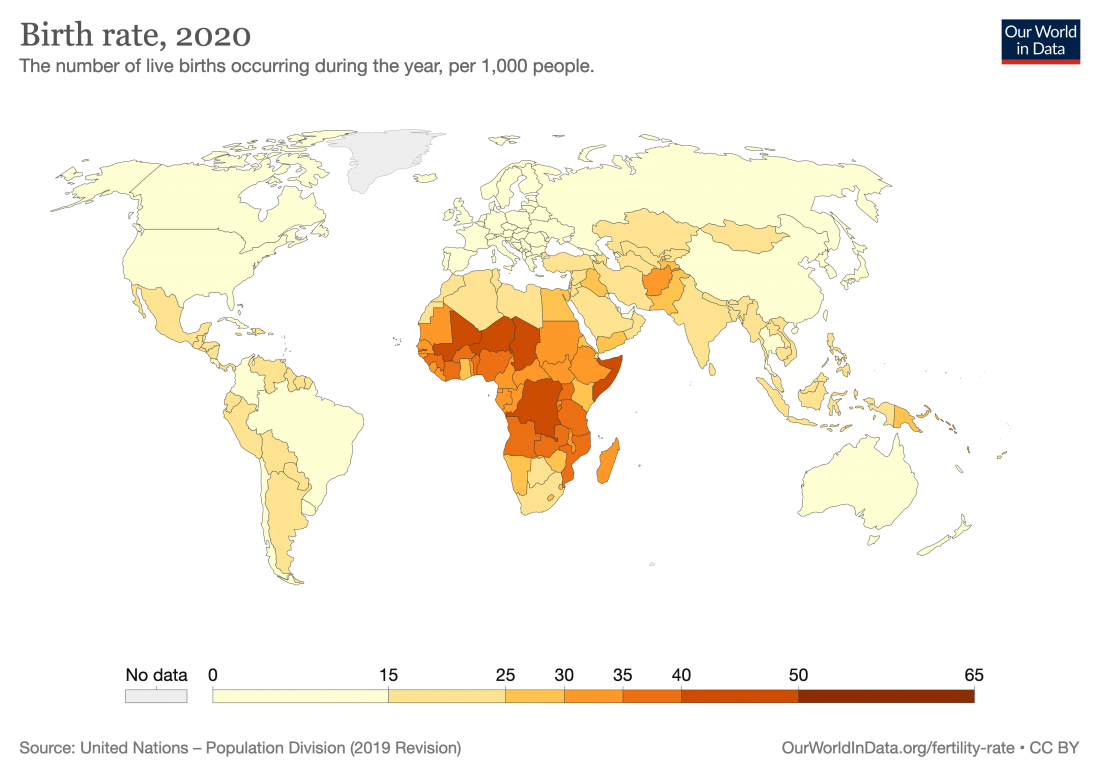
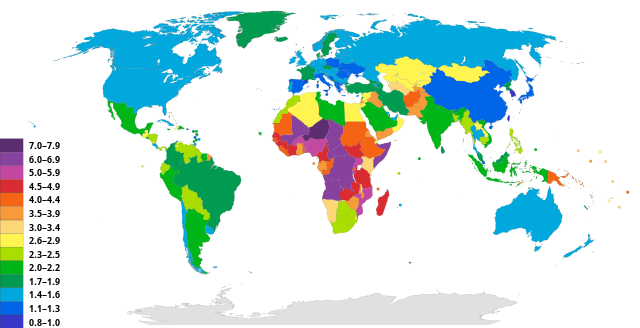
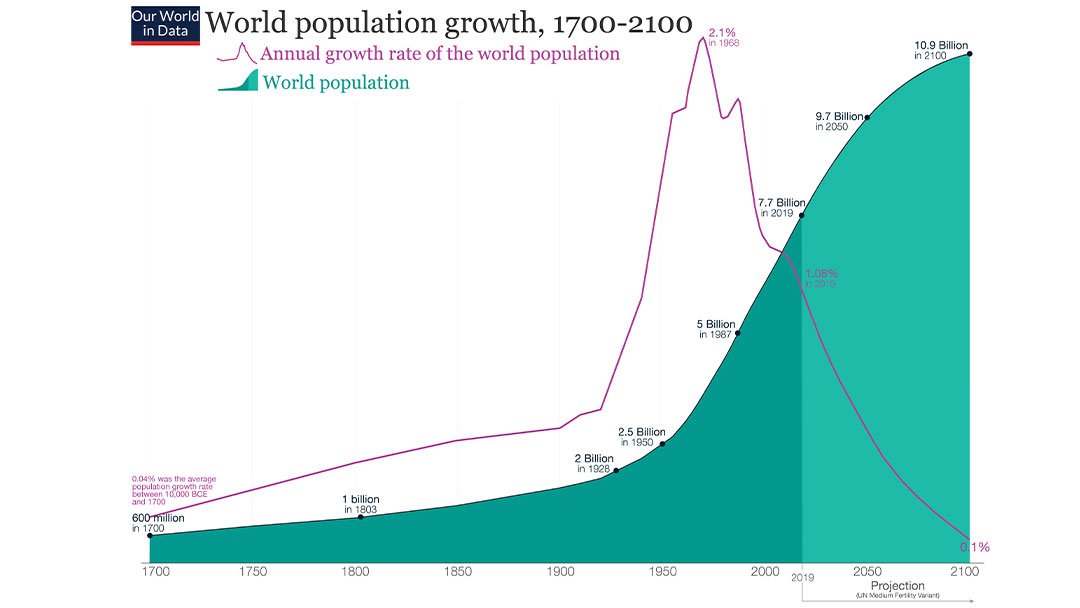
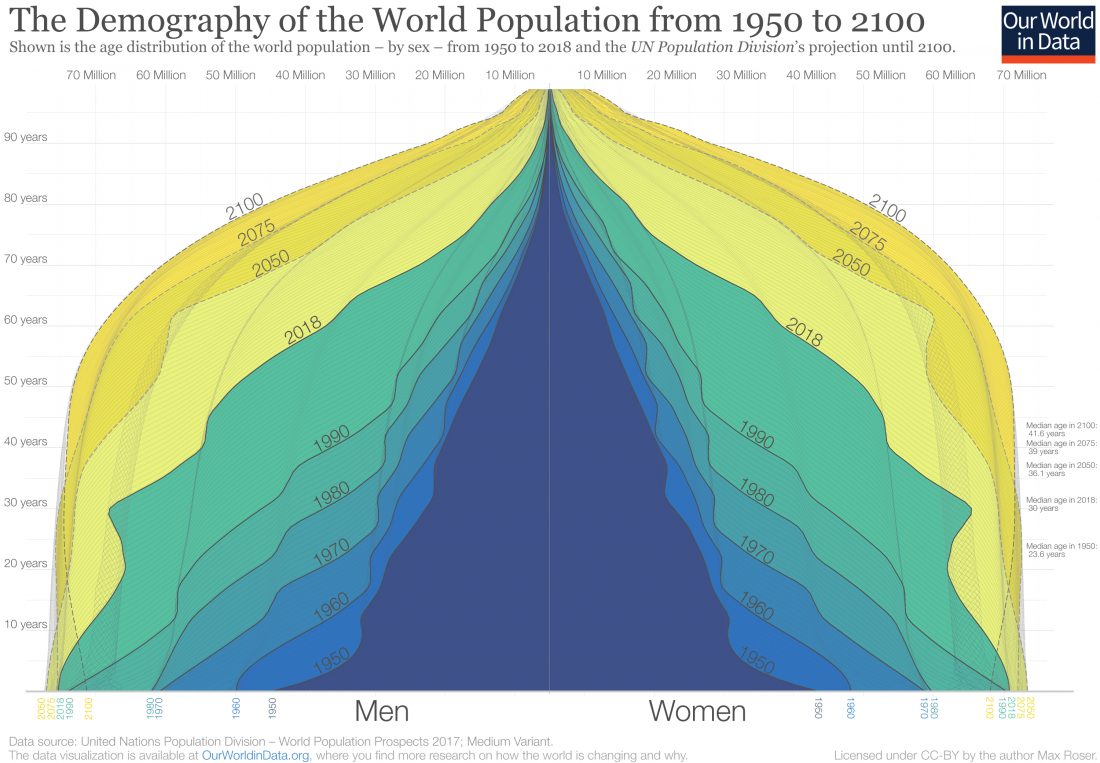
As I have often mentioned on this blog, I teach three courses at the undergraduate level: one on cosmology and two that focus on climate change. In these courses, I use reality to construct my syllabi. I have been using this blog to describe the three global transitions that we are now going through: the pandemic, climate change, and the shrinking global population. In both my teaching and my writing, my main objective is to help my students and readers make sense of the science that drives these transitions, using language that overcomes the need for prerequisites like traditional science courses.

One of these transitions, the COVID pandemic, is short-lived, with an end in sight (hopefully). The other two are projected to grow throughout the lifetime of my students (the “end of now” in my book on climate change).

I am trying to teach basic principles that will stay with the students (and everybody else) throughout all of these transitions and thus facilitate their adaptation to changes in their respective realities. The first thing that I am trying to share with you and my students is that while all of us are part of a collective reality, we each have biases that shape our own perception of reality. Some of these are shared biases, some are our own and come from our life experiences (see the November 2128 2017 blogs on “Collective Irrationality and Individual Biases”).

From FunkyEnglish.com

When I present to my classes and this blog, I am in a position of some authority, so my biases hold some weight. This is probably more important for my students than my readers because they are dependent on my grading and often need recommendation letters to facilitate their entry into other parts of life. It is unavoidable that all of us: teachers, students, and readers, cherry-pick details and data that will enforce some of our biases. In the past, I have described such cherry-picking in terms of Godwin’s law for applying lessons from the Holocaust (January 19, 2021), the economic risks of climate change (December 24, 2019), and who is to blame for climate change (June 20, 2017). Wikipedia has an entry that describes the practice:

Cherry pickingsuppressing evidence, or the fallacy of incomplete evidence is the act of pointing to individual cases or data that seem to confirm a particular position while ignoring a significant portion of related and similar cases or data that may contradict that position. Cherry picking may be committed intentionally or unintentionally.[1]

The term is based on the perceived process of harvesting fruit, such as cherries. The picker would be expected to select only the ripest and healthiest fruits. An observer who sees only the selected fruit may thus wrongly conclude that most, or even all, of the tree’s fruit is in a likewise good condition. This can also give a false impression of the quality of the fruit (since it is only a sample and is not a representative sample). A concept sometimes confused with cherry picking is the idea of gathering only the fruit that is easy to harvest, while ignoring other fruit that is higher up on the tree and thus more difficult to obtain (see low-hanging fruit).

Cherry picking has a negative connotation as the practice neglects, overlooks or directly suppresses evidence that could lead to a complete picture.

Cherry picking can be found in many logical fallacies. For example, the “fallacy of anecdotal evidence” tends to overlook large amounts of data in favor of that known personally, “selective use of evidence” rejects material unfavorable to an argument, while a false dichotomy picks only two options when more are available. Some scholars classify cherry-picking as a fallacy of selective attention, the most common example of which is the confirmation bias.[2] Cherry picking can refer to the selection of data or data sets so a study or survey will give desired, predictable results which may be misleading or even completely contrary to reality.[3]

A video of Rand Paul recently re-surfaced that demonstrates the danger of such misinformation.

None of us is completely free of bias; those few who strive for “objectivity” must understand their own while filtering through those of others. This burden falls not only on the teacher or writer but must also be shared with the students and readers. This is not an easy task, however. For students, most class material is new, making it very hard for them to identify cherry-picking and biases. It is, therefore, the responsibility of the educational system to come up with a methodology that enables students to do so. This is a researchable issue that falls under the more general field of communication. A 2017 study by Luke Lefebre, Leah Lefebre, and Dale Anderson looked at 47 communication centers within US universities and tracked the changing trends in their organization, operation, services, etc.

Such centers focus on the usual tools of communication, including writing and speaking, as well as the more recent platforms for digital communications, in which Meta features heavily. I haven’t done any research on this issue yet, so I have no idea what resources these centers have to investigate biases.

Biases used to play the smallest role in physical sciences, probably because the self was removed from these disciplines. This is no more.

In an earlier blog (February 2, 2021), I discussed the connection between physics and reality. Traditionally, physics has been taught as disconnected from humans; everything connected with humans fell under the disciplines of social studies, humanities, and art, as opposed to “physical” or “natural sciences.” Now, things are changing. At Brooklyn College, where I teach, they all fall under the School of Natural and Behavioral Sciences (NBS), which includes psychology, anthropology, kinesiology, and interdisciplinary studies such as climate change (see my December 28, 2021 blog on the latter).

There are attractive opportunities for detailed studies of the global transformations that are taking place in front of all our eyes: they offer to prepare students to be part of these transitions after they finish school. The government has imposed certain mandates aimed at adapting to these various transitions. In the same way that I discussed in my “Campus Transition into Sustainability Teaching Laboratory” blog (June 18, 2019), we can use these as laboratories through which to learn the fundamentals of the disciplines that we are trying to master.

In the US, much of the funding for government-supported research comes from the NSF (National Science Foundation). When academics are applying for funds to conduct original research—whether new teaching methodology or pure scientific research, they submit proposals, which are judged on two criteria:

  • Intellectual Merit: The Intellectual Merit criterion encompasses the potential to advance knowledge.
  • Broader Impacts: The Broader Impacts criterion encompasses the potential to benefit society and contribute to the achievement of specific, desired societal outcomes.

The structure of the NSF is based on directorates and it mostly reflects the disciplinary academic structure of the sciences. However, it is slowly changing and has added two new directorates to reflect the more general, interdisciplinary issues that society is now facing:

Directorate for Social Behavioral & Economic Sciences

SBE Office of Multidisciplinary Activities (SMA)

SBE’s Office of Multidisciplinary Activities supports interdisciplinary research and training in the social, behavioral, and economic sciences, including SBE’s intersections with other science and engineering fields.

Directorate for Education & Human Resources

Research on Learning in Formal and Informal Settings (DRL)

DRL invests in the improvement of STEM learning for people of all ages by promoting innovative research, development, and evaluation of learning and teaching across all STEM disciplines in formal and informal learning settings.

Undergraduate Education (DUE)

DUE’s programs are intended to strengthen STEM education at two- and four-year colleges and universities by improving curricula, instruction, laboratories, infrastructure, assessment, diversity of students and faculty, and collaborations.

The alternative to government-supported research on biases might return us to Meta (Facebook). The net worth of Meta is approaching $2 trillion. It might be worthwhile for the company to support self-centered communication as a business expense.

Posted in Education | Tagged , , , , , , , , , , , | Leave a comment

Population Transition Projections For the End of the Century

In last week’s blog, I mentioned a prediction that the global population would peak before the end of the century. This prediction was based on an analysis that was conducted by the Institute of Health Metrics and Evaluation (IHME) and published in The Lancet. The IHME projections differ from the UN projections that most demographers use. The two organizations use different estimates of demographic parameters such as life expectancy, migration rates, and fertility rates. Both are highly credible. Visual Capitalist, my favorite infographics site (you can find more examples by using the search box), illustrated the difference between their projections. I have included the graphic in Figure 1, along with VC’s detailed comparison of the 15 most populated countries in 2017 and those predicted to fill those slots at the end of the century. IHME’s projections also estimate that by the end of the century, about 26% of the global population will be older than 65.

Figure 1

The end of the century is knocking on most of our doors. Today’s children already have a life expectancy that will take them there. The world may face immense changes in the size and age of its population; humanity’s ability to adapt will be equally challenged in this and the anthropogenic climate change that is now taking place. I have repeatedly discussed the correlation between these two transitions throughout this blog (just put IPAT in the search box).

Last week’s blog focused on the global decline of fertility and childbirth and the resulting changes in population pyramids. Other demographic parameters play an important role as well.

Figures 2 and 3, taken from the UN demographics site, show the changes in birth rate, death rate, and life expectancy at birth from 1950 extrapolated through the end of the century. We see the death rate reaching its minimum a few years from today, then increasing slightly until the end of the century; meanwhile, the life expectancy at birth continues to increase until the end of the century.

population, birth rate, death rate, UN

Figure 2

population, life expectancy, birth, UN

Figure 3

Figure 4, which looks at the demographics of the US, tracks both the “natural increase” of the internal population (births vs. deaths) and net international migration. Both have fallen in recent years, which the Brookings Institute credits to economic factors like the Great Recession, health issues like the pandemic, and policy restrictions on immigration.

population, natural increase, migration

Figure 4

China is probably the only major country to try to adjust its demographics through top-down dictates. For many years, its objective was to constrain population growth. However, the one-child campaign worked “too well” and China is now finding itself with a population pyramid like the ones I described in last week’s blog. Now, China is trying to lean in the opposite direction. According to the South China Morning Post:

China had just 12 million babies last year, down from 14.65 million in 2019, marking an 18 per cent decline year on year.

Authorities are rolling out a variety of measures to address the issue, from financial incentives to grandparenting classes.

Some regions saw births fall more than 10 per cent, while Chizhou city in Anhui province said the number of newborns in the first 10 months of the year plummeted by 21 per cent compared to a year earlier.

In cities such as Beijing, Tianjin and Jiangsu, birth rates have been below one per cent for more than two decades.

The coronavirus pandemic has dampened the willingness of women under age 30 to give birth even further, according to researchers at Renmin University, as the number of Chinese newborns dropped by 45 per cent in the last two months of 2020 compared to the final year of the controversial one-child policy in 2016.

Experts predict China’s population could go into decline as early as this year.

To address the crisis, China in May allowed couples to have three children, ending the two-child policy introduced five years earlier. Since then, authorities at both local and national levels have responded with a variety of appeals and policy changes.

In addition to “allowing” more than three children, China is taking additional steps on the provincial level: expanding maternity leave, providing financial support, creating dating service databases for singles, freezing eggs and collecting donated ones, and providing grandparenting classes. These steps do not seem to include any mention of automation.

I haven’t spoken much about the impact of the pandemic over the last two blogs. Relative to the energy transition, climate change, and population transition, we expect (or hope) that the pandemic will be shorter in duration and more limited in terms of impact. However, there is a high probability that it will result in permanent changes in our working habits. For instance, work from home (WFH) will probably become and remain more common. Such a shift might be important to various adaptation efforts. Here is what The Economist wrote:

For workers, the great wfh experiment has gone fairly well. Adjusting to the new regime was not easy for everyone—especially those living in small flats, or with children to home-school. Yet on average workers report higher levels of satisfaction and happiness. Respondents to surveys suggest that they would like to work from home nearly 50% of the time, up from 5% before the pandemic, with the remainder in the office. But people’s actual behaviour suggests that their true preference is to spend even more time in their pyjamas. How else to explain why, even in places where the threat from covid-19 is low, offices are only a third full?

Time will tell which adaptive steps will turn out to be productive in these transitions.

Posted in Climate Change | Tagged , , , , , , , , , , , , , , , , | Leave a comment

Population Transition

Happy New Year

2021 was not a great year. We are all hoping that 2022 will be better but I doubt that will be the case. I do think, however, that we will be up to the challenges it brings.

Most of the challenges of 2021 fell under two categories of global disaster: the COVID-19 pandemic and anthropogenic climate change. I expect that the pandemic will eventually downgrade to epidemic status and that by then we will have the tools to fight it wherever it rises. Conversely, I expect the impact of climate change to get worse, with no end in sight to its impact. We have the tools to fight it, too, but our global commitments to use them are in question.

The last two months of 2021 reflected these two massive issues: due to the COP26 meeting, much of the news in November focused on climate change; December news, on the other hand, focused on COVID-19 and the emergence of the new omicron variant.

Parallel to these two disasters, another major global change emerged in the news—one that will require more and more of our attention in the coming years—population transition: fertility rates and birth rates are decreasing globally. There are a growing number of countries whose fertility rates have fallen below replacement value (around 2.1). All of this strongly suggests that soon the world population will reach its maxima even as it tends toward a shrinkage: a sort of “it gets worse before it gets better” situation, depending on your definition of “worse” or “better.” These trends result in major changes in population pyramids, decreasing the number of younger people—and the size of the workforce (roughly ages 20–65)—and increasing the number of older people.

I addressed these issues about eight years ago. You can refer to the series of blogs from December 2013 through February 2014 if some of the terms that I used in the last paragraph are unfamiliar. You will find detailed explanations with data for that period. The series of blogs includes a guest blog written by Jim Foreit (January 14, 2014), a professional demographer who actually knows what he is talking about.

This blog, and the one that will follow next week, should be considered as updates to the 2014 series. It will consist of a few recent links that indicate the accelerated pace of the global demographic transition, as well as a series of recent maps of birth and fertility rates by country.

Stacker has a decent anecdotal summary of the global demographic changes currently taking place.

Figures 1–3 describe the current global birth and fertility rates, in addition to population and annual population growth from 1700 until the end of the current century. The seriousness of the situation is reflected in the somewhat unusual voice of the Pope:

In his weekly address in front of St. Peter’s Basilica on Sunday, the Pope expressed his disappointment in Italy’s falling birth rate, or as he called it – a “demographic winter.” The Pope framed the country’s birth rate – which hit its lowest level last year since the nation’s 1861 unification – as a threat to its future wellbeing. “It seems that a lot of people have lost the wish to have children,” he said. “Lots of couples prefer to remain childless or to have one child only…It’s a tragedy…which runs counter to our families, our country and our future.” The ongoing pandemic appears to have added a new contributing factor to the country’s century-long population decline, which has continued into this year.

birth rate, population, global

Figure 1 Countries by birth rate in 2020

fertility rate, global, population

By Korakys – Own work, CC BY-SA 4.0, https://commons.wikimedia.org/w/index.php?curid=92951369

Figure 2 Map of global fertility rate

population, global, growth

Data sources: Our World in Data based on HYDE, UN, and UN Population Division (2019 Revision). Licensed under CC-by the author Max Roser.

Figure 3 World population growth and annual global population growth

Other voices that emphasize various aspects of the transition are given below:

The Economist examines the acceleration of the transition.

WION gives predictions for population maximum before the end of the century: “Currently, there are about 7.8 billion people in the world. The study has predicted that the peak in the global population would expectedly be around 9.7 billion in 2064 and then decline to 8.79 billion in 2100.”

MedicalXpress.com posits a correlation between fossil fuel use and fertility:

Chemical pollution from burning fossil fuels could play a significant part in global decline in sperm counts, a fresh study finds.

An in-depth analysis in the journal Nature Reviews Endocrinology says “industrialized regions now have rates below levels required to sustain their populations.”

Results show “reproductive health problems are partly linked to increasing exposures to chemicals originating directly or indirectly from fossil fuels” plus to pollution from using oil to make plastics and industrial chemicals.

Figures 4–6 describe the ramifications of the population changes on age distribution (population pyramids). Figure 4 shows the global changes from 1950 with projections through the end of the century.

population, global, age, Figure 4 Global population pyramid 1950–2100

Figure 5 shows, in more detail, the situation in Japan, one of the developed countries whose fertility rate has been below replacement for the longest time. The Economist gives an account of how Japan is managing this demographic change. The changes in the population pyramid are quantified in terms of three main age brackets. We can see that the ratio of the oldest bracket to the youngest bracket above goes from roughly 14% in 1950 to a projected 460% by 2050.

population, global, age, Japan

Abe, Shigeyuki. (2009). Philippines’ competitiveness and global financial meltdown : a question of Japan’s role. Philippine Review of Economics. 46. 103-123.

Figure 5 Changes of the global population pyramid of Japan 1950–2050

Figure 6 shows the changes that took place in the population pyramids of two large, medium-wealth countries (Brazil and China) and two large, rich countries (France and Japan) over two 35-year intervals. The graphs are set up so that blue represents males and red represents females. As we follow each country down its column, we see that the bottom-most bracket has shrunk in all of them from 1950–2020, albeit by different amounts.

population, age, Brazil, China, France, JapanFigure 6 Changes in the population pyramids of Brazil, China, France, and Japan in 1950, 1985, and 2020

Birth rates and fertility rates are not the only contributors to the demographics of countries. Death rates and immigration are also important contributors. The next blog will focus on these two indicators.

Posted in Climate Change | Tagged , , , , , , , , , , , , , , , , | Leave a comment

“Me” and “They” and “Us” in Campus Politics

This is my last blog of 2021, a year that has been—to put it mildly—not great for almost anybody. Let us hope that 2022 will unfold to be a better one. It is a challenge to write the last blog in a bad year; a summary is not going to do the trick. So, I am just going to stick to the subject I have discussed in the last few blogs: the conflicts between the “me,” the “they,” and the “us” on a scale that is more familiar to me: that of the university.

interdisciplinary

Figure 1 Multidisciplinary study

The intensity of academic politics is so well known that the phenomenon is popularly known as “Sayre’s law”:

On 20 December 1973, the Wall Street Journal quoted Sayre as: “Academic politics is the most vicious and bitter form of politics, because the stakes are so low.” Political scientist Herbert Kaufman, a colleague and coauthor of Sayre, has attested to Fred R. Shapiro, editor of The Yale Book of Quotations, that Sayre usually stated his claim as “The politics of the university are so intense because the stakes are so low”, and that Sayre originated the quip by the early 1950s.

This observation is routinely attributed to Henry Kissinger who in a 1997 speech at the Ashbrook Center for Public Affairs at Ashland University, said: “I formulated the rule that the intensity of academic politics and the bitterness of it is in inverse proportion to the importance of the subject they’re discussing. And I promise you at Harvard, they are passionately intense and the subjects are extremely unimportant.”[2]

Probably the most important driving force for Sayre’s law is the departmental structure of almost all higher education institutions. These departments, which generally reflect the various disciplines offered for degrees (major or minor) also start the chain that controls faculty career milestones (tenure, promotion, dismissal, etc.).

Usually, curriculum falls under the purview of the faculty, although budgetary issues can lead to some tension with a school’s administration. In some disciplines, the university’s main role is to prepare students for direct certification by the appropriate professional organization. One good example for such a major is clinical psychology. I have included the licensing requirements below:

The practice of clinical psychology requires a license in the United States, Canada, the United Kingdom, and many other countries. Although each of the U.S. states is somewhat different in terms of requirements and licenses, there are three common elements:[24]

  1. Graduation from an accredited school with the appropriate degree

  2. Completion of supervised clinical experience or internship

  3. Passing a written examination and, in some states, an oral examination

Other disciplines, such as my own (physics) don’t require licensing unless you plan to use the degree to teach courses in public schools:

You will be required to have a state-issued certification or licensure to work as a public- school teacher in any state. However, before becoming licensed, you’ll need to complete at least a bachelor’s degree program in the field of physics and a teacher training program. Academic programs in education usually contain practical experience requirements, allowing you to observe and participate in actual classroom teaching under the supervision of a licensed or certified teacher.

However, if this were the whole picture of what universities do, there wouldn’t be much difference between them and professional schools. Community colleges perform many job-preparation functions but they also serve as an important steppingstone, facilitating students’ transferring to four-year colleges.

Almost all universities provide education well beyond the undergraduate level. Often, this involves a combination between research and formal education. Such advanced studies may also require the foundation provided by general education courses and electives that fall well outside the major.

However, these activities are all maintained within the basic departmental structure. These are the building blocks of most academic institutions. Within such a structure, individual departments represent the “me,” other departments represent the “they,” and the university is the collective “us.”

I emphasized the interdisciplinary nature of climate change in an earlier series of blogs about “Educating for the Anthropocene” (May-June, 2016). Within the departmental structure, interdisciplinary education often has a hard time finding its place. However, academic institutions are starting to adapt to the interdisciplinary training and research that are demanding more and more of their attention. For instance, in some academic institutions, students are constructing their own majors, often from components that are under the purview of more than one department. CUNY has such a program:

The program is intended for students who previously earned at least 12 college credits and have the vision and drive to design, with CUNY faculty mentors, their own “majors,” which are unique and interdisciplinary areas of concentration (AOCs).

CUNY BA offers highly motivated, academically strong students a flexible, challenging, and individualized way to earn their degrees by granting students greater responsibility for the design of their course of study, relative to students earning traditional undergraduate degrees. The program is intended for students who have the vision and drive to design their own unique and interdisciplinary areas of concentration (AOCs) with CUNY faculty mentors.

The COVID-19 pandemic, which kept many campuses virtual for the greater part of the last two years, also triggered major progress in the technology and acceptance of online learning. An extreme example of that trend is the University of Southern New Hampshire, “one of the fastest-growing universities nationwide with 135,000 online students and 3,000 on campus.”

The evolution of online teaching and learning has also accelerated the shift away from local institutions toward more global institutions, as well as accelerated the development of open universities:

An open university is a university with an open-door academic policy, with minimal or no entry requirements.[1] Open universities may employ specific teaching methods, such as open supported learning or distance education. However, not all open universities focus on distance education, nor do distance-education universities necessarily have open admission policies.

Personally, I was not able to stay away from Sayre’s Law in the fights between the “me,” “they” and “us.” I co-founded the Environmental Studies Program in Brooklyn College (one of the senior colleges in CUNY) in 1996, and directed the program for 15 years. According to the recruitment brochure:

The Environmental Studies Program aims at educating students to be fluent in the languages of the social and physical sciences in the range of areas related to the environment, broadly construed. The program includes a major in Environmental Studies that currently has two concentrations: Environmental Studies and Environmental Management. The major draws on courses from 14 academic departments. The program includes a minor for students that do not choose to major in Environmental Studies but wish to complement their major with environmental education. The Major and the Minor require students to take approximately half their credits in the Social Sciences and Humanities and half their credits in the Physical Sciences. Environmental Studies students (Majors and Minors) are required to take Environmental Studies 1 and Environmental Studies 75. The program is developing a paid internship component, which will be coordinated with community service, industry, and on-campus research activities.

In 2011, however, the program was renamed and refocused. I lost the battle and was replaced. (I have tenure, so I kept my job in the school).

There is an increasing urgency in understanding and learning how to intervene in interdisciplinary issues, such as climate change, global pandemics, global inequity, and global nuclear threats. Funding institutions recognize this change and they are shifting resources to address these issues within their capabilities. Applicants for funding must now demonstrate not only the potential to generate new knowledge but also indicate the common benefits that such new knowledge will produce.

Institutions are trying to adapt. Stay tuned!

Happy New Year.

Posted in Climate Change | Tagged , , , , , , , , , , , , , , | Leave a comment

“Me” and “They” in the Climate and COVID Disasters

vaccination, anti-vax, covid, science, Kevin Siers, death

Figure 1

Figure 1 reflects the deadly strength of anti-vaccination sentiment. Its resistance to science, policy, and any desire to ensure continued public safety seems to be equally relevant for denial of climate change.

My November 17, 2020 blog, “Teaching Moment 2: How Do We Vote?” discussed the US attitude toward climate change: about 60% of respondents agreed with the statement “global warming will harm people in the US,” while 30% agreed that “global warming will harm me personally.” In other words, almost uniformly across the US, about 30% of the population separated the “me” from the “us” (personal vs. collective) in terms of consequences. If you search this blog for “climate change deniers,” you’ll find multiple entries posted over its nine-year run, starting on September 3, 2012, with the blog, “Three Shades of Deniers.” It feels like I’ve written enough about climate deniers for the moment, so this blog will focus instead on vaccine deniers (or, as they are often labeled, “anti-vaxxers”).

Anti-vaxxers are more complex than climate change deniers. Their variety of reasoning is summarized well in a Harvard blog:

Different people, different reasons for not getting vaccinated

A monthly poll tracking vaccine attitudes and experiences in the US reported in June 2021 that the top reasons people gave for deferring vaccination are:

  • the vaccines are too new or were rushed to market too fast
  • concerns about side effects or safety
  • distrust in the government or medicine, especially from people of color and others who have experienced betrayal of their trust
  • questioning the benefit of vaccination based on breakthrough infections — which typically do not cause serious illness or death, by the way — or because people would rather rely on their own immune system to fight off the virus.

The poll notes other reasons, too. More than one in 10 of people surveyed said the main reason they had not been vaccinated was one of the following:

While it may be a personal decision not to get vaccinated, the large numbers of anti-vaxxers make it a social phenomenon. Climate denial in large numbers makes mitigation and adaptation much more difficult. Often, climate change denial is anchored to political or economic consideration—not being willing to sacrifice present advantages for the benefit of future considerations. We discussed this in the context of the oil companies and the political divide.

Science Magazine described a symposium that discussed the dichotomy between anti-vaxxers and climate change deniers:

The presenters included a philosopher, a medical historian, a plant scientist, and a technology historian. Their talks underscored that the people who worry about vaccinating their children are not necessarily doubters of climate change or even against GMOs. “There are a variety of different concerns behind the resistance in each of these three areas,” said Roberta Millstein, a philosopher at the University of California, Davis. “There’s no overall organized attack going on here.” She said the two sides in each debate might even agree on the facts and the potential risks, but they have difficulty seeing eye to eye on the significance of the risks”

The anti-vax sentiment is not specific to the US and almost all the arguments that the Harvard blog mentioned have also manifested in other countries. A good example comes from a small village in Italy:

The province of Bolzano has the country’s highest level of coronavirus infection and lowest vaccination rate, as many people there prefer to rely on the pure air and herbal remedies.

With about 70 percent of the province fully vaccinated, Bolzano has the highest number of coronavirus cases per 100,000 people in Italy, and the highest share of intensive care unit beds occupied by coronavirus patients. All of the patients in intensive care were unvaccinated, Dr. Franzoni said.

Perhaps the complexity of the dichotomy of comparing the climate change denier with the vaccine denier can best be demonstrated within a single individual, Robert F. Kennedy Jr.:

While many nonprofits and businesses have struggled during the pandemic, Robert F. Kennedy Jr.’s anti-vaccine group has thrived.

An investigation by The Associated Press finds that Children’s Health Defense has raked in funding and followers as Kennedy used his star power as a member of one of America’s most famous families to open doors, raise money and lend his group credibility. Filings with charity regulators show revenue more than doubled in 2020, to $6.8 million.

Since the pandemic started, Children’s Health Defense has expanded the reach of its newsletter, launched an internet TV channel and started a movie studio. In addition to opening new US branches, it now boasts outposts in Canada, Europe and Australia and is translating articles into French, German, Italian and Spanish.

Kennedy’s environmental stewardship and its apparent contradiction with his anti-vax attitude are best described in his profile description on Wikipedia:

Since 2005, he has promoted the scientifically discredited idea that vaccines cause autism,[4] and is founder and chairman of Children’s Health Defense, an anti-vaccine advocacy group.

In 1998, Kennedy, Chris Bartle and John Hoving created a bottled-water company, Keeper Springs, which donated all of its profits to Waterkeeper Alliance.[62] In 2013, Kennedy and his partner sold the brand to Nestlé in exchange for a donation to local Waterkeepers.[63]

Kennedy was a venture partner and senior advisor at VantagePoint Capital Partners, one of the world’s largest cleantech venture capital firms. Among other activities, VantagePoint was the original and largest pre-IPO institutional investor in Tesla. VantagePoint also backed BrightSource Energy and Solazyme, amongst others. Kennedy is a board member and counselor to several of Vantage Point’s portfolio companies in the water and energy space, including Ostara, a Vancouver-based company that markets the technology to remove phosphorus and other excessive nutrients from wastewater, transforming otherwise pollution directly into high-grade fertilizer.[64] He is also a senior advisor to Starwood Energy Group and has played a key role in a number of the firm’s investments.[65]

He is on the board of Vionx, a Massachusetts-based utility scale vanadium flow battery systems manufacturer. On October 5, 2017, Vionx, National Grid and the US Department of Energy completed the installation of advanced flow batteries at Holy Name High School in the city of Worcester, Massachusetts. The collaboration also includes Siemens and the United Technologies Research Center and constitutes one of the largest energy storage facilities in Massachusetts.[66]

Kennedy is a Partner in ColorZen, which offers a turnkey cotton fiber pre-treatment solution that reduces water usage and toxic discharges in the cotton dyeing process.[67]

Kennedy was a co-owner and Director of the smart grid company Utility Integration Solutions (UISol),[68] which was acquired by Alstom. He is presently a co-owner and Director of GridBright, the market-leading grid management specialist.[69]

In October 2011, Kennedy co-founded EcoWatch, an environmental news site. He resigned from the board of directors in January 2018.

It is striking to see the juxtaposition between Kennedy’s active support for scientific endeavors that aim to mitigate climate change and his insistence on supporting the debunked anti-science, anti-vax movement. Next week, I will go smaller and try to describe the conflicts between “me” and “they” in an academic setting, with an emphasis on my own campus.

Posted in Climate Change, Energy, Water | Tagged , , , , , , , , , , , , , , , , , , , , , , , , , , | 1 Comment

Integrate “Them” with “Me” and “We”: Omicron, Climate Change and Global Threats

Fall classes are over for the semester at my school (final exams are still coming, though, so it’s not over for the students). Christmas and New Year are around the corner and now’s the time to think and make wishes. COVID-19 is not yet over so, at least for me, travel is highly restricted. We are still in the middle of a unique double global transition that requires all of us to act in ways that we are not used to.

I’ve been thinking a lot about the issue of “Them” vs. “Me” vs. “We”; it’s a theme that I have covered through this blog’s nine-year run. For example:

Inequity: The Intersection of Coronavirus, Poverty & other Expected Trends

Collective Irrationality and Individual Biases: Climate Change II

Me vs. Them vs. We – Time

Me vs. Them vs. We – Nationalism/Populism vs. Globalism

Teaching Moment 2: How Do we Vote?

It’s a sort of cumbersome concept and I asked my wife, a professor of psychology, to suggest a more compact expression. She suggested, “all of us.” I thought about it and responded that it is compact enough but it misses the dynamics of the interactions between the three components. So, she added, “all of us, uniquely.” I am still trying to figure out how I feel about that, so in the meantime, I will stick with what I had and proceed with the specifics on all the scales that I have in mind. After that, I’ll wait for your input. In this and the coming blogs, I will refer to Me, We, and Them as the “three components.”

This blog will focus on the interactions between the three components in both the energy transition and the COVID-19 pandemic. Future blogs will focus on the same two disasters, only in consecutively smaller scales of interactions within: my country, my school, and me.

Figure 1 demonstrates recent data on the global distribution of the vaccination, while Figure 2 does the same with the global distribution of carbon emissions.

Figure 1 – COVID-19 Vaccinations

The omicron variant of COVID-19 was discovered in Botswana and South Africa. Figure 1 shows that the partially vaccinated rate in each of these countries is about 30%. The NYT wrote about the correlation between low vaccination rate and the evolution of new viruses that can easily spread globally:

Most wealthy countries have vaccinated significant shares of their populations and have rapidly moved into the booster-dose phase. But one year into the global vaccine rollout, the gap between vaccination rates in high- and low-income countries is wider than ever.

Poorly vaccinated countries face several challenges. Early in the rollout process, some countries were not able to secure enough doses to inoculate their residents, and many still face shortages. In others, supply is only part of the story. A New York Times analysis of available data highlights the countries where infrastructure issues and the public’s level of willingness to get vaccinated may pose larger obstacles than supply.

Some countries that have below-average vaccination rates are using most of the vaccine doses they have on hand, and some are not. Most countries with high vaccination rates have used most of the doses delivered to them; they are clustered to the right side of the chart above.

As new viruses, such as omicron, start evolving and spreading globally, the rich countries feel compelled to recommend booster shots, which only enhances the shortages in the poor countries:

As the emergence of the omicron variant of the coronavirus has spurred governments of wealthy nations to step up booster-shot campaigns, the World Health Organization again expressed concern Thursday that the push could further undermine global vaccine equity.

“Broad-based administration of booster doses risks exacerbating inequities in vaccine access,” Alejandro Cravioto, chair of the WHO’s Strategic Advisory Group of Experts on Immunization, told reporters.

The administration of boosters is now outpacing first shots around the world.

On issues such as the pandemic and as we will see, climate change, slogans such as MAGA (Make America Great Again) are unhelpful—we’re all in this together, meaning that in such matters we don’t actually have an Us or Them—almost any disaster tends to spread globally.

Climate change doesn’t spread through viruses, but the impact is global, and while the rich countries have the resources to help poor countries to adapt (to a point), they mostly don’t seem to be doing so. The problem is that when people cannot make a living, they will try to move to places where they have a higher probability of adaptation and acceptance. The result is a major global instability with security threats to everybody. I have covered this issue in past blogs as well (See January 28, 2020).

Figure 2 comes from my favorite infographics site, VisualCapitalist, and illustrates global carbon dioxide emissions per capita.

Figure 2Visualizing Global Per Capita CO2 Emissions

The Guardian reminds us below that rich countries have contributed more than 50% of the carbon emissions, even though them make up less than 10% of the population.

“The richest 10% produce about half of greenhouse gas emissions. They should pay to fix the climate”

There is a fundamental problem in contemporary discussion of climate policy: it rarely acknowledges inequality. Poorer households, which are low CO2 emitters, rightly anticipate that climate policies will limit their purchasing power. In return, policymakers fear a political backlash should they demand faster climate action. The problem with this vicious circle is that it has lost us a lot of time. The good news is that we can end it.

Let’s first look at the facts: 10% of the world’s population are responsible for about half of all greenhouse gas emissions, while the bottom half of the world contributes just 12% of all emissions. This is not simply a rich versus poor countries divide: there are huge emitters in poor countries, and low emitters in rich countries.

For the full record, see Our World in Data.

This fact had a strong impact on the recent COP26 meeting in the unanimous final resolution in the COP26 meeting (see the November 23rd blog). The relevant entries are below:

  1. Finance, technology transfer and capacity-building for mitigation and adaptation
  2. Urges developed country Parties to provide enhanced support, including through financial resources, technology transfer and capacity-building, to assist developing country Parties with respect to both mitigation and adaptation, in continuation of their existing obligations under the Convention, and encourages other Parties to provide or continue to provide such support voluntarily;
  3. Urges developed country Parties to fully deliver on the USD 100 billion goal urgently and through to 2025, and emphasizes the importance of transparency in the implementation of their pledges; 28. Urges the operating entities of the Financial Mechanism, multilateral development banks and other financial institutions to further scale up investments in climate action, and calls for a continued increase in the scale and effectiveness of climate finance from all sources globally, including grants and other highly concessional forms of finance;
  4. Loss and damage
  5. Resolves to strengthen partnerships between developing and developed countries, funds, technical agencies, civil society, and communities to enhance understanding of how approaches to averting, minimizing and addressing loss and damage can be improved.

One of my earlier posts that I mentioned in the beginning of this blog uses a Venn diagram with circles that represent climate change, COVID-19, population, and jobs, with a central circuit that overlaps with the previous four that represents equity. The meaning of equity is broad. It can mean purposeful redistribution of resources so that everyone experiences equal gain and/or equal suffering but it can also be less purposeful: the winners may become more vulnerable as they are eventually affected by losers’ losses (e.g. refugees from poor countries fleeing to rich ones). Both aspects are important. Thus, equity is a central managing tool for society to flourish and try to make everybody better. Everyone should be involved. As I mentioned before, this is the end of the semester in my school. In the next few weeks, I am supposed to have more time. Knowing that, my French family recommended that I read Thomas Piketty’s new book, Time for Socialism. I bought it and when I scanned it, it became obvious to me that Piketty doesn’t use “socialism” the way either my extreme left French cousin or Senator Sanders and his followers do. It seems much more in the same vein as European Social Democrats or American Democratic party. I’ll let you know how it is.

Posted in Climate Change | Tagged , , , , , , , , , , , , , , , , , , , , , , , , | 1 Comment