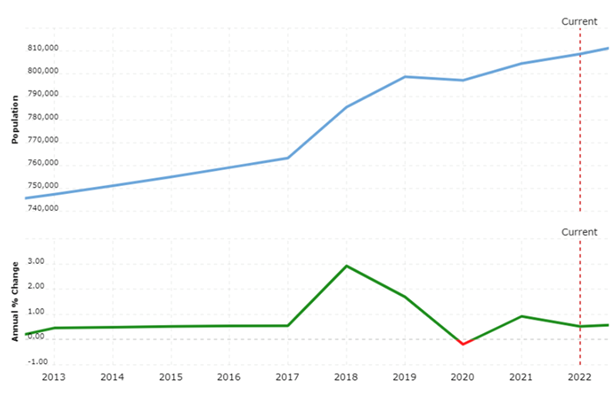
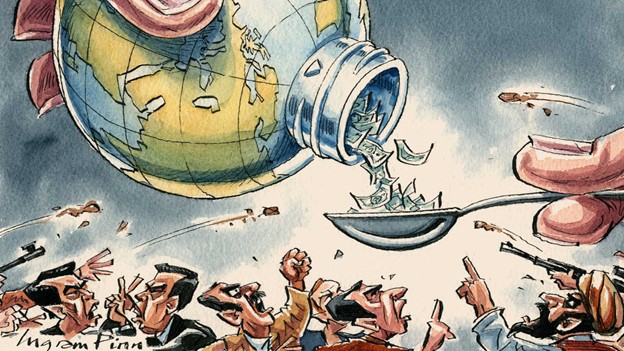
 (Source: Financial Times)
A previous blog defined the Anthropocene as “the period of time during which human activities have had an environmental impact on the Earth regarded as constituting a distinct geological age.” The same blog stated that the widely agreed starting point of the Anthropocene will be the start of the nuclear age. My last blog identified climate change and the military use of nuclear weapons as the two leading environmental impacts that represent existential threats. I also suggested that since both threats are global, we need to find ways to globalize governing to effectively minimize the threats.
Globalization is not a new issue but it has become contentious in almost any political setting. I am not an expert on this issue, so in this blog, I will go through the various relevant entries in Wikipedia, which will hopefully give us a consistent picture to work with.
Let’s start with some definitions:
In 2000, the International Monetary Fund (IMF) identified four basic aspects of globalization: trade and transactions, capital and investment movements, migration and movement of people, and the dissemination of knowledge.[10] Globalizing processes affect and are affected by business and work organization, economics, sociocultural resources, and the natural environment. Academic literature commonly divides globalization into three major areas: economic globalization, cultural globalization, and political globalization.[11]
Our emphasis on trying to minimize existential threats means that we are focusing on political globalization:
Political globalization is the growth of the worldwide political system, both in size and complexity. That system includes national governments, their governmental and intergovernmental organizations as well as government-independent elements of global civil society such as international non-governmental organizations and social movement organizations. One of the key aspects of the political globalization is the declining importance of the nation-state and the rise of other actors on the political scene. The creation and existence of the United Nations is called one of the classic examples of political globalization.
In last week’s blog, I stated that the only “stable” social structure that could act as an example of an “Anti-Snyder” form of time-independent social accretion would need to be global; that global structure doesn’t exist. I want to emphasize here that Prof. Timothy Snyder has nothing to do with the concept of an “Anti-Snyder” social structure. The concept is all mine, but it came as a result of listening (electronically) to Prof. Snyder’s course on “The making of Modern Ukraine.” As I mentioned in last week’s blog, Prof. Snyder emphasized that one does not discuss a nation by taking a fixed piece of land that corresponds to the present sovereign boundaries, populated with people similar to present people, with the same speaking language, and go back as far as you can and call this the “history” of the country (or nation). The only social structure that fits such an analysis is our global society.
Last Wednesday was the start of our spring semester. I started my cosmology course with a question to my students about the logistics of James Cameron filming his film, Avatar, on-site. The movie is about humans:
“colonizing Pandora, a lush habitable moon of a gas giant in the Alpha Centauri star system, in order to mine the valuable mineral unobtanium.[a]”
Alpha Centauri is the collection of three stars that are nearest to our sun. Their distance to the sun is approximately 4.2 Light-Years, or approximately 40 trillion km (for comparison, the circumference of the Earth is around 40,000 km). Using some assumptions about the availability of the current best technology, we were able to calculate that it would take the filming crew 80,000 years to get to their target moon. The conclusion was that unless we find some completely new technology we are stuck on this planet, for better or worse. Therefore, we’d better learn how to protect it. Governing the Anthropocene means finding the tools to protect our home. We will be able to do so only if we extend the concept of sovereignty to the global scale. Going back to Wikipedia, sovereignty is a central topic in Political Science:
In international law, sovereignty is the exercise of power by a state
The following paragraph from the site emphasizes some details about the complexity of the concept:
In 2005, the revision of the concept of sovereignty was made explicit with the Responsibility to Protect agreement endorsed by all member states of the United Nations. If a state fails this responsibility either by perpetrating massive injustice or being incapable of protecting its citizens, then outsiders may assume that responsibility despite prior norms forbidding such interference in a nation’s sovereignty.[27]
In my understanding, two main issues stand out in such a transition to global governance. One of the issues is probably not very controversial – global governance must be federal, based on sovereign states. Below is a short description of what is needed:
Federalism is a combined/compound mode of government that combines a general government (the central or “federal” government) with regional governments (provincial, state, cantonal, territorial, or other sub-unit governments) in a single political system, dividing the powers between the two. Federalism in the modern era was first adopted in the unions of states during the Old Swiss Confederacy.
The second issue is probably much more controversial. There are prerequisites for people in governing the Anthropocene. They have to have some understanding of science, economy, and social science as they relate to the environment that we will be facing. In this sense, there is a similarity to the medical profession, making international institutions such as the WHO (World Health Organization), or national institutions such as the CDC (Center for Disease Control) in the US, good starting points.
Fortunately, the infrastructure for global governance exists in the form of the United Nations, which was created after World War II. The UN defines its global mandates quite broadly:
As the world’s only truly universal global organization, the United Nations has become the foremost forum to address issues that transcend national boundaries and cannot be resolved by any one country acting alone. Taking a global view reveals some interesting facts.
Did you know:
-
that most of the world’s people live no more than 200 miles from the sea?
-
that decolonization changed the face of the planet, creating more than 80 nations?
-
that women in the labour market still earn on average a quarter less than men globally?
The UN has specific websites for the various issues below:
- Africa
- Ageing
- AIDS
- Atomic Energy
- Children
- Climate Change
- Decolonization
- Democracy
- Disarmament
- Ending Poverty
- Food
- Gender Equality
- Health
- Human Rights
- International Law and Justice
- Migration
- Peace and Security
- Population
- Refugees
- Sustainable Development
- Water
- Youth
The charter of the UN was drafted at the end of WWII and is worth revisiting. Here, I will only cite Article 1, in which I have emphasized a few key points:
Article 1
The Purposes of the United Nations are:
- To maintain international peace and security, and to that end: to take effective collective measures for the prevention and removal of threats to the peace, and for the suppression of acts of aggression or other breaches of the peace, and to bring about by peaceful means, and in conformity with the principles of justice and international law, adjustment or settlement of international disputes or situations which might lead to a breach of the peace;
- To develop friendly relations among nations based on respect for the principle of equal rights and self-determination of peoples, and to take other appropriate measures to strengthen universal peace;
- To achieve international co-operation in solving international problems of an economic, social, cultural, or humanitarian character, and in promoting and encouraging respect for human rights and for fundamental freedoms for all without distinction as to race, sex, language, or religion; and
- To be a centre for harmonizing the actions of nations in the attainment of these common ends.
All of this means that an institute such as the United Nations has the mandate to lead the world in the Anthropocene. However, to be responsible for global governance, The UN has to have well-defined, limited sovereignty and the ability to enforce decisions. This is a problematic issue that will be revisited in the future.
It helps that the UN members are voted in by representatives of the people that they govern and that the UN’s charter clearly states its mandate. Presently, the UN charter specifies non-interference in the internal affairs of member states. However, the definition of such internal affairs is not well defined and there is often a contradiction between global human rights and the internal preservation of human rights in member states.
The only UN institution with quasi-execution power is the Security Council. Below is a short description of its structure and functionality. Again, a full description can be found in the UN charter.
- The Security Council has primary responsibility for the maintenance of international peace and security. It has 15 Members, and each Member has one vote. Under the Charter of the United Nations, all Member States are obligated to comply with Council decisions.
- The Security Council takes the lead in determining the existence of a threat to the peace or act of aggression. It calls upon the parties to a dispute to settle it by peaceful means and recommends methods of adjustment or terms of settlement. In some cases, the Security Council can resort to imposing sanctions or even authorize the use of force to maintain or restore international peace and security.
The five permanent members have veto power on all UN decisions. Four out of those five permanent members with veto power constitute the main winners of WWII. This structure prevents effective UN action in cases such as Russia’s current invasion of Ukraine.
Extensive work needs to be done to make the UN an effective governing tool in the Anthropocene.

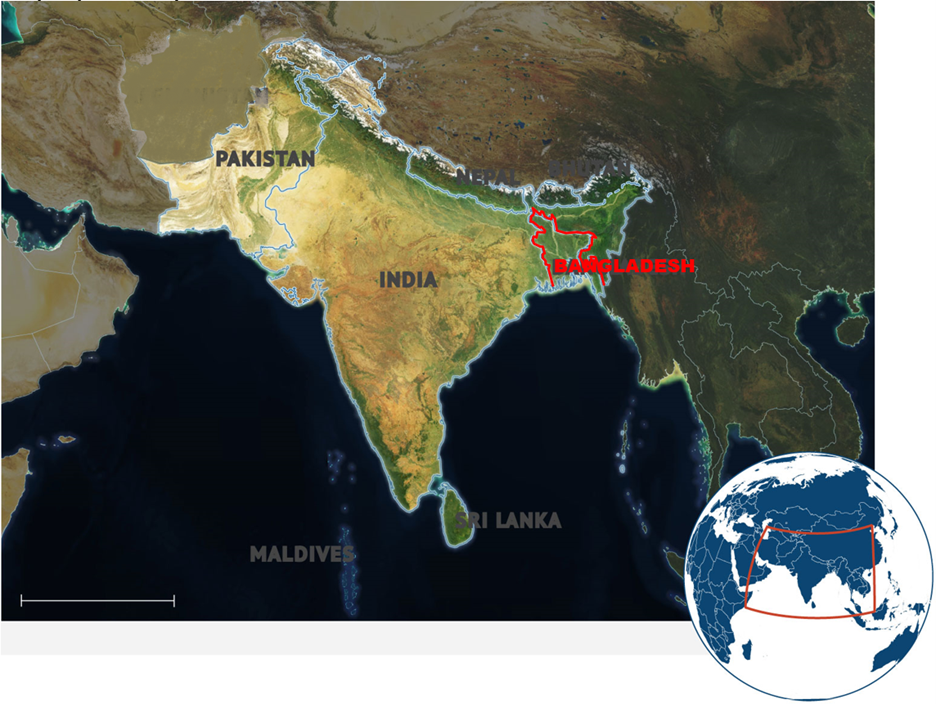 Figure 1 – map of the Indian subcontinent
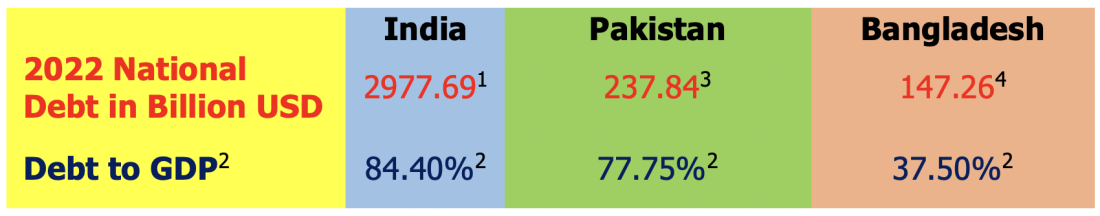 Table 1 – 2022 national debts and ratio to respective GDP
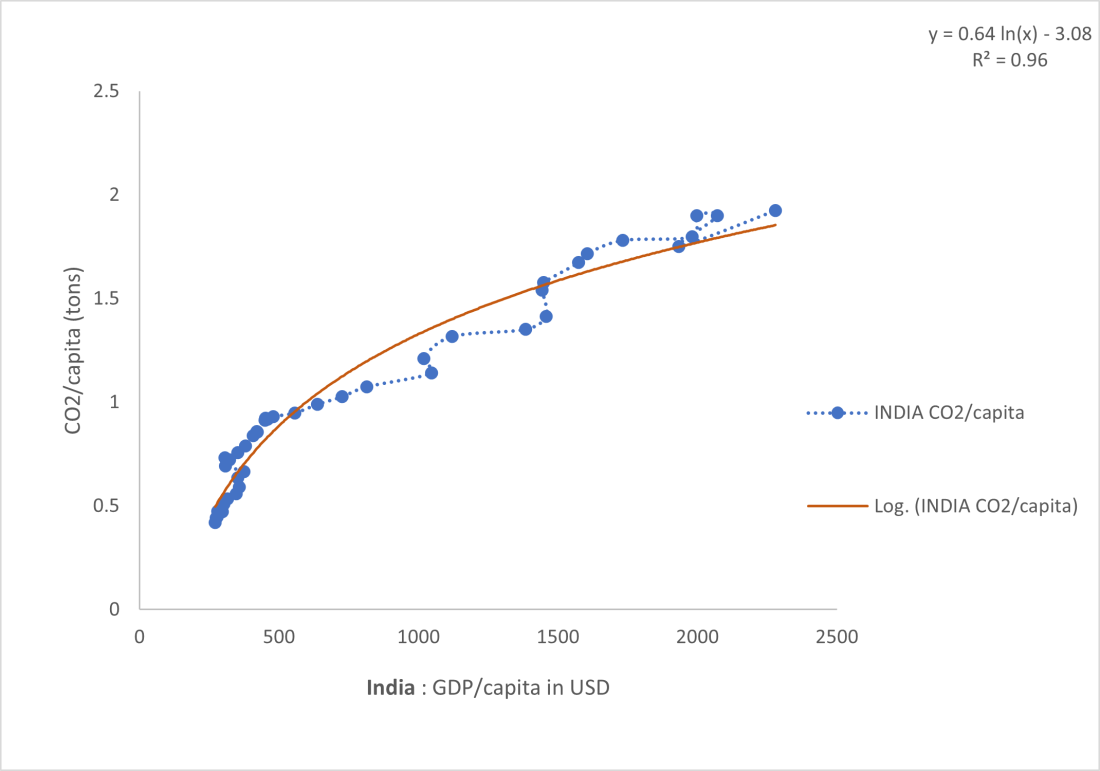 Figure 3 – Graph of Indian GDP in relation to per capita carbon dioxide emissions
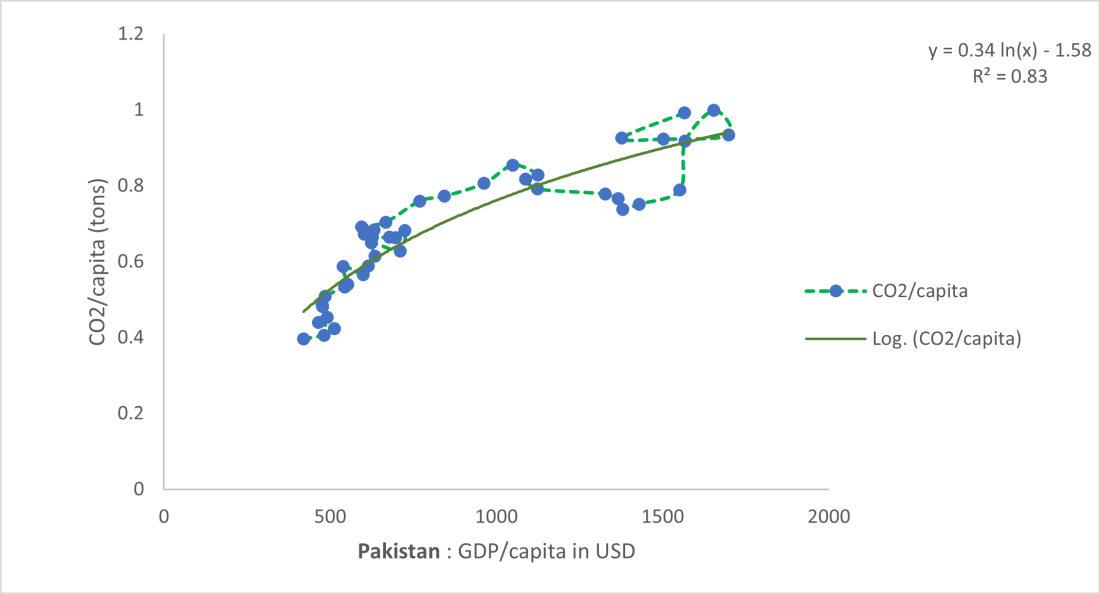 Figure 4 – Graph of Pakistani GDP in relation to per capita carbon dioxide emissions
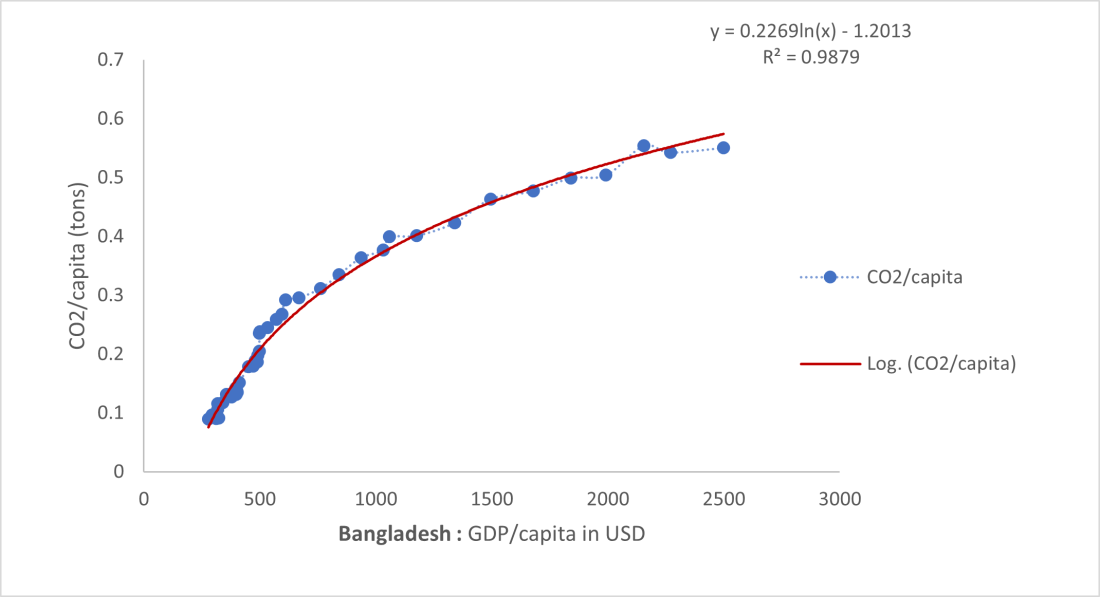 Figure 5 – Graph of Bangladesh’s GDP in relation to per capita carbon dioxide emissions
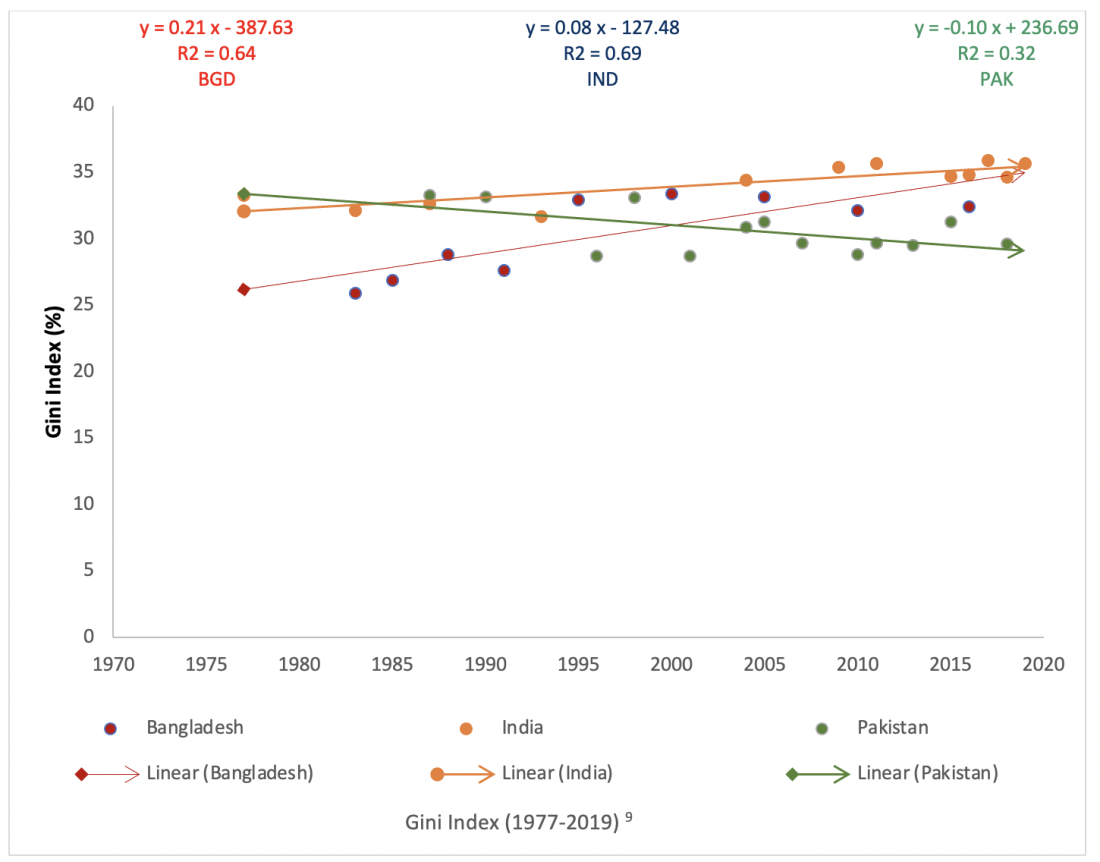 Figure 6 – Graph expressing the Gini indices and respective trends for India, Pakistan, and Bangladesh from 1977 – 2019
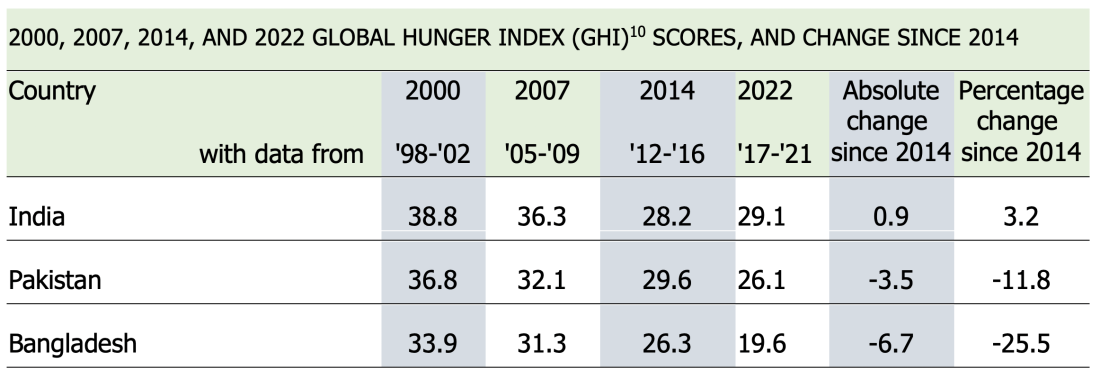 Table 2 – Global Hunger Indices for India, Pakistan, and Bangladesh and respective changes over the years
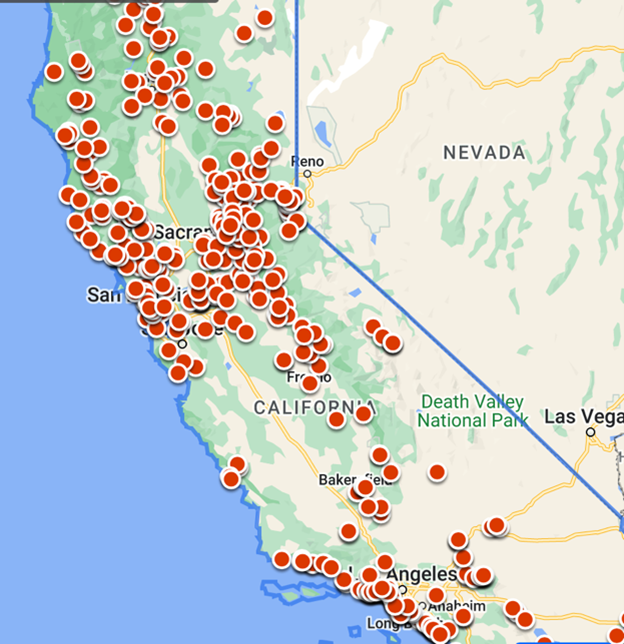 Figure 2: Properties for sale in California (Zillow)