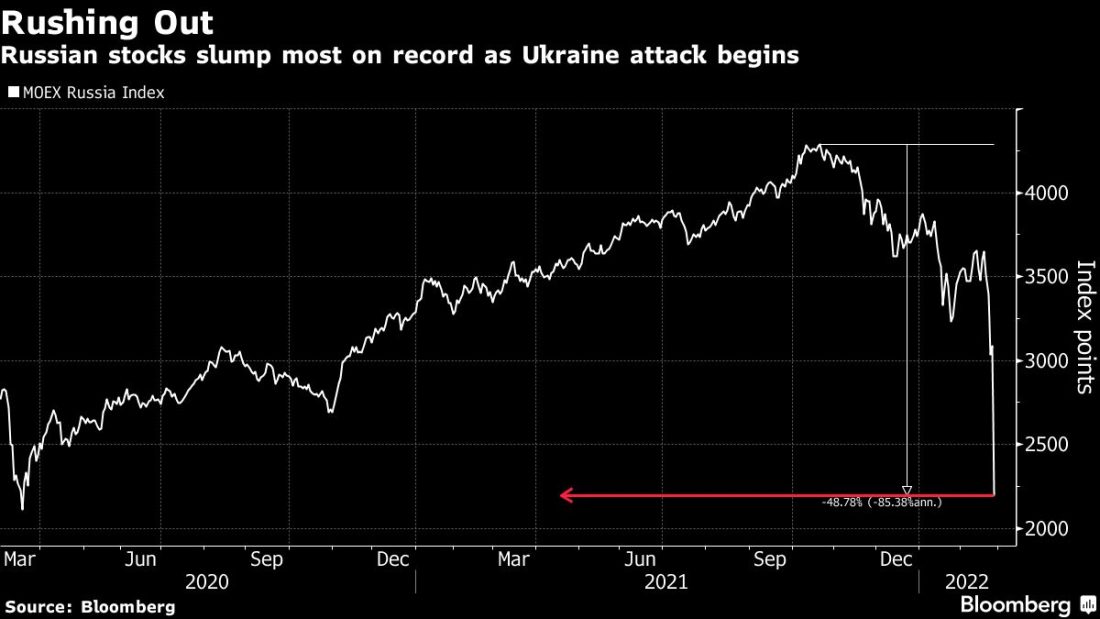
Two weeks ago (April 12th), I wrote about how busy we all are this April, both with personal and global events: “COVID-19 is still with us and continues to have an impact on most of us. The Russian invasion of Ukraine has also had major impacts, and its end cannot yet be seen. Additionally, the IPCC issued the third part of its 6th report (AR6). Its last report (AR5) was issued in 2013-2014.”
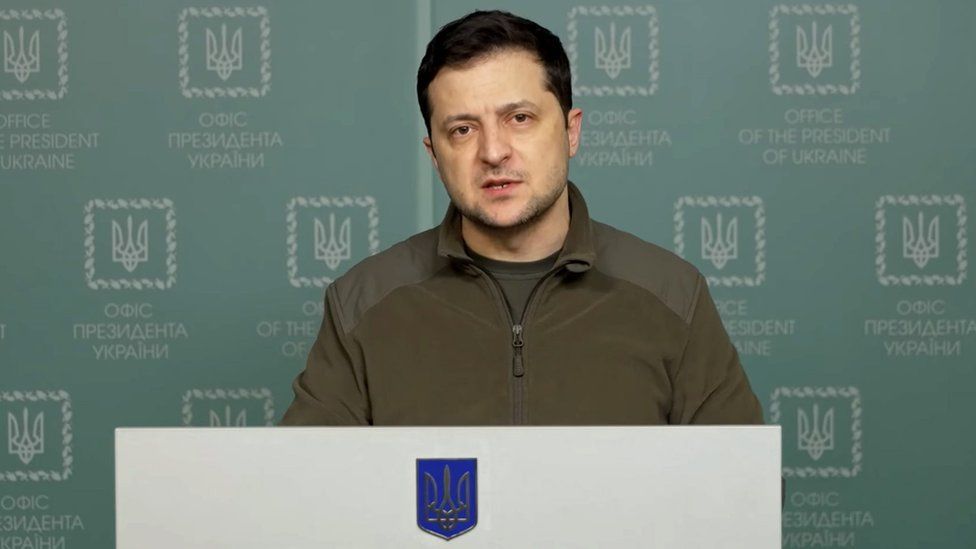
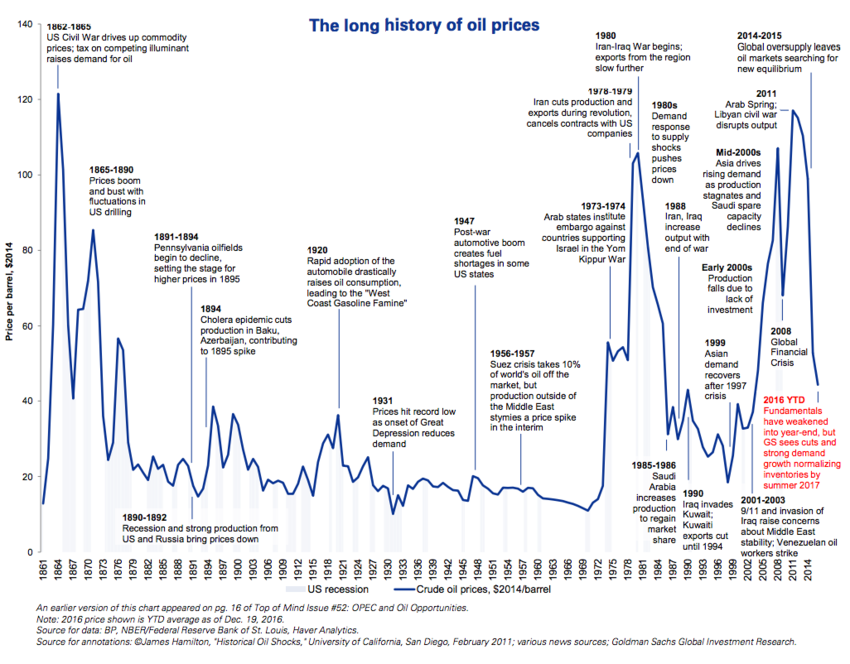
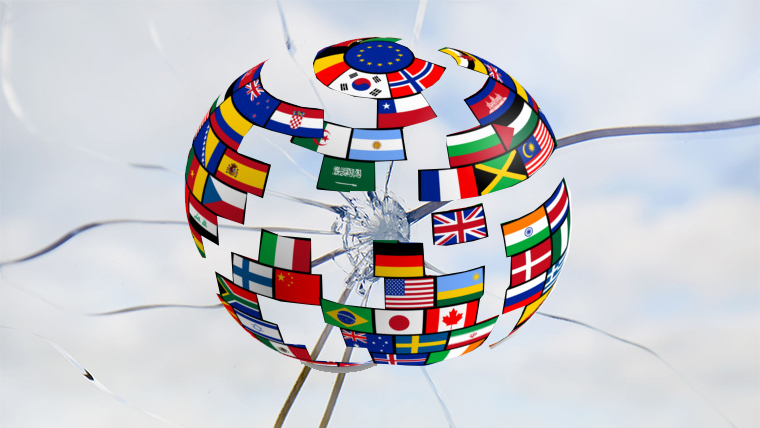
Last week (April 19th), in my blog, “Fighting Russian Aggression & Learning How to Fight Global Wars in the Nuclear Age,” I made an attempt to learn how to use the lesson from the hopefully short-term crisis of Russia’s invasion of Ukraine to fight the much longer-term crisis of climate change. This week, I had hoped to continue this line of thinking by expanding upon the advantages and disadvantages of globalization. In addition, the Public Broadcasting Service (PBS) has started a short series within its “Frontline” program, focused on oil companies and their role in attempts to mitigate climate change. The first episode in this series was titled “The Power of Big Oil (Part One: Denial).” This is a topic that I have covered extensively in the ten years that this blog has been up, and I was happy to try to figure out where the oil companies stand right now on this issue.
However, in a routine, Google scan of current, relevant, media activities, I encountered a piece in Vox that required my immediate attention:
The Supreme Court rules that cruel laws must still be enforced: The Court’s decision is a tremendous, if not unexpected, blow to poor Puerto Ricans.
By Ian Millhiser Apr 21, 2022, 3:00pm EDT
United States v. Vaello Madero, which the Supreme Court decided on Thursday, is a heartbreaking case. It asks whether many of the poorest and most vulnerable Americans can be cut off by their own government simply because they live in the wrong part of the United States.
But Vaello Madero is also a case about democracy, and whether democratic governments can enact policies that are needlessly cruel. In an 8-1 decision joined by every justice but Justice Sonia Sotomayor, the Court effectively answered that question in the affirmative.
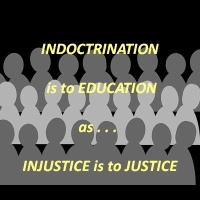
The content of the issue that this article addresses is specific and complex and should be of great concern to Puerto Rico and other US territories. However, it was not the subject matter that made me feel the need to immediately address the article; it was the title. I will try to explain.
Among my activities this month will be a talk to a Brooklyn high school about my Holocaust experiences. I have given many such talks over the last 15 years, especially during this time of the year. During such talks, I am often asked what I think about the arguments that many of the Germans who murdered Jews during this period were just obeying orders—and that the commanders who issued those orders were only following the state laws of the time. The laws in question were called the Nuremberg Race Laws, and have since been denounced. Ultimately, the Germans who gave the orders were prosecuted in the Nuremberg trials. Case closed? Not exactly. The issue of military obedience still occupies the attention of many. An example of the current thinking is given below:
To understand why this is the case, it is important to recognize that the law of obedience sits at the intersection of two fundamental interests – the need for good order and discipline in the military, which requires service members to obey superior orders; and the supremacy of the law, which requires service members to be responsible for their illegal acts. Because these interests can conflict – a superior can issue an unlawful order – the law must mediate between them.
To that end, it is clear that neither extreme can work. On the one hand, the Nuremberg Tribunals and a large body of military jurisprudence rejects the notion that members of the military should be insulated from liability for following orders. On the other hand, there is broad recognition that holding subordinates liable for all infractions, whether they were conducted pursuant to superior orders or not, would threaten good order and discipline by encouraging legal debate at every stage of the chain of command.
The issue gains special urgency within the context of the Russian invasion of Ukraine and the remnants that the Russian army is leaving in places that are under their control, such as Bucha and Mariupol.
Figure 1 shows an example of a mass grave that was left in Bucha. In my Holocaust talks, depending on the age of the audience, I show the mass graves that the British army found after they liberated Bergen-Belson, the camp where I spent two years of my childhood. The only difference that I can see is that the corpses in Bergen-Belsen were not buried with plastic bags.
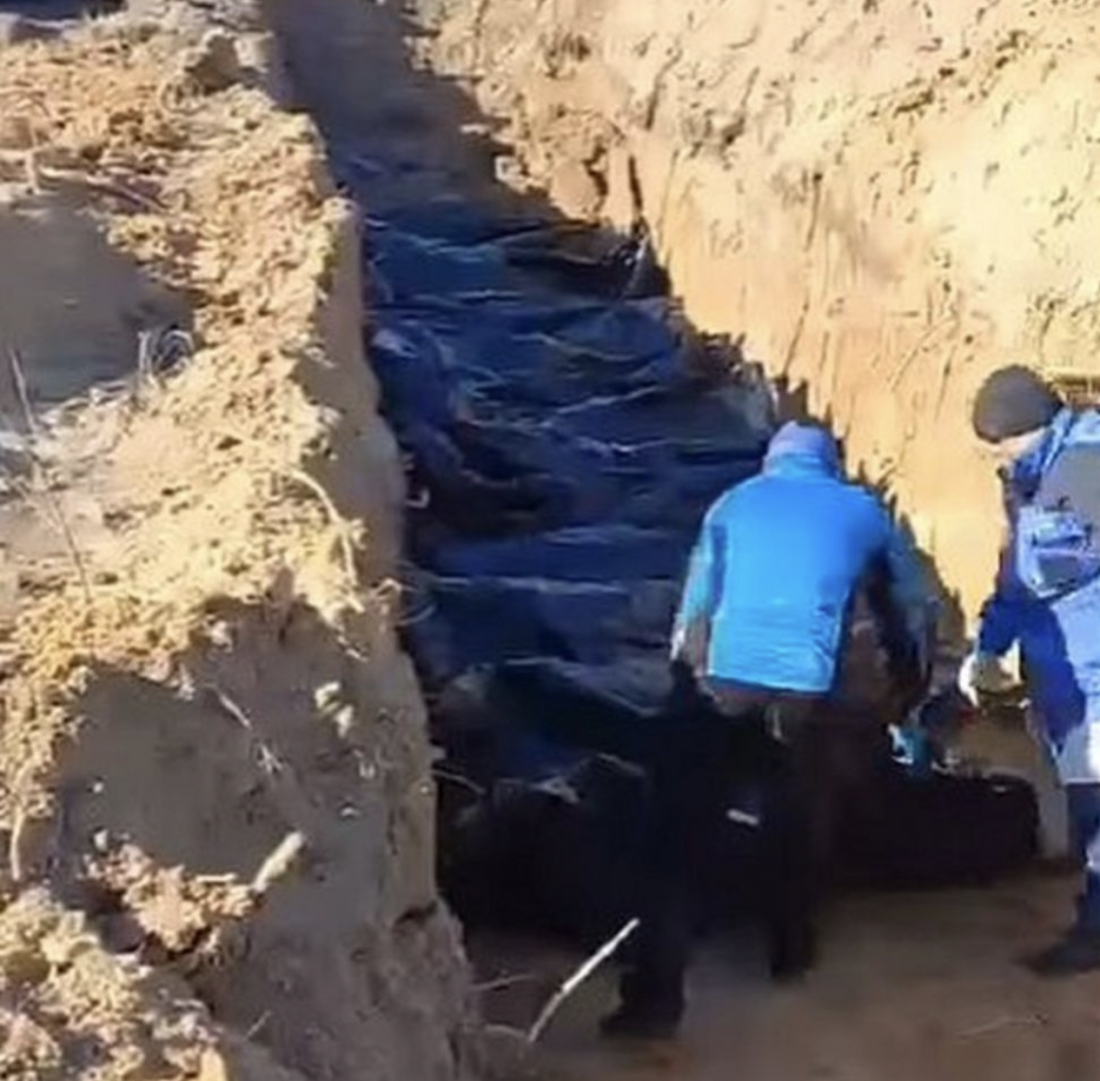
Figure 1 – Mass grave in Bucha (Source: Andriy Levkivsky via BBC)
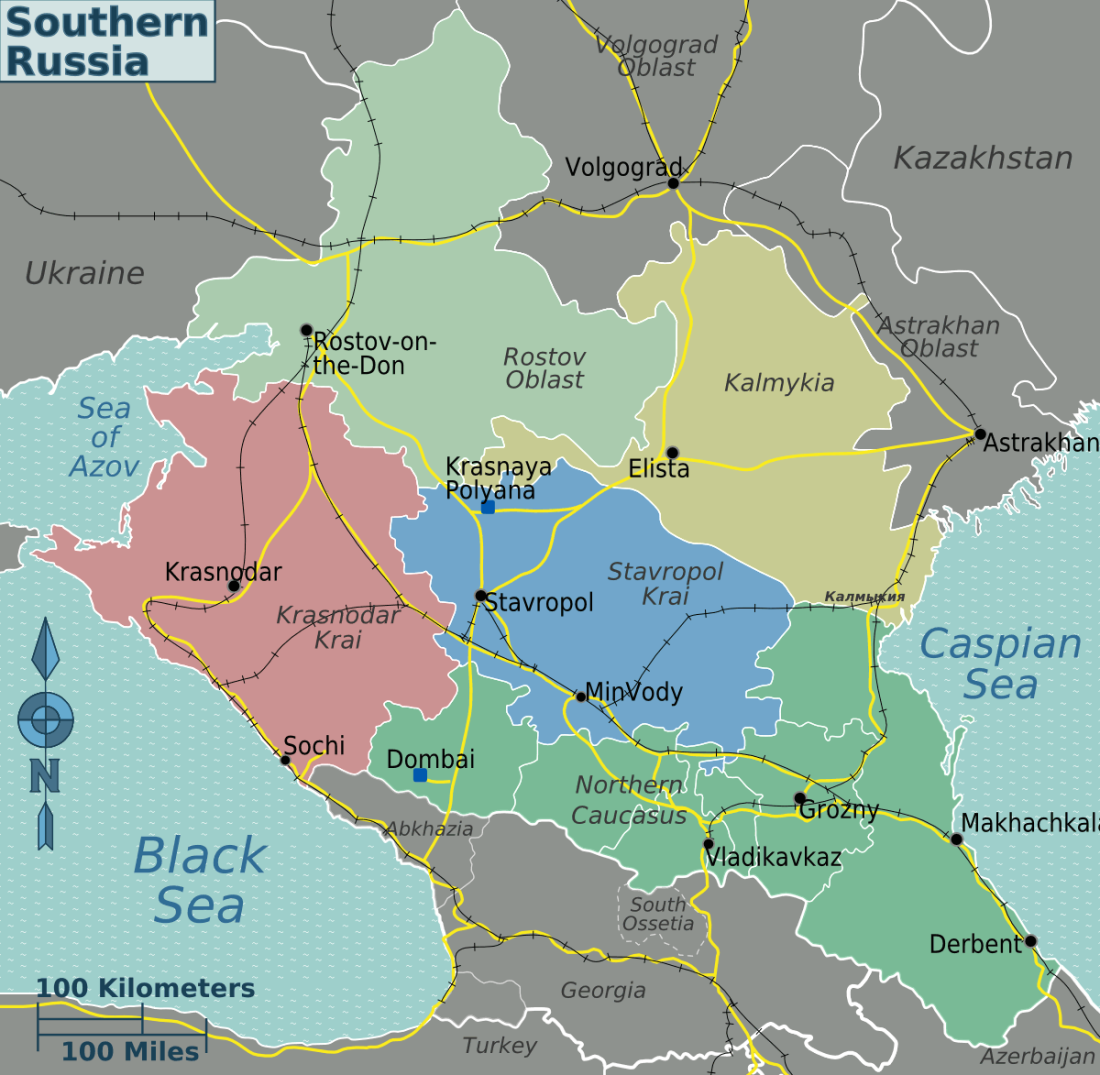
By some accounts, Russia is now planning to expand its invasion even beyond Ukraine.
I hope that in coming blogs I will be able to return to more relevant abstract topics.

 Monument for our April 13, 1945 liberation in Farsleben, Germany
 Source: