 President Biden signed 15 executive orders and two agency directives on the day of his inauguration (January 20th). Most of this activity was targeted at trying to reverse President Trump’s previous directives. One of the new executive orders that attracted global attention was a promise to reenter the US into the 2015 Paris Climate Agreement that the Trump administration left in 2019. The US has now officially rejoined. The Paris Agreement is best-known for securing commitments from all participating countries to significantly reduce emissions. The goal is to collectively limit the global temperature rise to less than 2oC (3.6oF) above the pre-industrial level by mid-century. One of my students plans to quantify the actual meaning of these commitments, along with the withdrawal and the reentry. I’ll keep you updated.
A recent UN report reminded us that so far, the world has fallen short of the Paris commitments. The US’ rejoining of the accord is at least a step in the right direction.
One of the impacts of the US withdrawal from the agreement was the associated withdrawal from the Green Climate Fund. While this didn’t get much attention at the time, it had a big impact. Rich countries committed themselves to using this fund to support developing countries in mitigating their current impacts of climate change. Meanwhile, the poorer countries would use the resources to redirect their future energy production away from fossil fuels. The Green Climate Fund’s webpage explains it in this way:
There is a shrinking window of opportunity to address the climate crisis. Average global temperature is currently estimated to be 1.1°C above pre-industrial times. Based on existing trends, the world could cross the 1.5°C threshold within the next two decades and 2°C threshold early during the second half of the century. Limiting global warming to 1.5°C is still narrowly possible and will be determined by the investment decisions we make over the next decade. The Green Climate Fund (GCF) – a critical element of the historic Paris Agreement – is the world’s largest climate fund, mandated to support developing countries raise and realize their Nationally Determined Contributions (NDC) ambitions towards low-emissions, climate-resilient pathways.
Climate change offers businesses an unprecedented chance to capitalise on new growth and investment opportunities that can protect the planet as well. GCF employs part of its funds to help mobilise financial flows from the private sector to compelling and profitable climate-smart investment opportunities.
In 2009, one outlet reported the fallout of the US’ abandonment of these promises:
Green Climate Fund replenishment fails to fill hole left by Trump’s US
Rich countries failed to increase the amount of money pledged to the Green Climate Fund on Friday, after struggling to mitigate Donald Trump’s refusal to provide green finance.
The Green Climate Fund (GCF), which was created to help poor countries curb their emissions and cope with the impacts of climate change was seeking fresh contributions to replenish its funding, due to run-out at the end of the year.
A total of 27 countries raised $9.8 billion at a pledging conference in Paris to fund green projects for the 2020-2023 period – including 4% in zero-interest loans. That was less than the $10.3bn donors promised for the first period to 2020 and not enough to fund the $15bn pipeline of projects identified by the GCF as of December 2018.
In 2014, under Barack Obama’s administration, the US pledged $3bn to the fund – the biggest pledge to the fund. Donald Trump reneged on the US commitment to the tune of $2bn.
Both the US and Australia said they would not pledge new money to the GCF, leaving smaller European countries along with Japan, Canada and New Zealand to compensate for a $3.2bn hole. They fell around half a billion short.
To bridge the gap, 13 countries announced a doubling or more of their contributions: Germany, Norway, France, UK, Sweden, South Korea, Denmark, Iceland, Poland, New Zealand, Luxembourg, Ireland and Monaco.
Before the conference, the GCF said contributions totalling between $9bn and $10bn would be “a big success” after 16 countries pledged $7.4bn in the lead up.
Earlier this month, the World Research Institution published a list of, “4 Climate Finance Priorities for the Biden Administration.” Primary among these was re-commitment to the Green Climate Fund:
Trump stopped U.S. contributions to the Green Climate Fund (GCF), which has a mandate to help countries build low-carbon, resilient economies and take ambitious action under the Paris Agreement. Biden has said he would “recommit the United States to the Green Climate Fund,” and it should be number one on his list of international climate finance priorities.
The Fund gives developing countries an equal voice in decision-making, and it has some of the strongest policies of any financial institution promoting gender responsiveness and Indigenous peoples’ rights. It delivers funding through a diverse range of more than 100 organizations, from major U.S. investors to local businesses and nonprofits in developing countries. While the GCF has faced problems with slow decision making in the past, a new voting procedure instituted in 2019 has led to far more efficient delivery. Last year the Fund approved a record $2 billion for 37 projects, more than any other international climate fund.
Obama pledged $3 billion to the GCF in 2014 but only delivered $1 billion before leaving office, meaning the United States still owes $2 billion from that original pledge. In 2019, most other developed countries made a new round of pledges, with many doubling their original commitments.
Resumed U.S. contributions to the GCF would deliver the most diplomatic bang for the buck. The GCF was a key part of the grand bargain that underpinned the Paris Agreement: that poorer countries would undertake more climate action but needed increased support from richer countries to do so. Developing countries, as well as the U.S. climate movement, have made clear that ambitious backing for the GCF is a key test of Biden’s recommitment to global climate leadership.
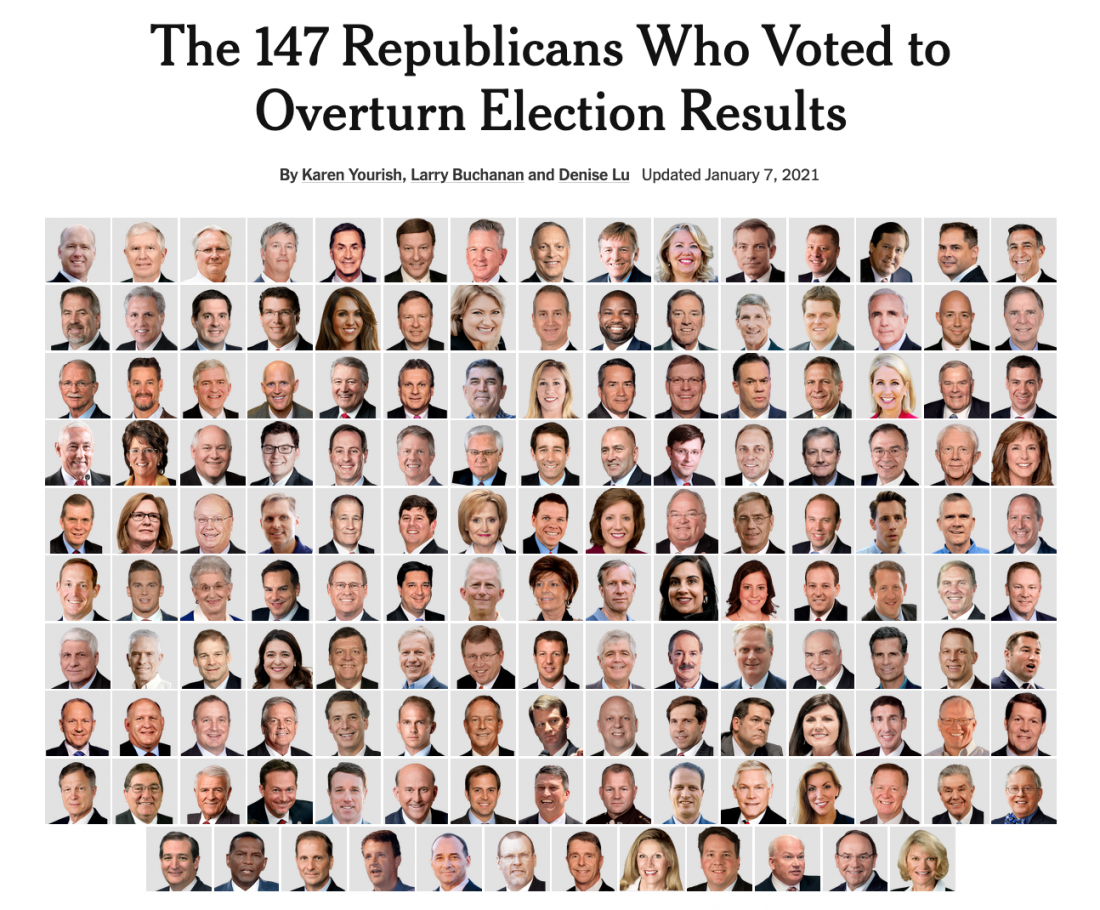
The GCF now has significant support in Congress: for the first time last year, the House of Representatives requested funding for the GCF. With Democrats also gaining control of the Senate, and members of the pivotal Appropriations Committee backing the Fund, the potential for GCF appropriations has never looked better. To get back up to speed, Biden should deliver the outstanding $2 billion from the country’s existing pledge and make a new, more ambitious commitment of $6 billion to match peers who have already doubled their pledges.
Figure 1 illustrates the main argument behind the initial creation of the fund. We see that the richest 10% of the global population is responsible for 50% of all carbon emissions. Conversely, the poorest 50% are responsible for a mere 10% of the emissions.
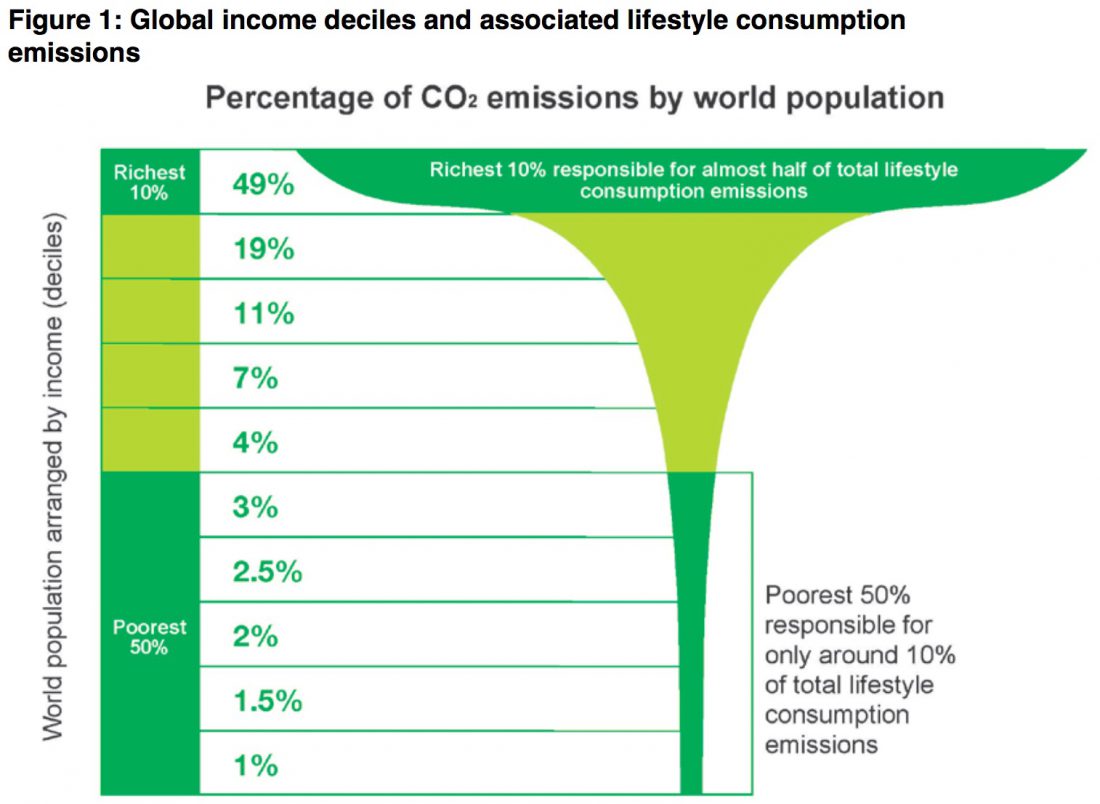
Figure 2 shows that, over the last 30 years, Federal Disaster Relief appropriations in the US exceeded $100 billion. The sharp, consistently increasing trend of these disasters indicates that most of the damage was triggered by climate change. What happens if you don’t have the money to mitigate these disasters?
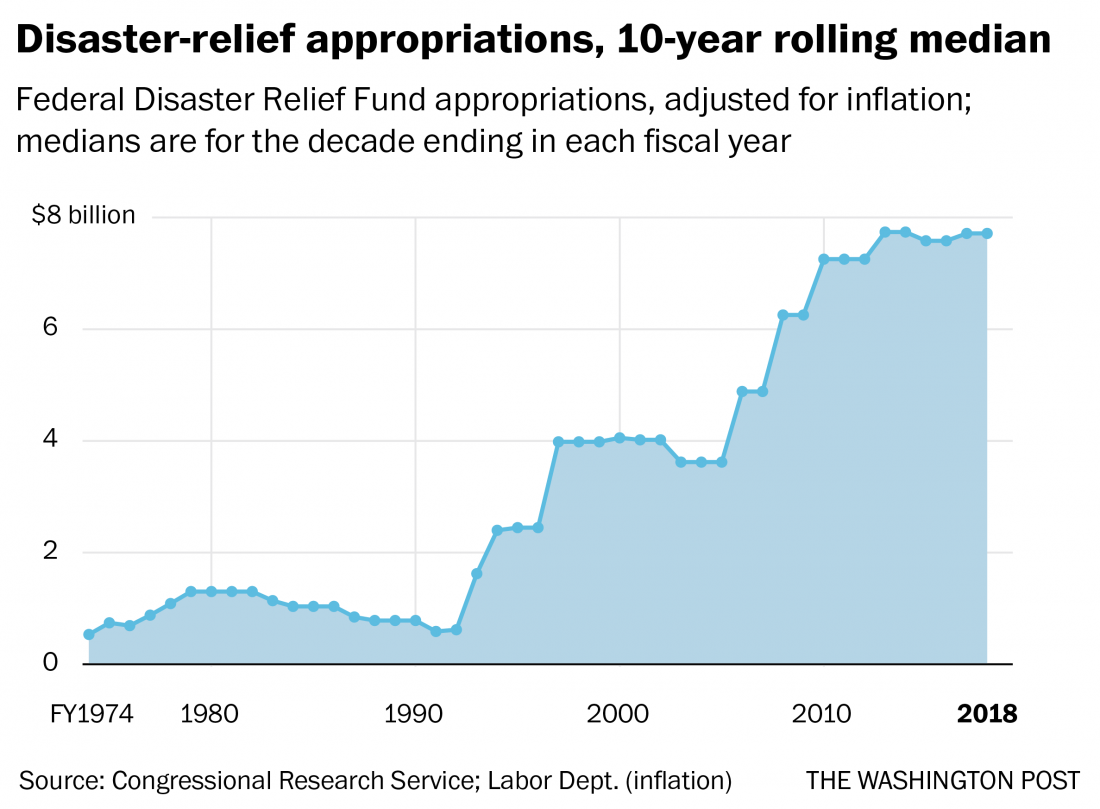
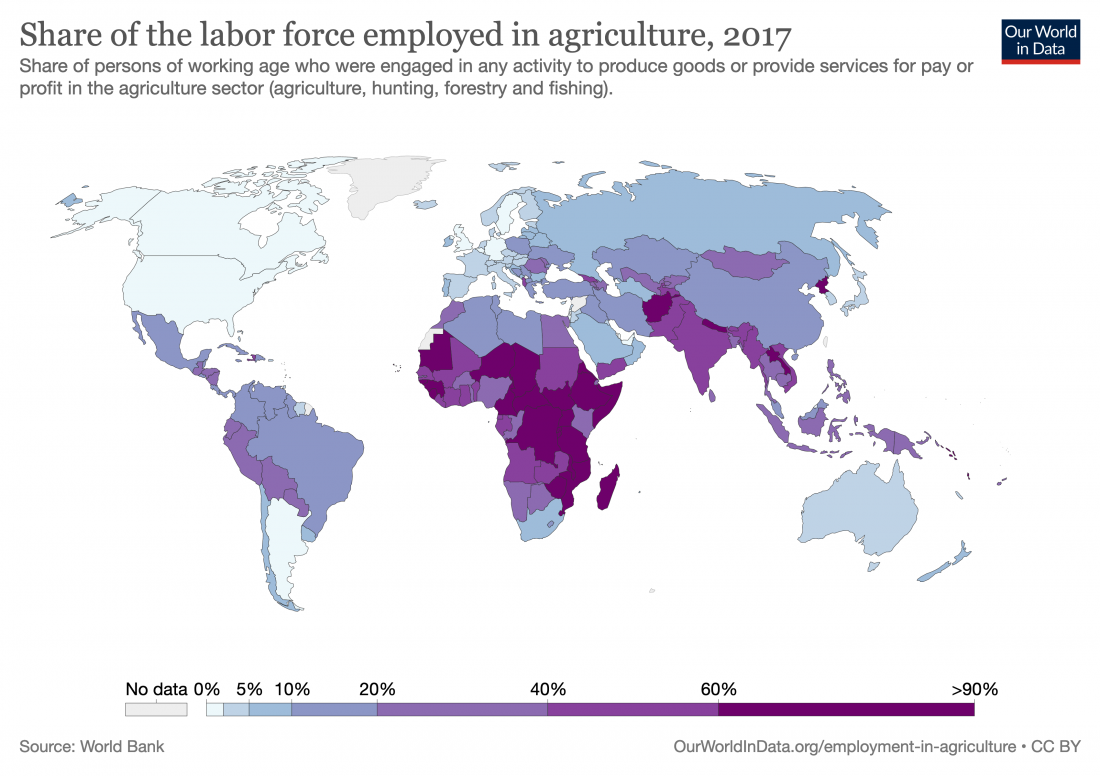
Figure 3 indicates that in most poor countries in the world, the majority of the population is employed in agriculture, mostly in their own small fields. Climate change disrupts the global distribution of precipitation, increasing the frequency and the severity of draughts and/or floods and making many of these fields unproductive. Some of this has happened already; much worse is still to come.
A recent paper focusing on the Mexico-US border, was able to quantify the relationship between climate change’s effects on agriculture and the need to emigrate to seek a better future:
Linkages among climate change, crop yields and Mexico–US cross-border migration
Climate change is expected to cause mass human migration, including immigration across international borders. This study quantitatively examines the linkages among variations in climate, agricultural yields, and people’s migration responses by using an instrumental variables approach. Our method allows us to identify the relationship between crop yields and migration without explicitly controlling for all other confounding factors. Using state-level data from Mexico, we find a significant effect of climate-driven changes in crop yields on the rate of emigration to the United States. The estimated semielasticity of emigration with respect to crop yields is approximately −0.2, i.e., a 10% reduction in crop yields would lead an additional 2% of the population to emigrate. We then use the estimated semielasticity to explore the potential magnitude of future emigration. Depending on the warming scenarios used and adaptation levels assumed, with other factors held constant, by approximately the year 2080, climate change is estimated to induce 1.4 to 6.7 million adult Mexicans (or 2% to 10% of the current population aged 15–65 y) to emigrate as a result of declines in agricultural productivity alone. Although the results cannot be mechanically extrapolated to other areas and time periods, our findings are significant from a global perspective given that many regions, especially developing countries, are expected to experience significant declines in agricultural yields as a result of projected warming.
Mitigation of global climate change will be impossible without a fund to help poor countries manage the disasters that they are already facing in addition to those looming on the horizon. Rejoining the Paris Agreement is a good first step but it cannot be the last.


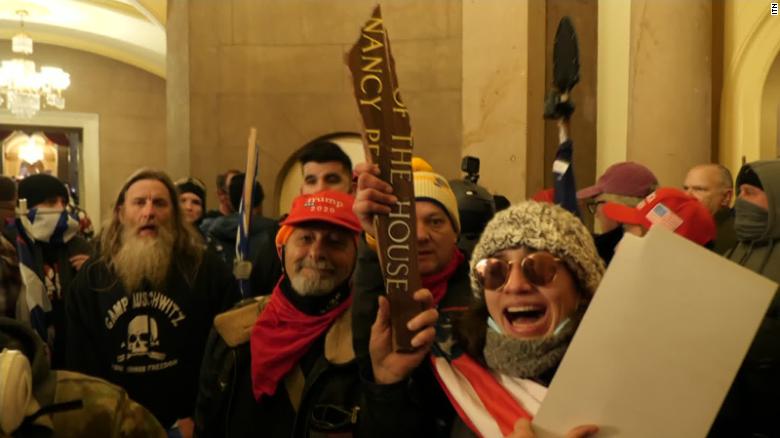
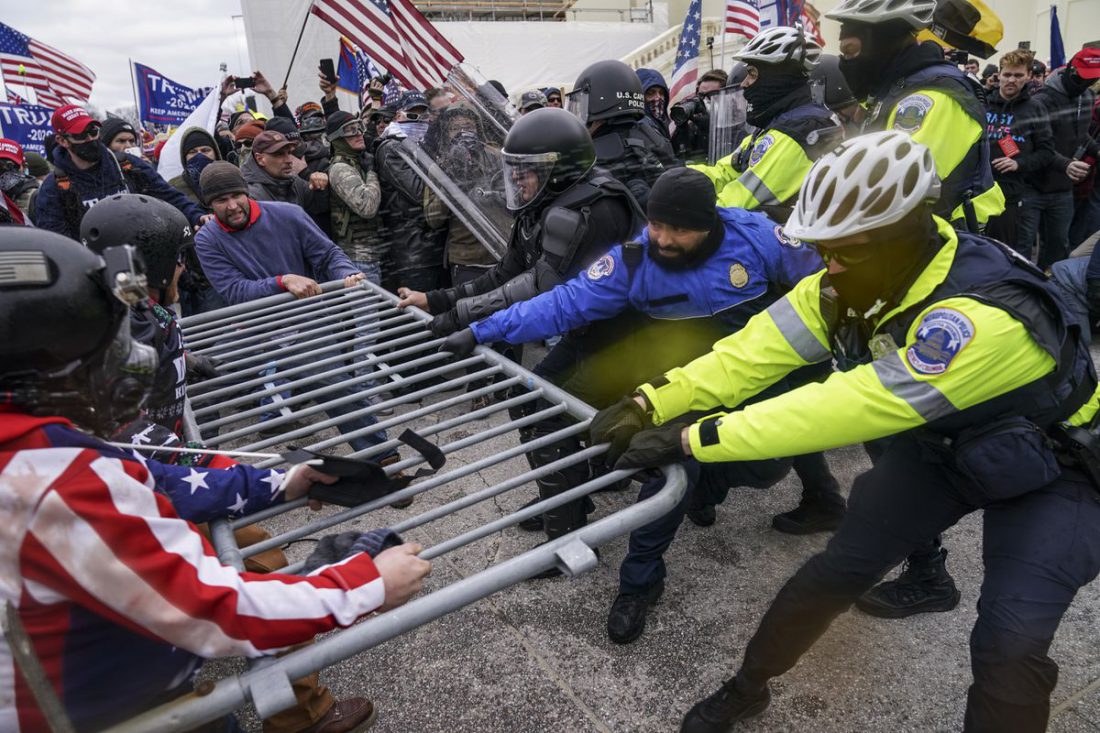
 I started writing this one day after President Biden and Vice President Harris were inaugurated. Many of us were thoroughly relieved that the event turned out to be a dignified, uneventful transition of power. I wouldn’t quite call it peaceful, given that the capital was full of police and troops prepared to quell a repetition of the January 6th mob attack, but there were no outright acts of violence.

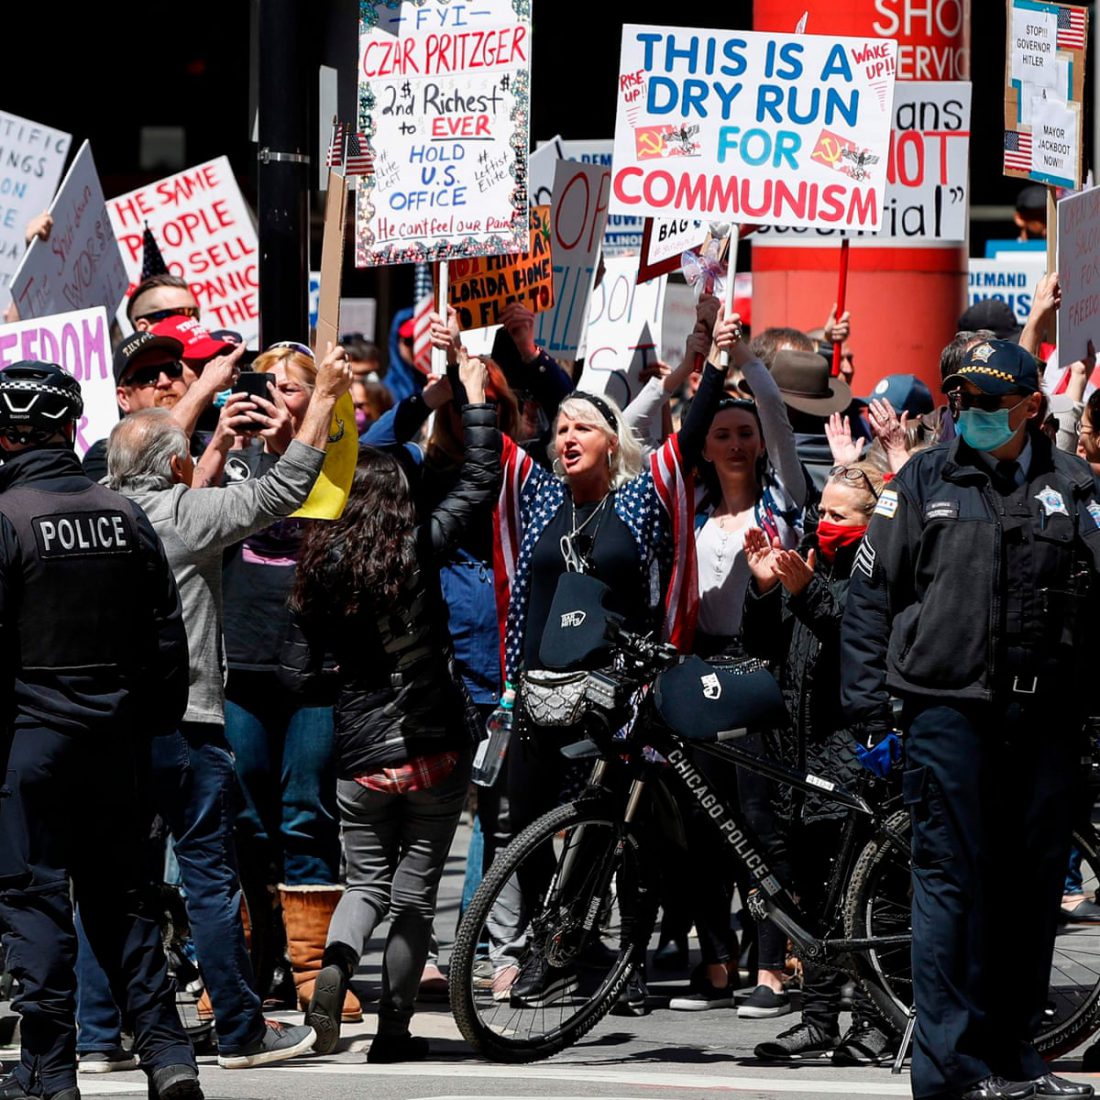
 Demonstrators in North Carolina in April 2020