If you’ve been following my latest series detailing the indicators for the global energy transition (starting October 15th), you’ll agree that it’s time to ask the most important question: how are we doing? We can estimate the answer by examining how well our society has embraced renewable, non-carbon-based energy. One of the main challenges that I want to address today is whether, based on current trends, we can actually achieve zero carbon energy input by 2050. As I have mentioned repeatedly, this is the most optimistic and ambitious goal among scientists.
Renewable Energy
I was trying to continue my methodology from the last three blogs, using the same 15 countries that I selected to represent low-, medium-, and high-income countries around the world. But looking at the data from the World Bank database depressed me, which I hate because depression can leave us paralyzed and unwilling to go forward in a productive way.
One thing that got me down was that the World Bank includes nuclear energy in the renewable category since it is a non-carbon-based energy source. But nuclear energy has had a mixed past and different countries have had varied reactions. Japan’s 2011 Fukushima disaster motivated some countries, headed by Germany, to remove nuclear plants from their energy mix. France, meanwhile, decided quite a while ago to use nuclear power to drive most of its electricity output but the system is now running into some serious difficulties. The other reason for my pessimism has to do with progress in renewable energy contributions to the global energy transition. Excluding nuclear energy, most of the 15 countries we are studying contribute very little in terms of renewable energy. This made me especially depressed.
So I shifted gears and looked instead at the BP site. I found the two graphs below and the following list of renewable energy sources:
Hydroelectricity, wind and wave power, solar and geothermal energy and combustible renewables and renewable waste (landfill gas, waste incineration, solid biomass and liquid biofuels).
First, we need to clarify some issues. The two graphs below use different sets of energy units: Figure 1 is given in million tons of oil equivalent, a metric that is principally used to describe energy as it relates to heat (creating heat, using it as a primary energy source for electricity production, and other applications). Figure 2 is given in terawatt-hours, a standard measurement of electricity consumption. One terawatt is equal to a trillion watts (10 billion 100 watt light bulbs). The two units relate to each other as follows:
1 million tons of oil equivalent = 4.4 terawatt-hours.
You can verify this relation by multiplying the scale in Figure 1 by 4.4; your answers will be approximately the same as that in Figure 2.

![]()
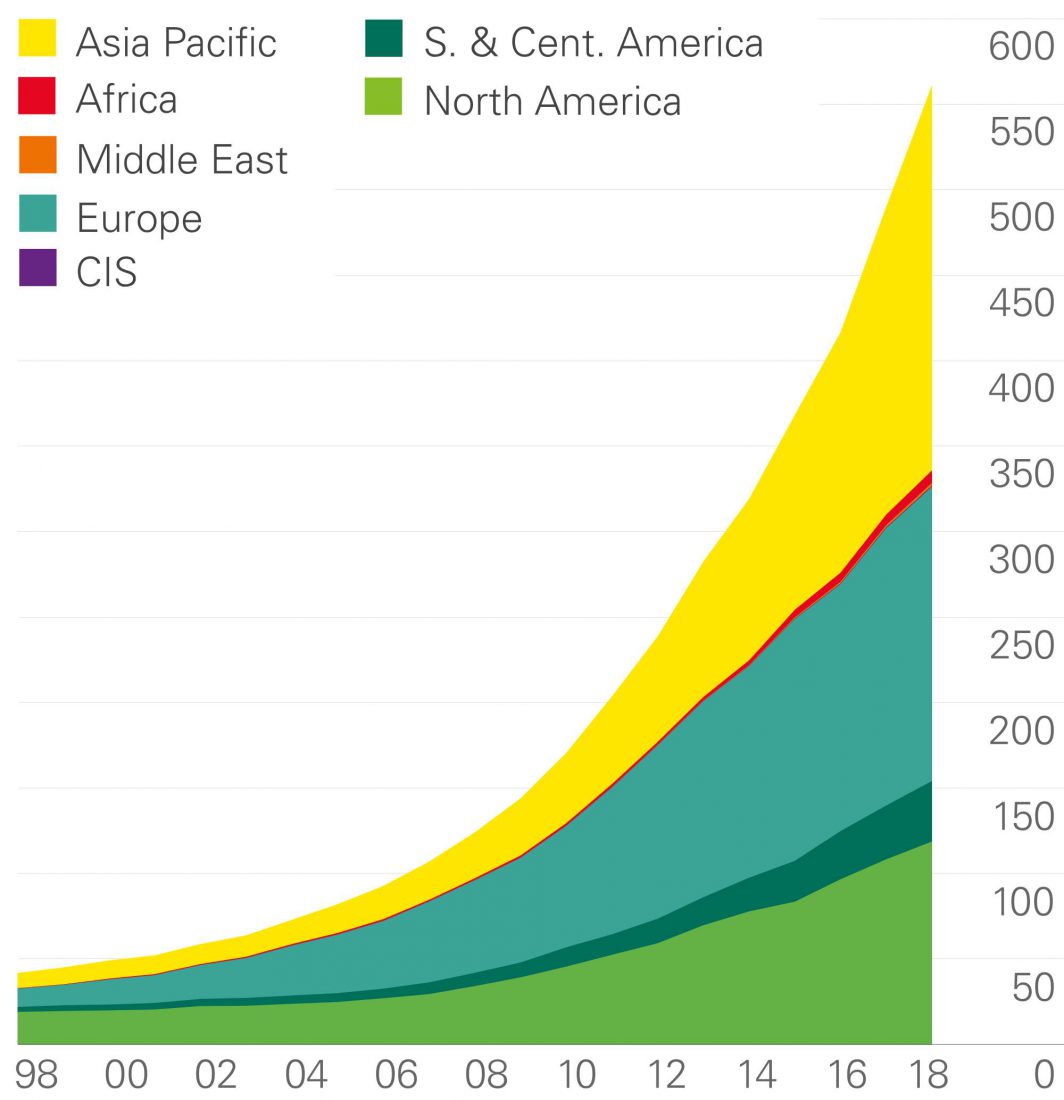 Figure 1 – Renewable energy consumption by region from 1998-2018 (in million tons of oil equivalent)
 Figure 2 – Renewable energy consumption by source from 1998-2018 (in terawatt-hours)
The rapid growth of renewable power generation continued in 2018, with an increase of 14%. In volume terms, the largest increase was in China, accounting by almost 50% of the total increase at a global level.
Renewable power consumption grew by 14% in 2018, providing 9% of the world’s electricity.
The rapid growth of non-hydro renewable power generation continued in 2018. Global growth was 14%, the 15th successive year of double-digit growth. Renewables accounted for around a third of the growth in global power generation and contributed for one fifth of world primary energy growth.
The OECD remains the main source of renewable power generation (59% of world total) in 2018. Nevertheless, non-OECD growth is larger and accounts for almost 2/3 of the total increase in renewable energy.
The share of renewable power in global power generation reached nearly 8.4% in 2017, almost doubling in five years from 4.6% in 2012. Renewables accounted for 12% of OECD power generation in 2017, compared to 6% in the non-OECD. While the aggregate shares remain low, for some individual countries renewables now contribute a significant share of power. Countries where renewables contribute more than 20% of the power generated include: Germany, Spain, UK, Italy, Portugal, Denmark, Finland, Ireland and New Zealand.
So why am I using two different scales? The reason is that if we produce our electricity with thermal sources, such as burning fossil fuel or using nuclear energy, we cannot do so with 100% efficiency (see the October 22nd blog). I usually count the “typical” efficiency at 33%. The BP site uses 38% for a modern power plant. The maximum efficiency of such conversions directly relates to the temperature of the heat that is produced by the primary energy source.
Almost none of the alternative energies that are shown in Figures 1 and 2 go through a heat stage. The exceptions are combustible renewables and renewable waste, which I will discuss in the future; they are especially important for low-income countries. In Figures 1 and 2, these energy sources are minor components as compared to solar and wind, which are powered either directly (solar) or indirectly (wind). Most of the “other” in Figure 2 is hydroelectric (waterfalls), powered by gravity.
We should pay special attention to the first paragraph in the cited BP section above. It states that the rapid growth in the use of renewables in 2018 is continuing and now amounts to 14%. The largest increase is attributed to China, which now accounts for about 50% of the global growth in the use of renewals. To put this into context, we should remember from last week that China also accounts for 50% of global coal use.
Zero Carbon
Let me now try to evaluate the feasibility of the world reaching zero carbon by 2050. If we continue, globally, to increase our use of renewables at the same rate as we did in 2018 (14%) the doubling time for the availability of renewables will be 5 years. To find this number, we use something called the Rule of 70 for calculating exponential growth.
The Rule of 70 gives quick estimates of the doubling time of an exponentially growing quantity. If R% is the annual growth rate of the quantity, then the Rule of 70 says that:
Doubling time in years =(aprox) 70/R
For example, at a 10% annual growth rate, doubling time is 70/10 = 7 years.
In our case, R=14% so 70/14 = 5 years
From Figure 1, we see that in 2018 we had used approximately 550 million tons of oil equivalent of renewable energy globally to power our electrical grid. If we were to replace the new renewable energy sources with thermal energy derived from burning fossil fuels, we would have to use three times more or 1,650 million more tons of oil equivalent (or gas or coal). The total primary energy that we used globally in 2018 was 13,865 tons of oil equivalent. The ratio between the thermal replacement rate of fossil fuels by renewable energy and the total primary energy comes out to 0.1 or 10%.
From the October 22nd blog we see that primary energy use in the high-income countries is actually decreasing. In the medium-income countries it is approximately flat (again, except for China). Globally over this period of time, the use of primary energy has remained approximately constant. With this information we can construct a small table that will show us when, assuming the same replacement rate of fossil fuels by renewables, we can get to a zero carbon world.
|
Ratio of renewable to primary energy, globally (%) |
Time (years from now) |
|
10 |
Now (2018) |
|
20 |
5 |
|
40 |
10 |
|
80 |
15 |
|
100 |
20 (2040) |
In other words, the answer to the big question above is yes, if we continue at the same replacement rate, we can easily meet the goal of zero carbon by 2050.
Meanwhile, in the news:
The good news: As I finished writing this blog, new information came out about our use of wind energy: current US wind capacity is now 500 GW.
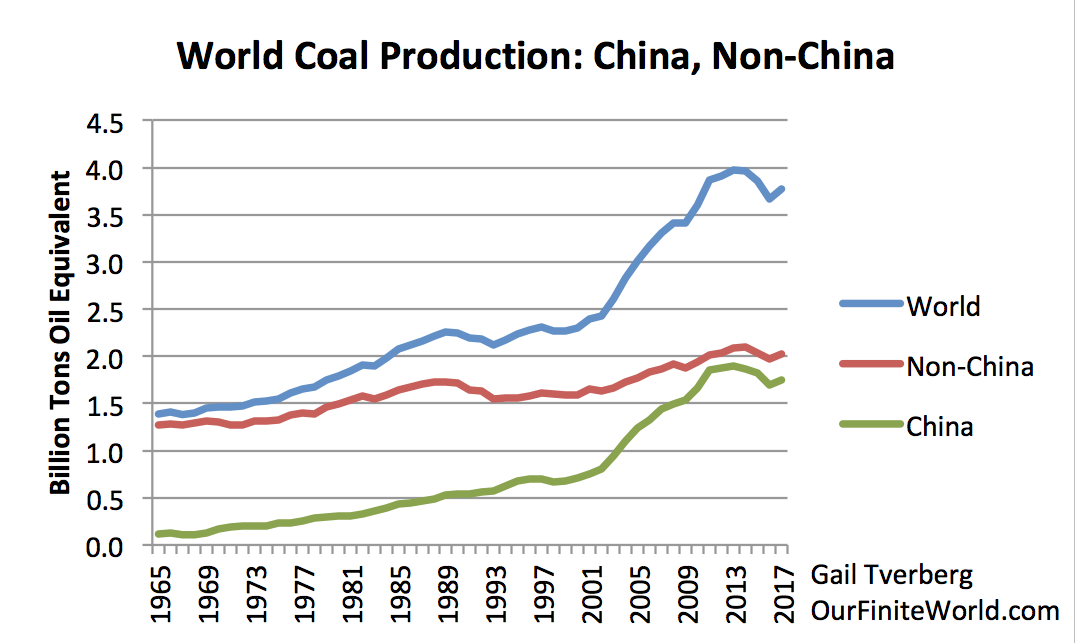
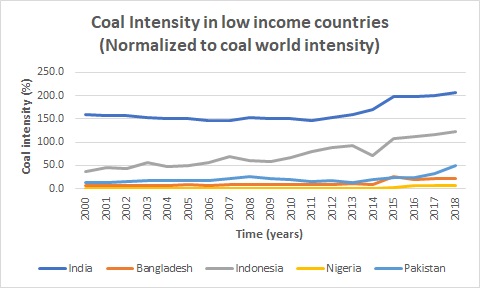
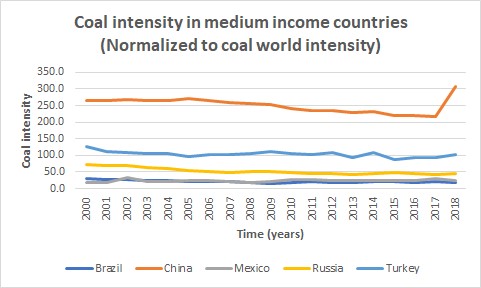
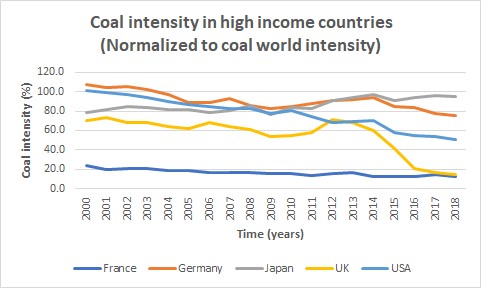
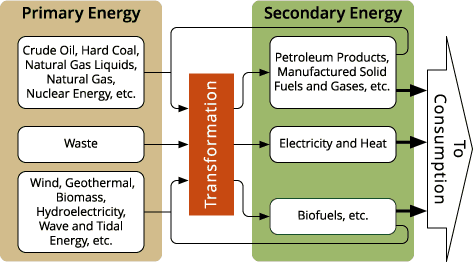
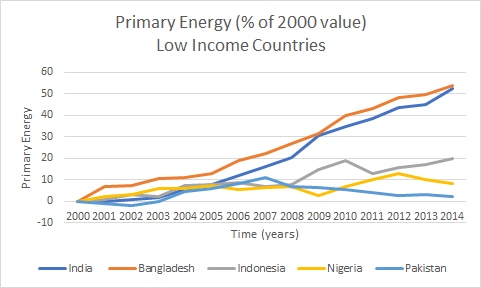 Figure 2 – Use of primary energy in low-income countries, as % of year 2000 value
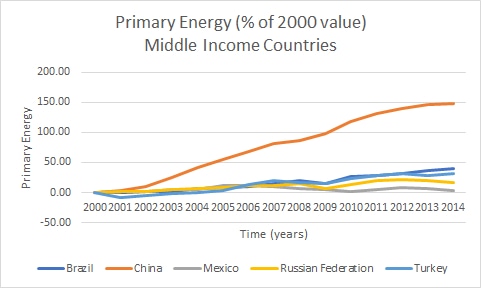 Figure 3 – Use of primary energy in middle-income countries, as % of year 2000 value
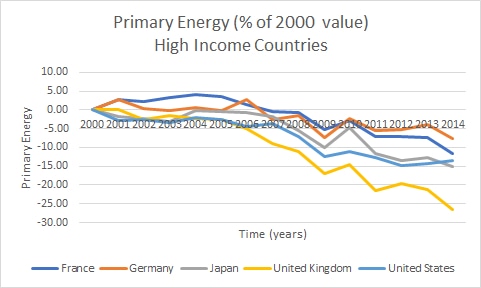 Figure 4 – Use of primary energy in high-income countries, as % of year 2000 value
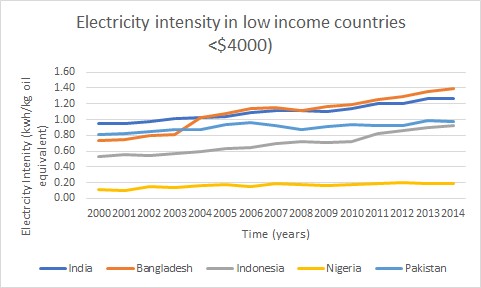 Figure 1 – Low-income countries
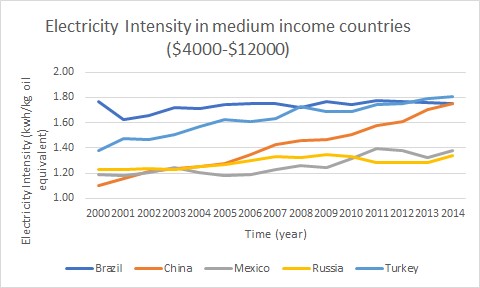 Figure 2 – Medium-income countries
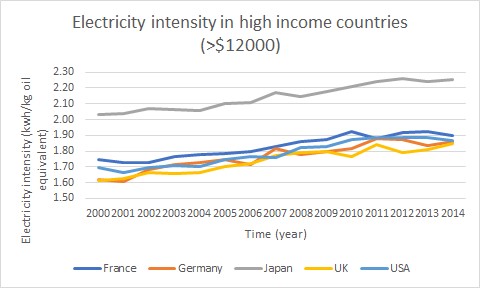 Figure 3 – High-income countries
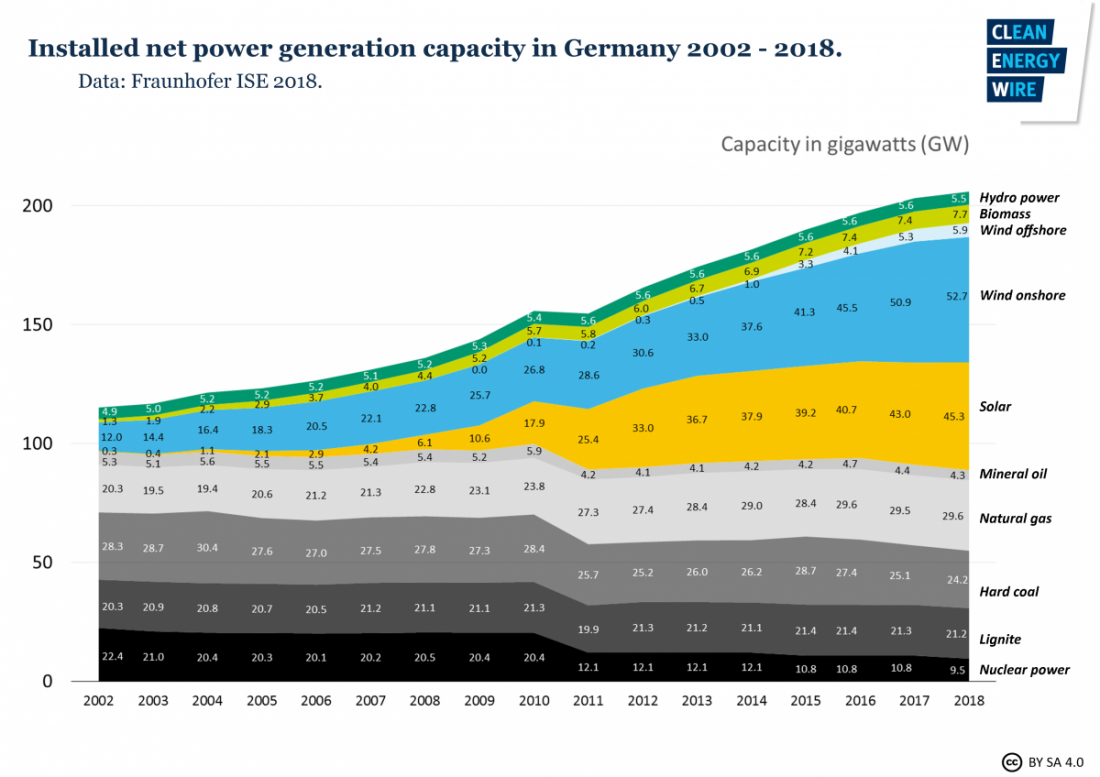
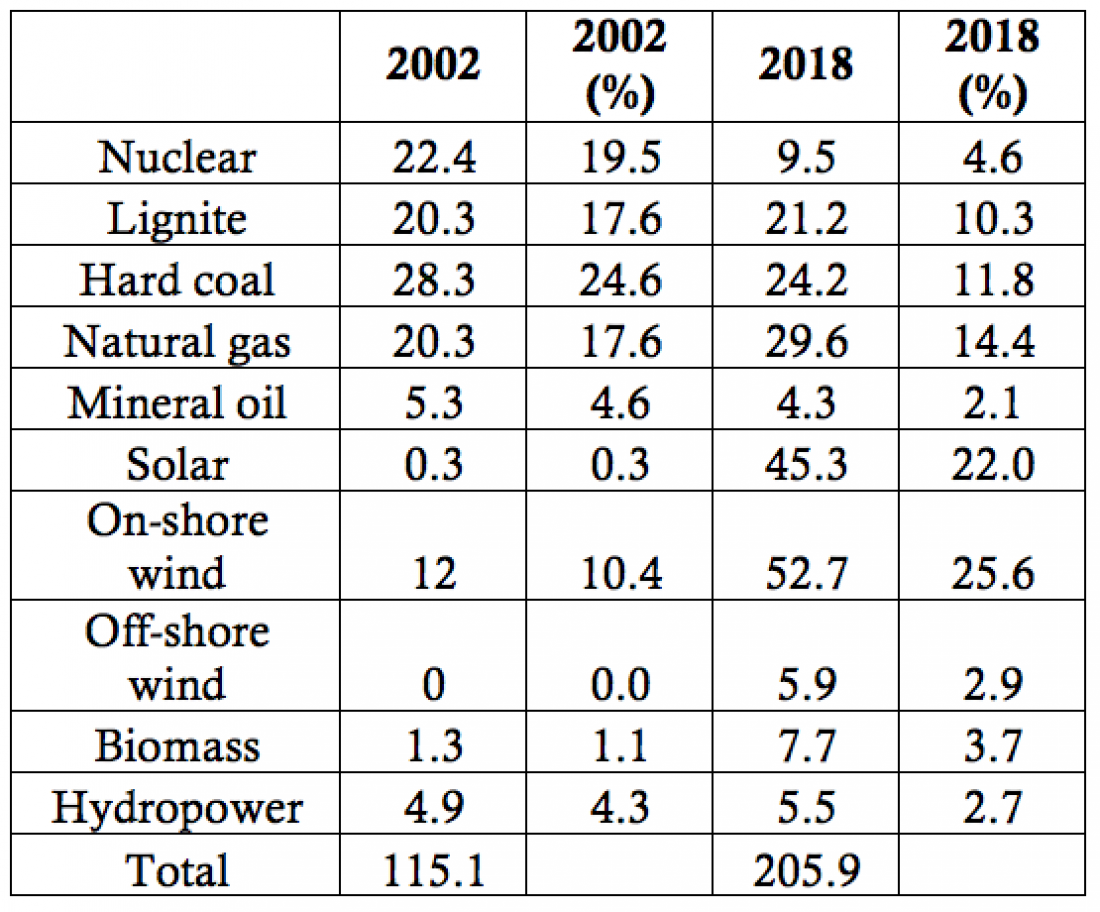
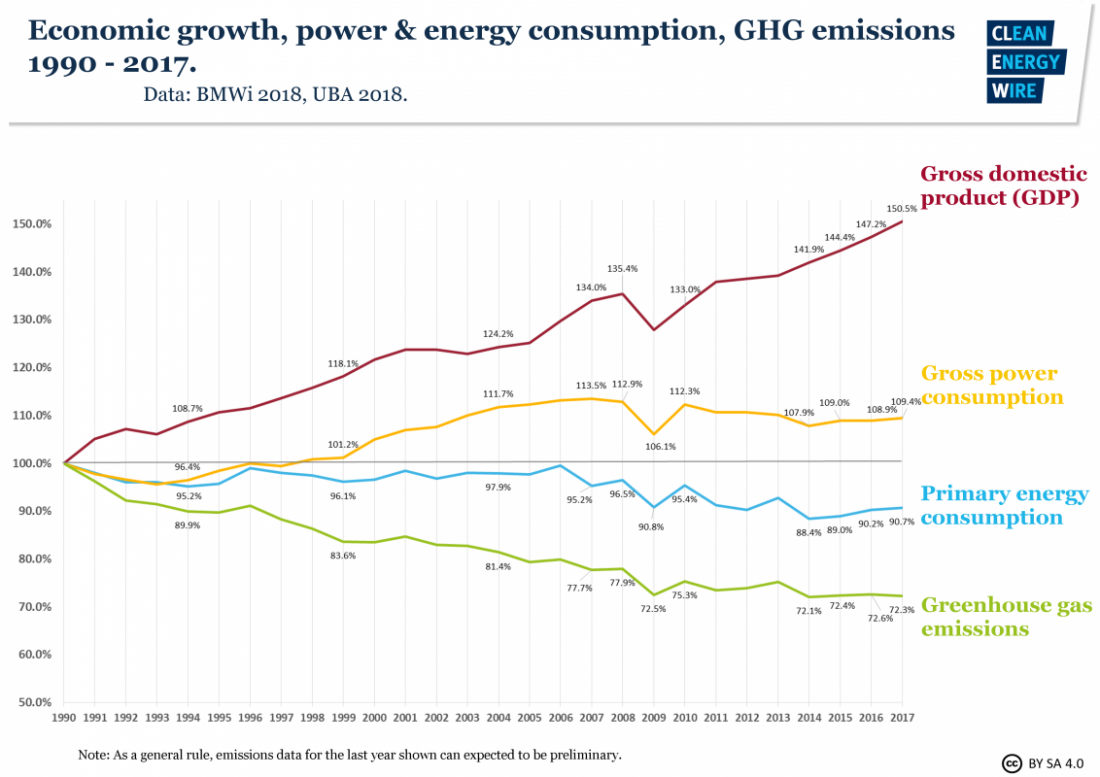


 Figure 2 – The edge of the Jewish cemetery in Hillersleben and the house behind it in 2008


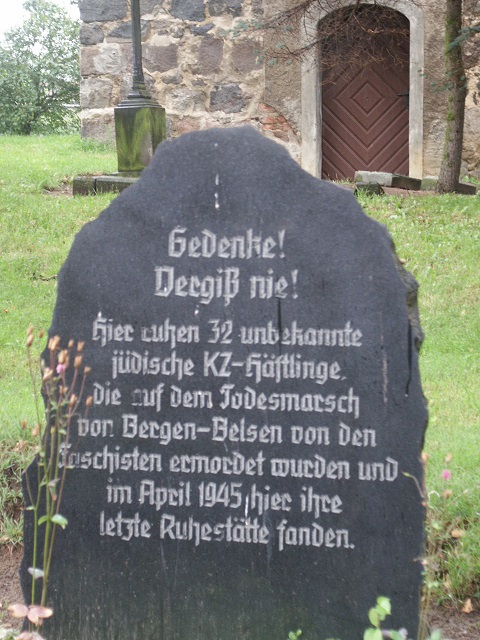 Figure 7 – 2019 photograph of an engraved stone memorial to the graves that were removed. It lists no names.
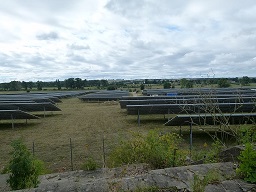 Figure 8 – Extent of the solar cells around Hillersleben, 2019
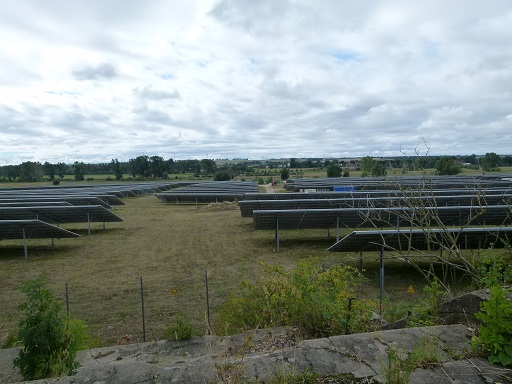
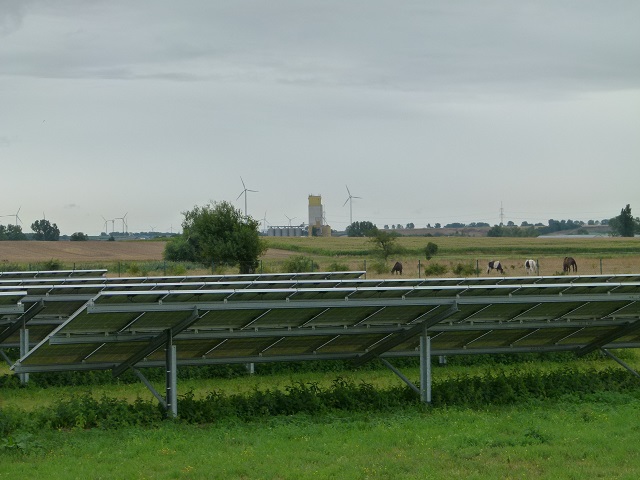

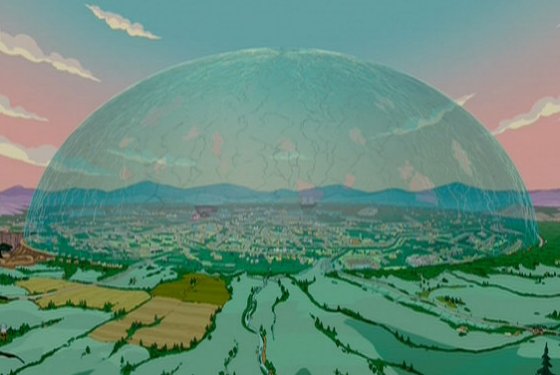 Figure 1 – The proposed “Mall of the World” in Dubai

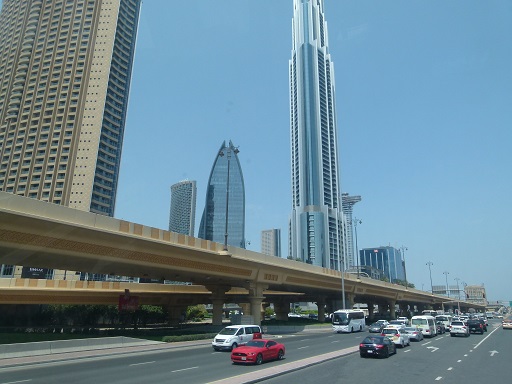
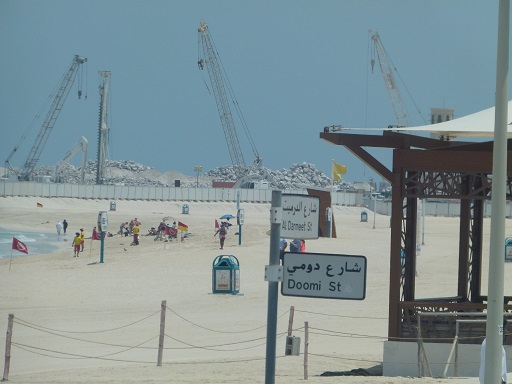 Figure 5 – Major construction in preparation for Expo 2020 in Dubai
 Figure 6 – Old Dubai
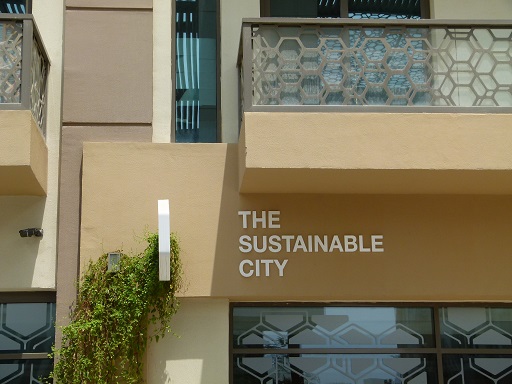
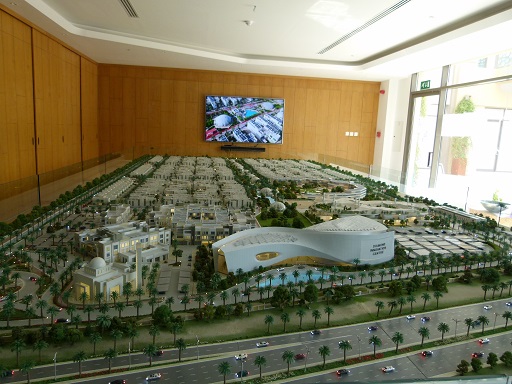 Figure 7 – A model of the full Sustainable City
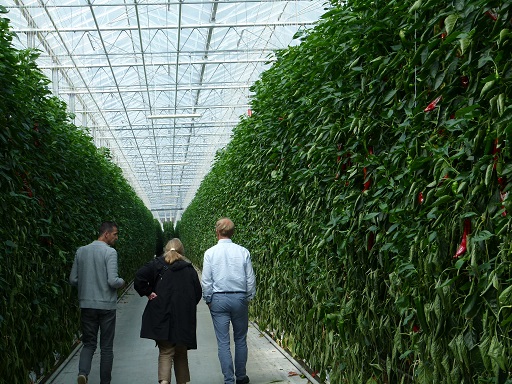
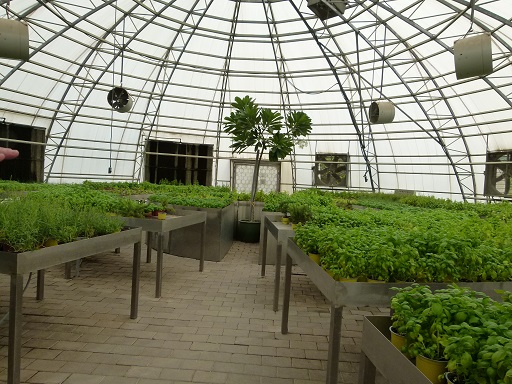 Figure 8 – A greenhouse
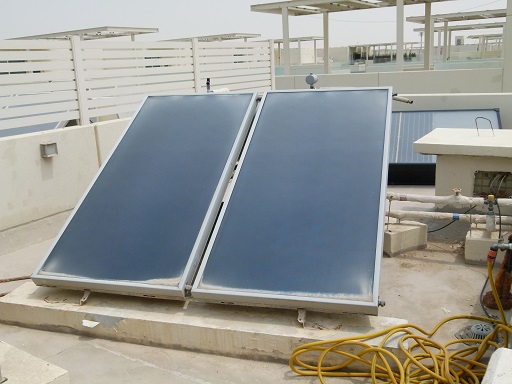 Figure 9 – Solar-powered dehumidifier and water heater
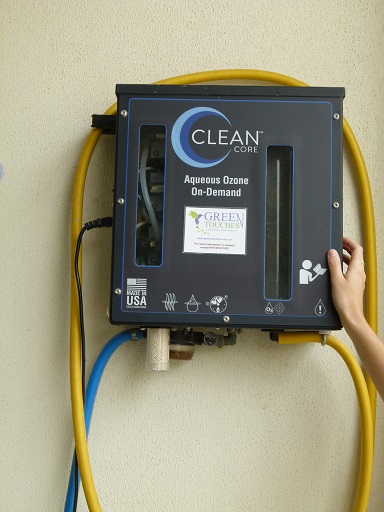 Figure 10 – Solar-powered ozonator for cleaning
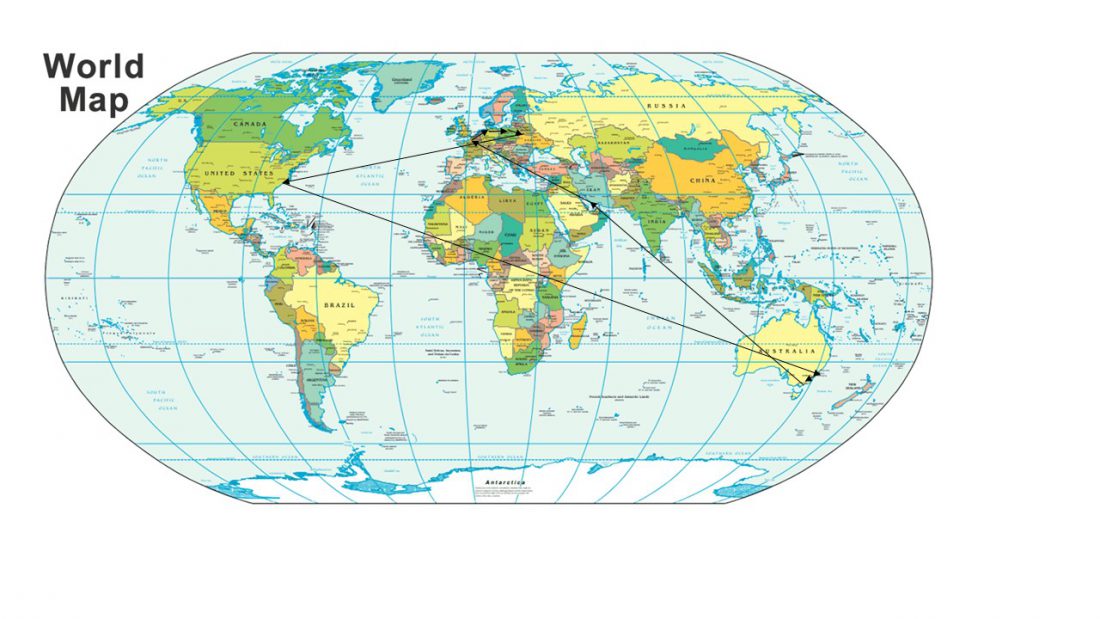 Figure 1 – Map of our travels (it’s a little hard to see the specifics but you get the idea)