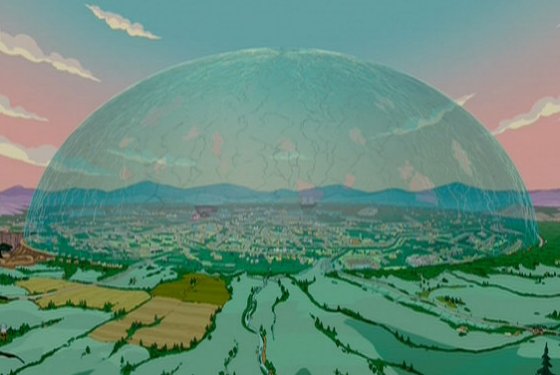
 Figure 1 – The proposed “Mall of the World” in Dubai
Last week, I posted some outlines of the trip that my wife and I took over the summer. The trip anchored on three family weddings that took place in Brisbane, Australia; Paris; and Krakow, Poland, as well as a commitment in Germany. The latter was an event near Magdeburg, Germany, where a school is leading an effort to erect a monument to both the American army and those that they liberated, including me, my mother, my uncle, and 2,500 other survivors of the Bergen-Belsen concentration camp (see the June 11th blog from this year).
As I mentioned last week, this was a very long trip and we needed some breaks, especially on the way from Australia to Europe. We decided that Dubai would be a good place to stop: we had never visited but many of our friends had recommended that we do so. We were a bit hesitant because we knew what to expect there at the height of the summer. Figure 2 shows the temperature and precipitation by month. We visited in the beginning of August. It was obvious to us that we would end up jumping from one air-conditioned place to another, with very little time spent outdoors. However, one of the aspects that interested me most (and fortunately interested my wife as well), was that it might give us a “realistic” picture of what we might expect the world to look like by the end of the century in a business as usual scenario (barring us fleeing to Mars).
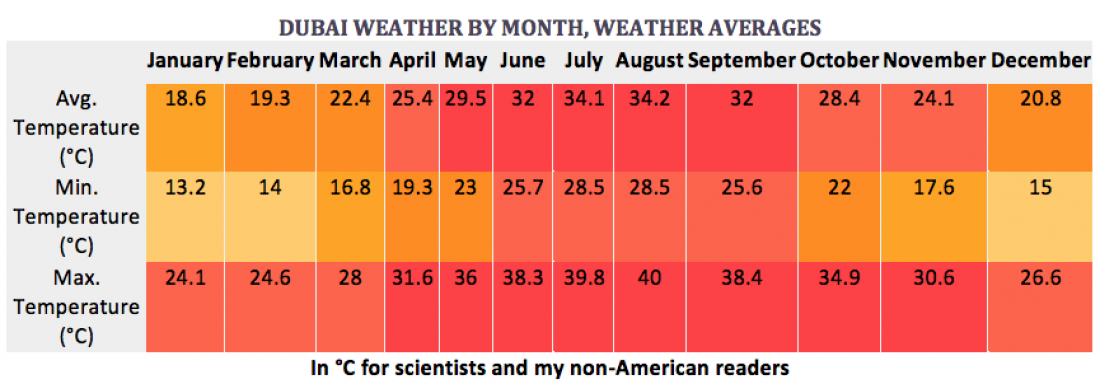
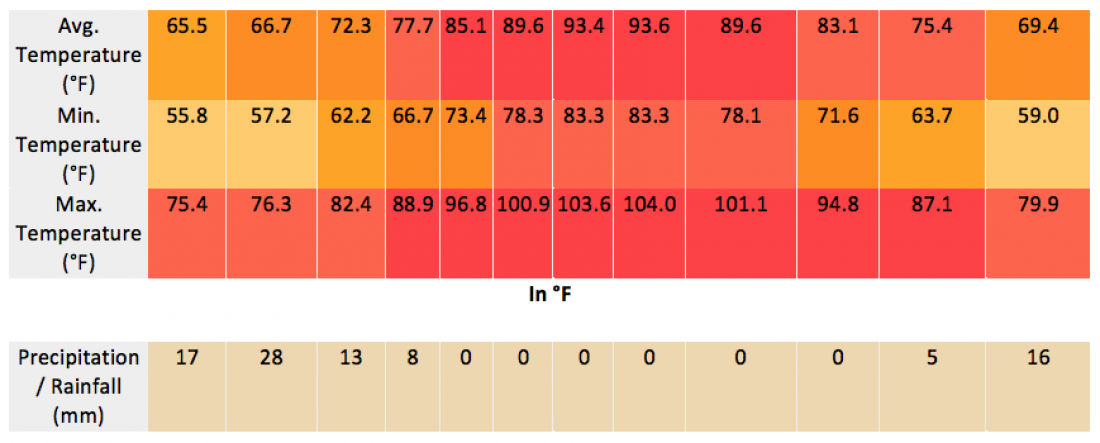 Figure 2 – The difference in precipitation between the driest month and the wettest month is 28 mm. The average temperatures throughout the year vary by 15.6 °C (Δ 28°F).
https://en.climate-data.org/asia/united-arab-emirates/dubai/dubai-705/
I found the opening picture (Figure 1) on the site ZME Science. It shows one of the solutions that was—and perhaps is still—being seriously considered. The site explains it this way:
Appropriately called Mall of the World, the city will cover an area of 48 million square feet and will set new records for various large behemoth structures: the largest indoor theme park in the world (the one actually covered by the dome), the largest mall (8 million sq. ft.), along with 20,000 hotel rooms catering to all types of tourists, and a cultural district with theaters built around New York’s Broadway, Ramblas Street in Barcelona, and London’s Oxford Street. If you ever had any doubt the Saudis have a thing for the ‘big’, here you go…
Aside from the obvious mistake in this paragraph that we are not talking about Saudi Arabia but rather about the United Arab Emirates (Dubai is the largest city in the UAE and the home of about half the country’s population), the description is more or less accurate.
Can we expand the concept globally? Many countries are trying on a local scale (see the October 24, 2017 blog) but none have attempted the scale shown in Figure 1. Maybe Dubai is the right place to start.
Of course, Dubai has a somewhat dubious recent history and there are some possible dark sides to these proposed developments:
Three decades ago, Dubai was little more than desert.
The city exploded in prosperity after the United Arab Emirates discovered oil in 1966, leading to a development boom that has resulted in the world’s tallest building, the second-biggest mall, one of the most luxurious hotels, and more skyscrapers than any city besides New York and Hong Kong.
Oil and gas now accounts for less than 1% of Dubai’s economy, down from 50% at one point, according to Bloomberg.
But for those looking at Dubai and wishing their country or city would use it as a model, Dubai may be more of a cautionary tale. The shiny, glass towers hide the trampling of the hundreds of thousands of migrant workers that built them. They hide the often opaque and arbitrary legal system, and the fear over what happens to the economy when the cranes stop building and the flow of foreign investment dries up, as happened in 2009.
Publications such as the UK’s Independent have further amplified the more nefarious aspects of the country and the project: “This is a city built from nothing in just a few wild decades on credit and ecocide, suppression and slavery.”
I am including some of the pictures I took during my visit: 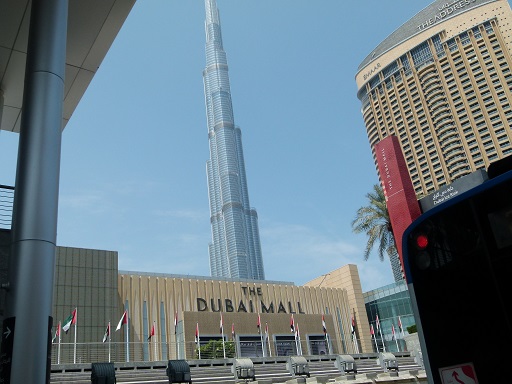
Figure 3 – The Dubai Mall and Burj Khalifa tower
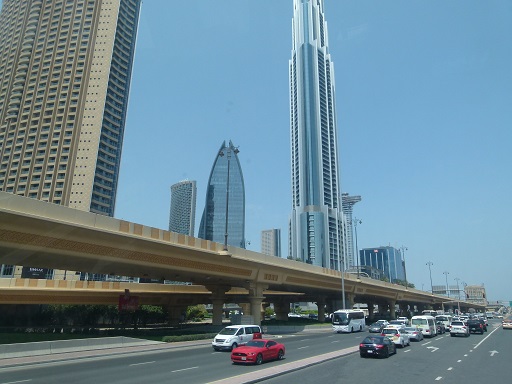
Figure 4 – Near the Dubai Mall
Once you enter the Dubai Mall, the heat is no problem. Nor is the income distribution (for you!). This is one of the biggest malls in the world, with luxury stores from all over the planet, American-sized prices, and as many restaurants as you care to count. The entertainment includes a great aquarium, on-site scuba diving, and the world’s largest fountain. You can also climb the world’s tallest building (so far), the Burj Khalifa (this comes with a US $200 price tag that we skipped), and so on.
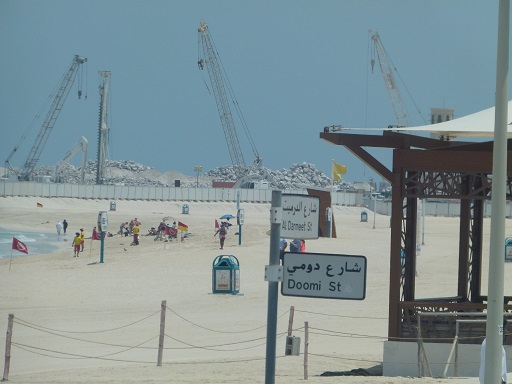 Figure 5 – Major construction in preparation for Expo 2020 in Dubai
Construction activity is everywhere—as shown in Figure 5—mainly in anticipation of Expo 2020. However, a recent Reuters poll predicts a sharp decline in house prices.
Figure 6 shows a different picture of Dubai: that of the old city, still critically dependent on window air conditioners.
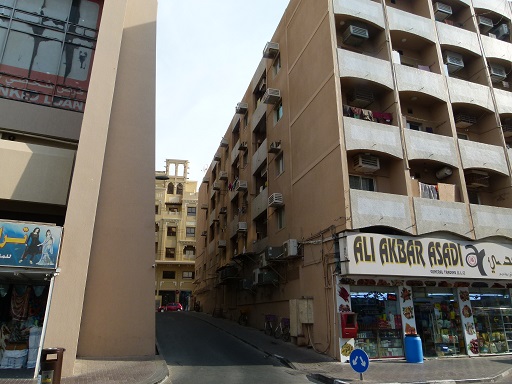 Figure 6 – Old Dubai
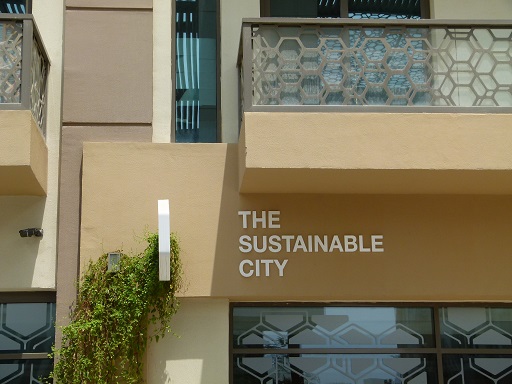
Sustainable City
However, the most striking example of a direction that Dubai might be taking came during our first day there, when we visited its “Sustainable City.” According to Wikipedia:
The Sustainable City is a 46 hectare property development in Dubai, United Arab Emirates. Situated on the Al Qudra road, it is the first net zero energy development in the Emirate of Dubai. The development includes 500 villas, 89 apartments and a mixed use area consisting of offices, retail, healthcare facilities, a nursery and food and beverage outlets. Phase 2 of the development will include a hotel, school and innovation centre.
The City was developed by Dubai-based Diamond Developers, whose Chief Executive Officer, Faris Saeed, has stated that much of his inspiration for the development came from UC Davis West Village.
Key elements of the City include:
- a residential area of 500 townhouses and courtyard villas inspired by Dubai’s old Bastakiyadistrict
- 11 natural ‘biodome’ greenhouses, organic farm and individual garden farms for local food production that use a passive cooling method with fans and pads.
- 10 MW peak solar production
- waste water recycling, with segregated drainage for greywater andblackwater using papyrus as a biofilter
- biking and shaded jogging trails
- charging stations for electric cars
- an equestrian center
Apart from periphery roads and car parking areas, the development is a car-free site.
The parking areas are topped by solar shading featuring solar panels that are connected to an electrical grid to supply energy into different sections of the city.
Panels are also placed on the roofs of all of the houses.
The construction waste is reused to furniture the public spaces.
The townhouses have UV reflective paint to reduce the thermal heat gain inside the houses.
Here are some pictures from inside the Sustainable City:
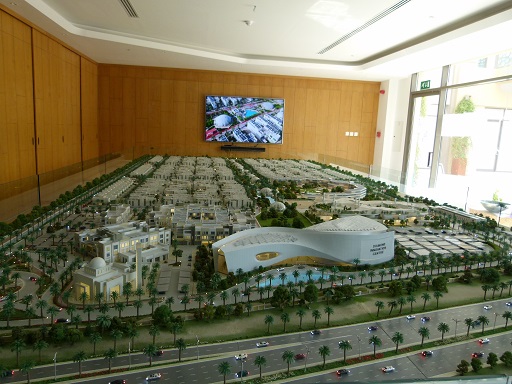 Figure 7 – A model of the full Sustainable City
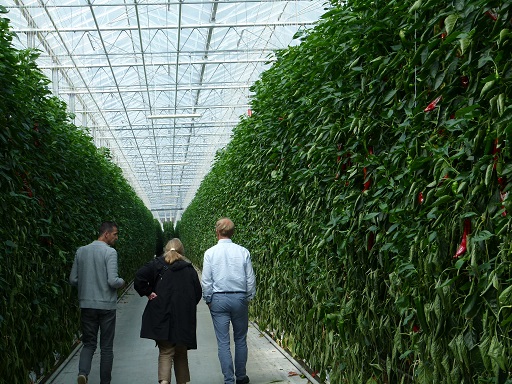
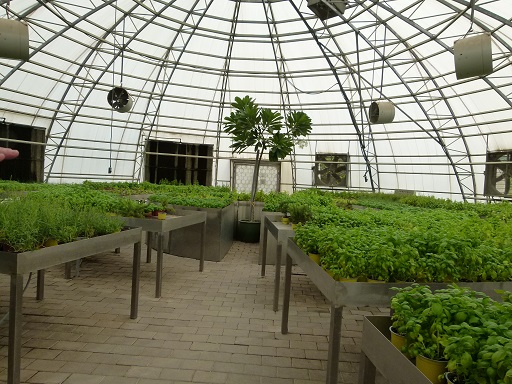 Figure 8 – A greenhouse
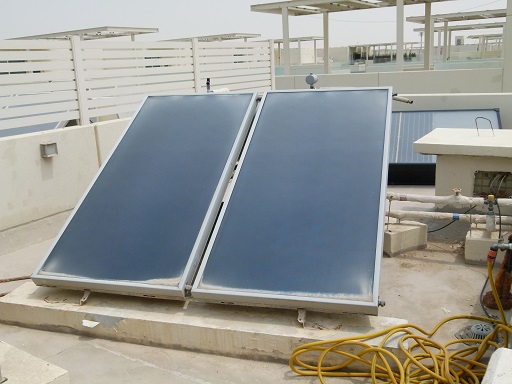 Figure 9 – Solar-powered dehumidifier and water heater
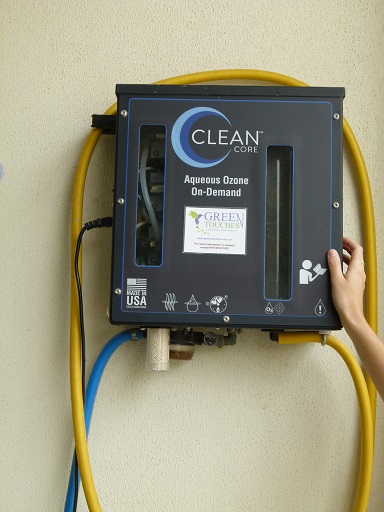 Figure 10 – Solar-powered ozonator for cleaning
The United Arab Emirate’s officials have collected articles about its efforts to make the country and the city of Dubai sustainable on a site called The Sustainabilist.
Energy storage, so essential in any setting that relies on sustainable solar energy, was not mentioned. Nor was doing so necessary on the part of the Sustainable City’s tour guides. The city has an agreement with the emirate that all renewable energy is routed through (and stored by) the emirate’s mostly fossil-fueled power company. They buy it at the same price as traditional fuels, and those who produce it can then drawn upon it when needed for the same price. This process of selling excess solar power to a utility and then using it later is called load leveling. In Germany, the price that you get from the utility for the access energy that you deliver is only 10% of what you have to pay when you draw upon it later. That the UAE is offering equal prices for both directions constitutes a great subsidy. Not only that, UAE’s utility companies signed long, 25-year or more contracts to buy electricity from these solar power plants, which gives the solar developers more time to pay off the initial investment, making for cheaper solar power overall.
Next week I will start to explore other stops from this trip.
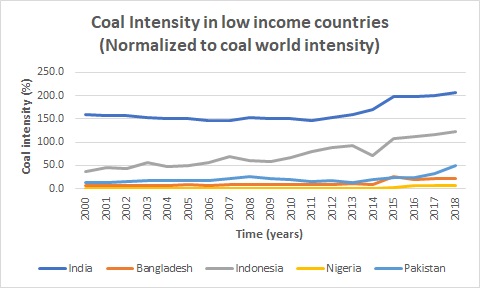
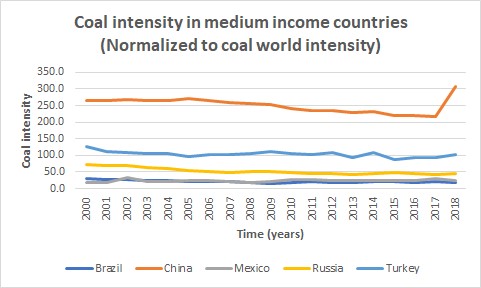
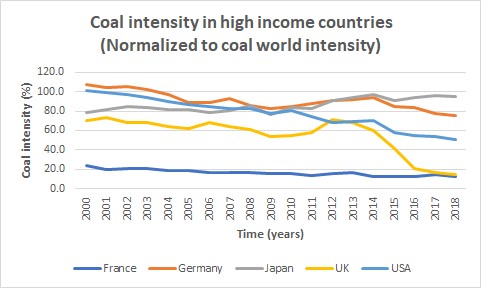
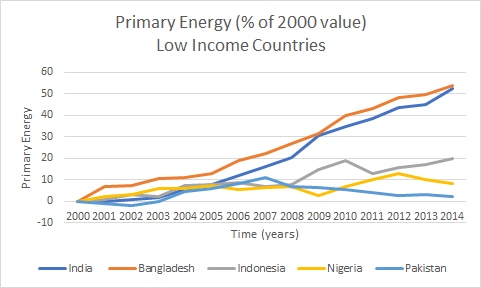 Figure 2 – Use of primary energy in low-income countries, as % of year 2000 value
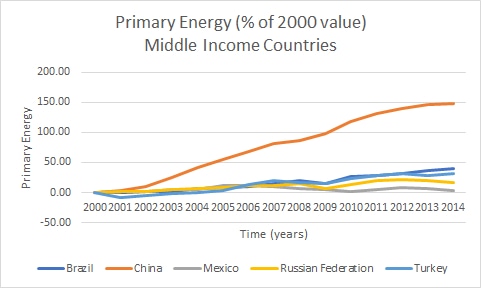 Figure 3 – Use of primary energy in middle-income countries, as % of year 2000 value
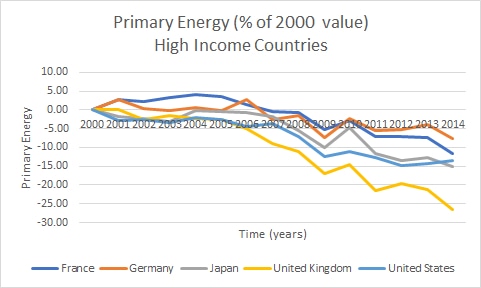 Figure 4 – Use of primary energy in high-income countries, as % of year 2000 value
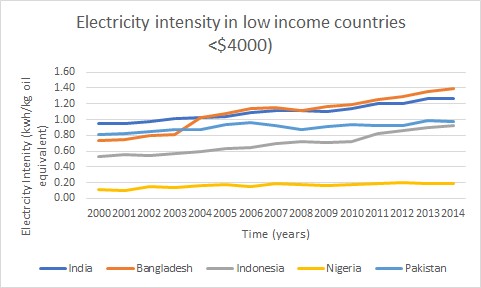 Figure 1 – Low-income countries
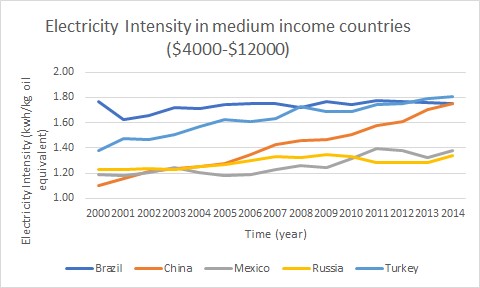 Figure 2 – Medium-income countries
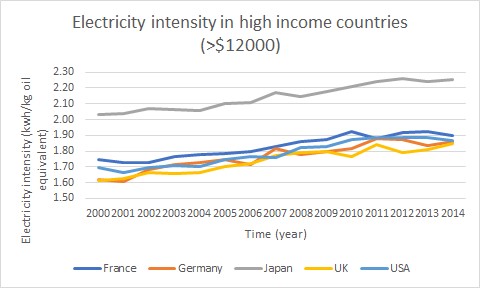 Figure 3 – High-income countries
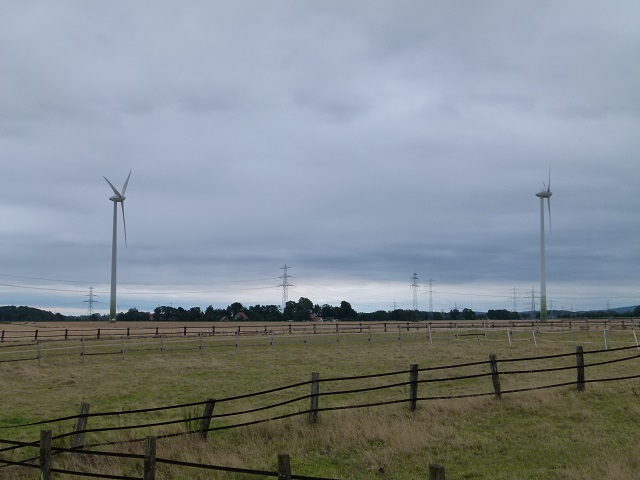

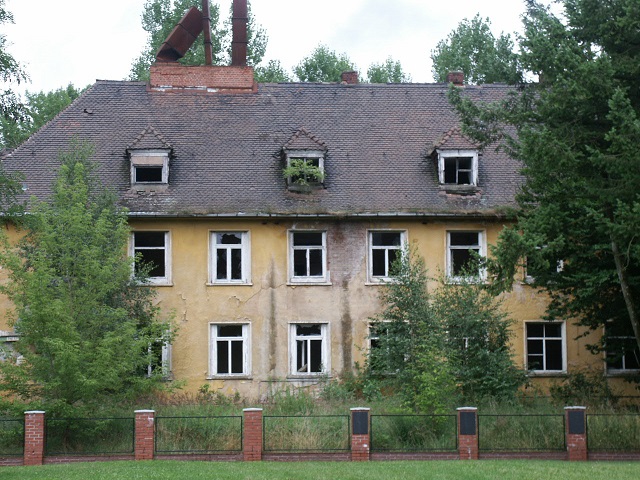 Figure 2 – The edge of the Jewish cemetery in Hillersleben and the house behind it in 2008
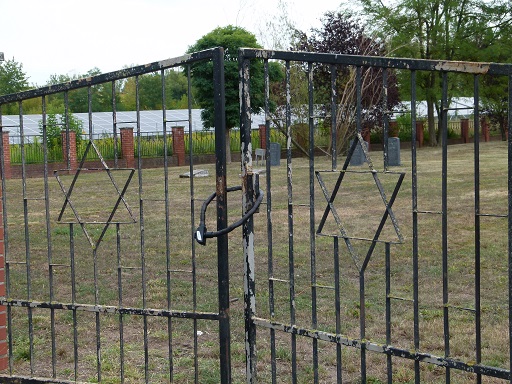
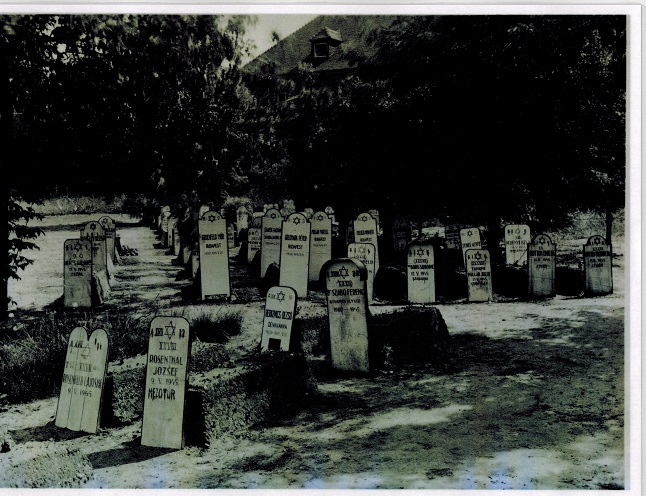
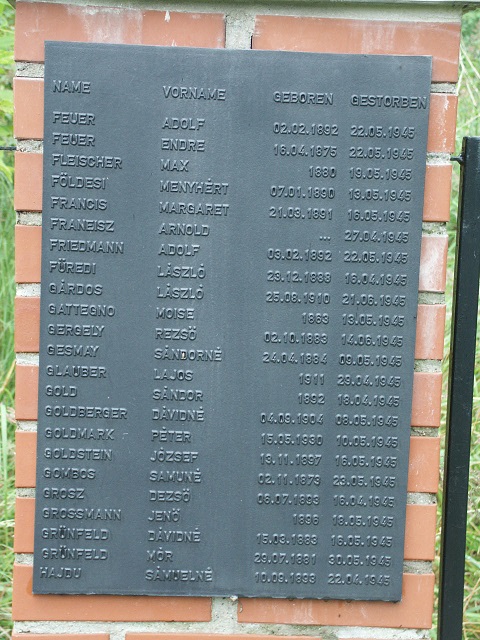
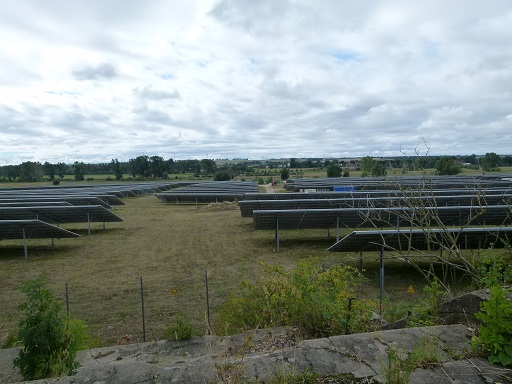
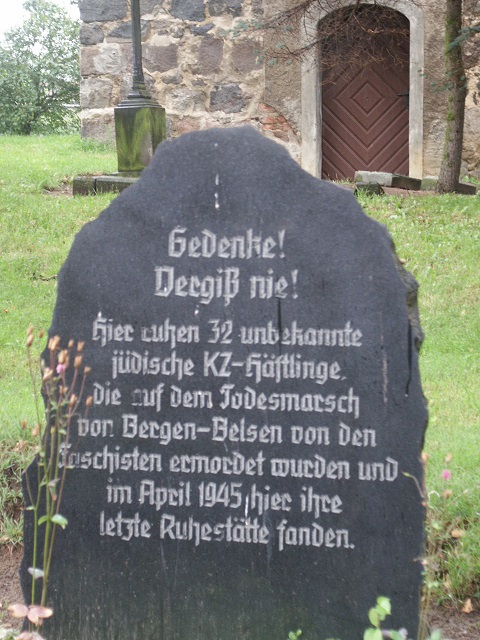 Figure 7 – 2019 photograph of an engraved stone memorial to the graves that were removed. It lists no names.
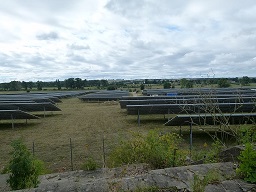 Figure 8 – Extent of the solar cells around Hillersleben, 2019
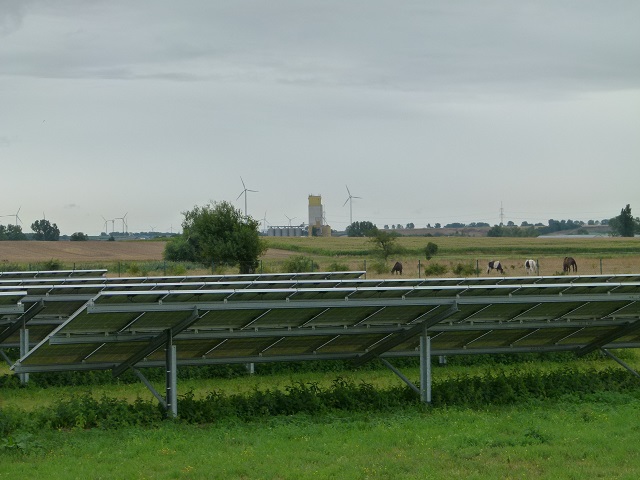
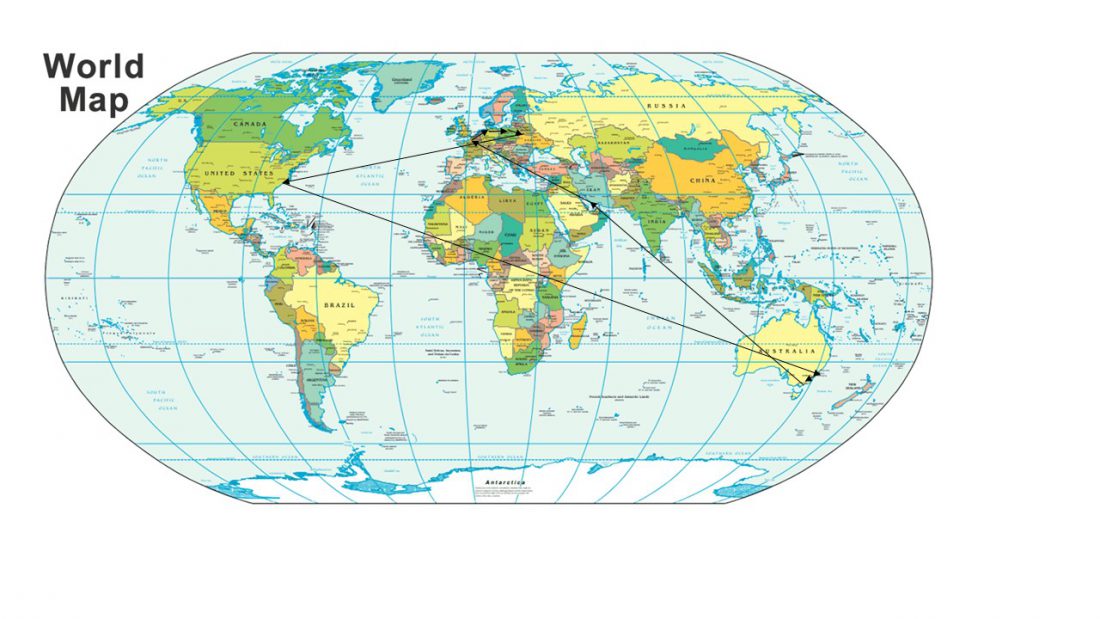 Figure 1 – Map of our travels (it’s a little hard to see the specifics but you get the idea)