Hello! Happy belated Earth Day and happy 7th birthday to the Climate Change Fork blog! We are guest bloggers Nataly Azouly and Anelisa Defoe. Respectively, our majors are Actuarial Mathematics (BS) with a minor in Physics, and Physics (BA) and Exercise Science (BS). We will graduate from Brooklyn College CUNY in May of 2019. Under the guidance of Micha Tomkiewicz, PhD, we have been able to use our backgrounds and experiences to better understand the importance of regulating carbon emissions for the benefit of our planet.
A carbon tax in the US was initially proposed in 1990 in response to the IPCC’s First Assessment Report, as a measure for reducing greenhouse gas production. It was met with bipartisan opposition repeatedly until the late 2000s, when the 2007 IPCC Fourth Assessment presented more aggressive evidence of global warming1. The 2016 Paris Agreement emphasized the importance of reducing the carbon footprint worldwide, mandating that signatory nations make a joint commitment to reinforce efforts to mitigate climate change2. Implementing a carbon tax in the US presented an effective means for discouraging the consumption of energy from nonrenewable sources while promoting clean energy alternatives.
Presently, there are no active carbon tax policies enforced at either state or federal levels in the US. A 2016 publication by the Congressional Budget Office proposed a plan for an annual increase of revenue through carbon taxation3. This initial, forceful approach to carbon taxation planned to generate $32.9 billion between 2017 and 2018. A trend of 2% annual increase in the tax would be implemented and result in a net federal revenue increase of $977.2 billion between 2017 and 2026. Consequently, businesses’ costs would increase while income and payroll taxes decreased. If approved, CO2 emissions would be taxed $25 per metric ton based on CO2e (equivalents) necessary to cause warming. Carbon emissions would be predicted to decline by 9% within the 1st decade of enforcing carbon taxes. The proposal offers a model for state governments to adopt and modify the measure for an optimal increase in revenue. However, the plan has not been passed into law anywhere.
Oppositional arguments against a carbon tax assert that reducing US carbon emissions would destabilize the economy by increasing cost production of emission-intensive goods and services. Indeed, without empirical data to reference, the socioeconomic risk-benefit ratio for residents is uncertain. Therefore, it is plausible that a reduction in climate change might more immediately benefit other countries, particularly developing ones, as opposed to the US. Another argument suggests that industries with high emission rates might simply relocate to other countries that have minimal restrictions on the use of nonrenewable resources. Consequently, the carbon tax would prove ineffective overall in reducing the global carbon footprint.
A January 2019 publication by the Center for Climate and Energy Solutions (C2ES) reports state efforts to target the transportation sector4. The sector’s increase in carbon emissions nationwide between 1990 and 2016 attests to the need for regulation. At present, 14 states have proposed legislation to encourage a transition to zero emission vehicles (ZEV). ZEVs include both plug-in and fuel cell electric vehicles, thereby deviating from the use of traditional gas for motor vehicles. Under section 209 of the Clean Air Act, California has the ability to spearhead operations that place greater restrictions than the federal government on carbon emissions. Similarly, under section 177 of the Clean Air Act, states such as New York, New Jersey, Colorado, and others may enforce comparable policies reflective of California’s precedent.
At the congressional level, the cap and trade model serves as the primary mode for reducing carbon emissions5. Instead of taxing emissions, the government limits how much carbon various factions may produce. These limitations are measured in metric tons that companies and other groups may not exceed. This model serves the interests of the private sector more effectively than it reduces net carbon emissions. As observed in other countries, a carbon tax would yield greater results for reducing emissions.
On a global scale, economists endorse the carbon tax as being the most effective tool for both reducing the carbon imprint6 and encouraging the advent and refinery of prospective technologies. Its implementation in an array of countries demonstrates that its success rate is dependent on the dynamic systems that constitute a particular society.
A March 2016 New York Times publication confirmed the difficulty of British Columbia’s (BC) task to institute a carbon tax7. Between 2008 and 2012, carbon emissions there fell 10%. With a tax of about $22.20 US per ton of CO2 emissions, revenues stimulated the economy and gradually gained voter acceptance. However, in response to stagnation in the tax’s growth, carbon emissions began to increase. To continue reducing the carbon imprint via taxes, BC must increase the tax at a rate of $7.46 US per ton annually. This task has been met with the above-mentioned challenge of preventing businesses from relocating to other countries with fewer restrictions on carbon emissions.
Anthesis Enveco’s March 2018 overview of Swedish carbon tax details a successful 26% decrease in carbon emissions between 1991 and 20168. It is noteworthy however, that Sweden has a historical affinity for renewable energy resources to substitute fossil fuel consumption; in juxtaposition, BC has a far greater dependence on companies that are incentivized by cheaper nonrenewable energy. Sweden has access to biomass and hydropower to generate energy. Furthermore, the country’s carbon tax is complemented by legislation that predates it—including a cap and trade model—as well as a transition to ZEVs (like the US), and a combination of prolific resources and government initiatives.
Similarly, Norway implemented a carbon tax in 1991. The target goal is to have a 40% reduction of carbon emissions, relative to the 1990s, by 20309. Mirroring Sweden’s approach, a carbon tax in conjunction with incentives to transition to battery electric vehicles would further mitigate the carbon footprint. It is also essential to note that—as with Sweden—Norwegian energy systems are already 98% renewable. Therefore giving up reliance on coal-based energy sources does not present the same adversity as it does in British Columbia.
Our Analysis
A carbon tax is designed to reduce fossil fuel emissions. Placing a carbon tax on fossil fuels would essentially raise the prices for consumers and force households and corporations to make decisions regarding their consumption of said fuels accordingly. Instead of allowing the market to naturally adjust its price based on supply and demand, issuing a carbon tax would therefore give the government a greater amount of market power, leaving room for alternative energy sources to become competitive.
According to the law of demand (Mankiw), all other things equal, when the price of a good rises, the demand for the good falls. Essentially, an individual or group would be incentivized to consume fewer fossil fuels solely based on an increase in price.
In order to create a demand curve, data was collected comparing the price of crude oil (USD) to the CO2 emissions (kilotons) in the US during the corresponding year. Since 82% of greenhouse gas emissions in the US are a result of the burning of oil, coal, and natural gas, the price of crude oil will be used as a proxy to represent the price of fossil fuels in the United States. In addition, CO2 emissions will be used as a proxy to represent fossil fuel consumption.
The data we are using was collected from the years 1997 to 2014 by the World Bank and Macrotrends. Our hypothesis states that, based on the nature of the law of demand in macroeconomics, a carbon tax is an effective tool to mitigate CO2 emissions.
First, to evaluate the significance of the price of crude oil in the United States in determining carbon emissions, a regression has been run yielding the following equation:
CO2 = -3000 x Price + 5.7×10⁶
A regression is a measured relationship between the average value of the dependent variable and the input value of the independent variable. In this case, the independent variable is “Price,” the price of crude oil in USD, and the dependent variable is CO2, the carbon emissions in kilotons. Due to the negative coefficient of the price of crude oil in the US, this implies that when the price of oil is increased by $1, the predicted average CO2 emissions decreases by 2999.6 kilotons. Therefore, there is an inverse relationship between CO2 emissions and the price of oil as predicted by the law of demand. This equation can also be used to predict the shape of the demand curve of oil in the United States.
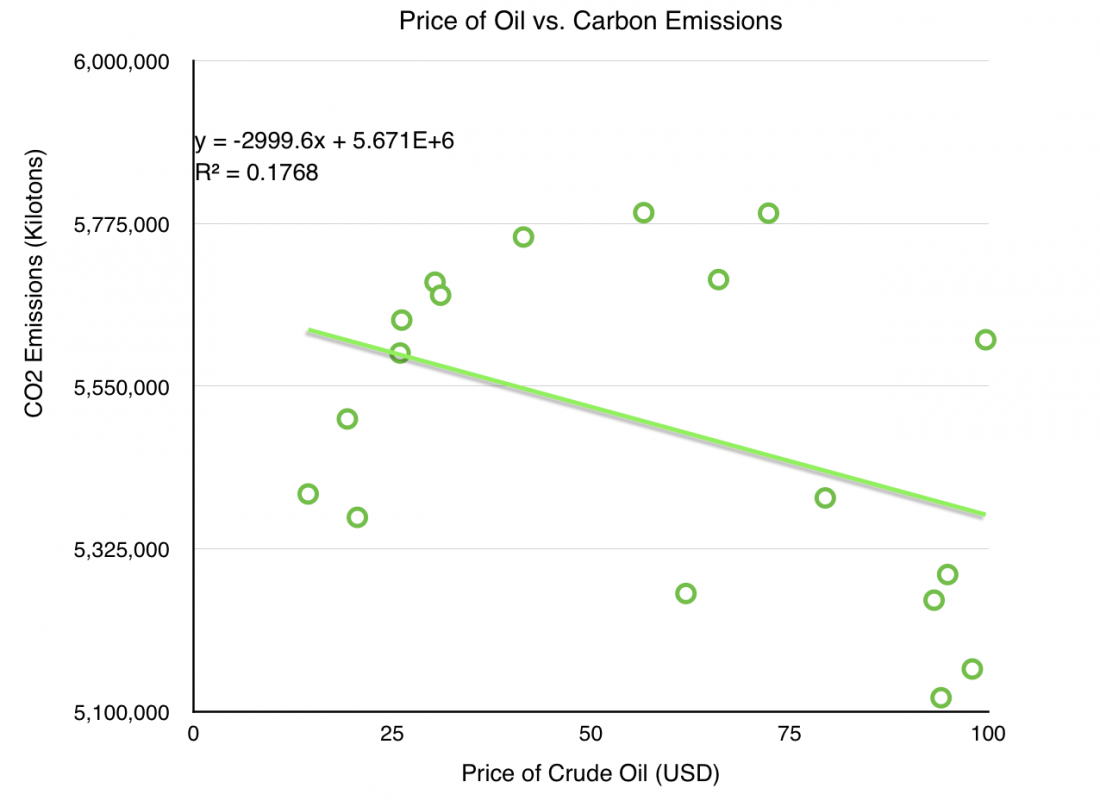
This distribution has an R2 value of 0.18. R2 is statistical measure that explains the proportional effect a variable has on the variation of another variable. In this case, it means that the price of crude oil explains an 18% variation in carbon emissions—a large value for cross-sectional data. This makes it a significant variable in predicting carbon emissions in a given year.
To determine the statistical significance of the variable Price, we will be conducting a one-tailed hypothesis test (t-test). A t-test is used to determine the significance of the hypothesized coefficient produced by the regression. To test H0: A=0 (The hypothesized value) versus H1: A<0 (The alternate hypothesis) at the α level of significance, reject H0 if t is either
(t) ≤ -tα,n−1
Where A is the coefficient of the variable Price.
In this case, t = −1.854 and −tα/2,n−1 = -1.7396. Since −1.854 < -1.7396, we reject the null hypothesis in favor of the alternative hypothesis that the coefficient of the Price is less than 0.
Lastly, looking at the correlation of the variables, Corr(CO2 emissions, price of oil), we find that:
Corr(CO2 emissions, price of oil) = -0.42052344
A negative correlation is a relationship between two variables such that as the value of one variable increases, the other decreases. Therefore, as the price of crude oil increases, CO2 emissions decrease. This can imply that there is an inverse relationship between the price of carbon and its consumption. According to these results, a carbon tax would effectively mitigate the use of fossil fuels in the United States.
Conclusion
Approximately 82% of greenhouse gas emissions in the US are a result of our burning oil, coal, and natural gas. The objective of this research was to determine the effectiveness of a carbon tax to mitigate the use of fossil fuels and reduce carbon emissions. Through observation of countries with successful carbon tax policies, current legislation concerning fossil fuel production and consumption, and statistical analysis, we determined that implementing a carbon tax is an effective tool in mitigating carbon emissions by demonstrating that there exists an inverse relationship between the price of fossil fuels and their consumption.
Our analysis shows that a carbon tax is an effective method to mitigate the use of fossil fuels. The creation of a carbon tax raises the issue of what to do with the tax revenue raised by this new policy. Proposals have included issuing a rebate, investing in clean energy technology, and using these funds to decrease the US government’s deficit. We determined that the best uses for the revenue generated from a carbon tax would be to offer a rebate to lower and middle class individuals while also investing in research for new technologies in clean and renewable energy in order to decrease the costs of renewable energy sources and methods.
References:
1 “Know the Legislation.” Price on Carbon. 4 Jan. 2019, 21 Apr. 2019, https://priceoncarbon.org/business-society/history-of-federal-legislation-2/.
2 “Paris Climate Agreement Q&A.” Center for Climate and Energy Solutions. 7 Jan. 2019, 21 Apr. 2019, https://www.c2es.org/content/paris-climate-agreement-qa/.
3 “Impose a Tax on Emissions of Greenhouse Gases.” Congressional Budget Office, 8 Dec. 2016, www.cbo.gov/budget-options/2016/52288.
4 “U.S. State Clean Vehicle Policies and Incentives.” Center for Climate and Energy Solutions, 15 Feb. 2019, www.c2es.org/document/us-state-clean-vehicle-policies-and-incentives/.
5 Specht, Steven. “Developing an International Carbon Tax Regime.” Sustainable Development Law & Policy, vol. 16, no. 2, 2016, pp. 30–31, https://digitalcommons.wcl.american.edu/sdlp/vol16/iss2/5/.
6 Specht, Steven. “Developing an International Carbon Tax Regime.” Sustainable Development Law & Policy, vol. 16, no. 2, 2016, pp. 29–30, https://digitalcommons.wcl.american.edu/sdlp/vol16/iss2/5/.
7 Porter, Eduardo. “Does a Carbon Tax Work? Ask British Columbia.” The New York Times, 21 Dec. 2017, www.nytimes.com/2016/03/02/business/does-a-carbon-tax-work-ask-british-columbia.html.
8 Scharin, Henrik, and Jenny Wallström. “The Swedish Carbon Tax- An Overview.” 5 Mar. 2018, pp. 17–30, www.enveco.se/wp-content/uploads/2018/03/Anthesis-Enveco-rapport-2018-3.-The-Swedish-CO2-tax-an-overview.pdf.
9 “Putting a Price on Emissions: Polluters Should Pay.” 2 Apr. 2018, www.unfccc.int/sites/default/files/resource/119_TalanoaSubmissionNorway1apr2018END_rev.pdf.
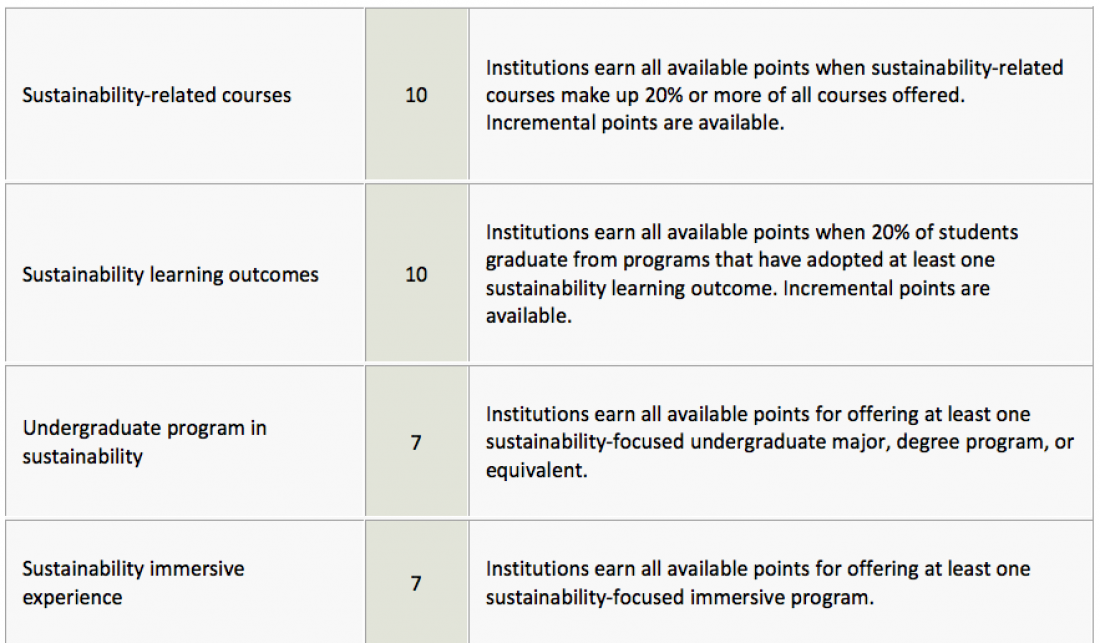
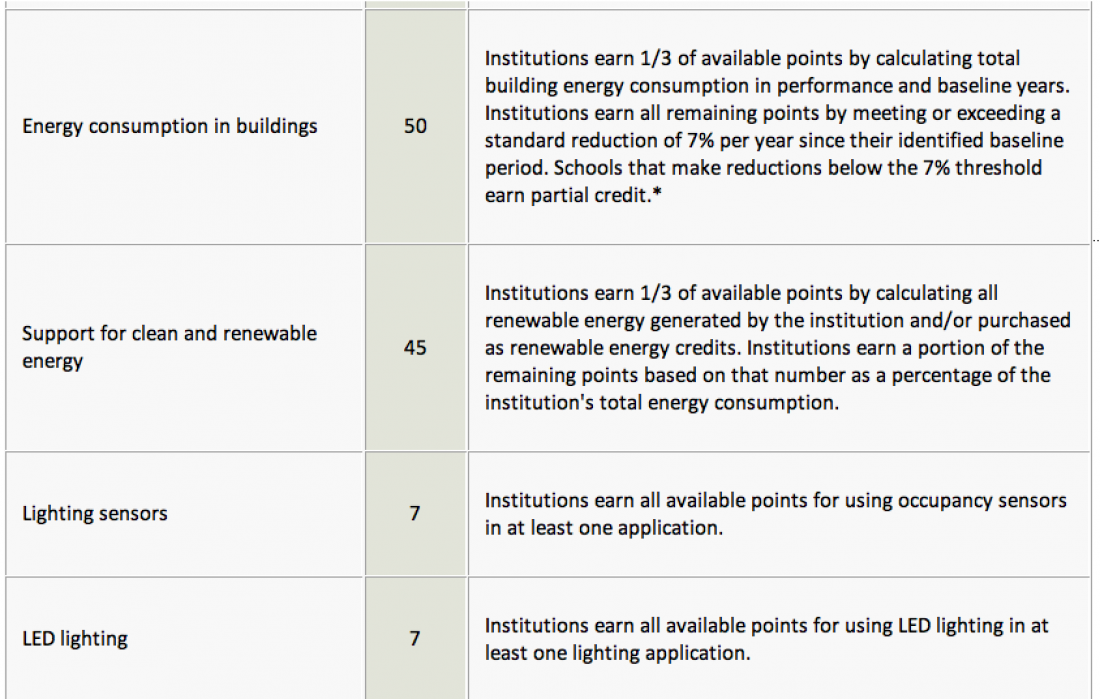
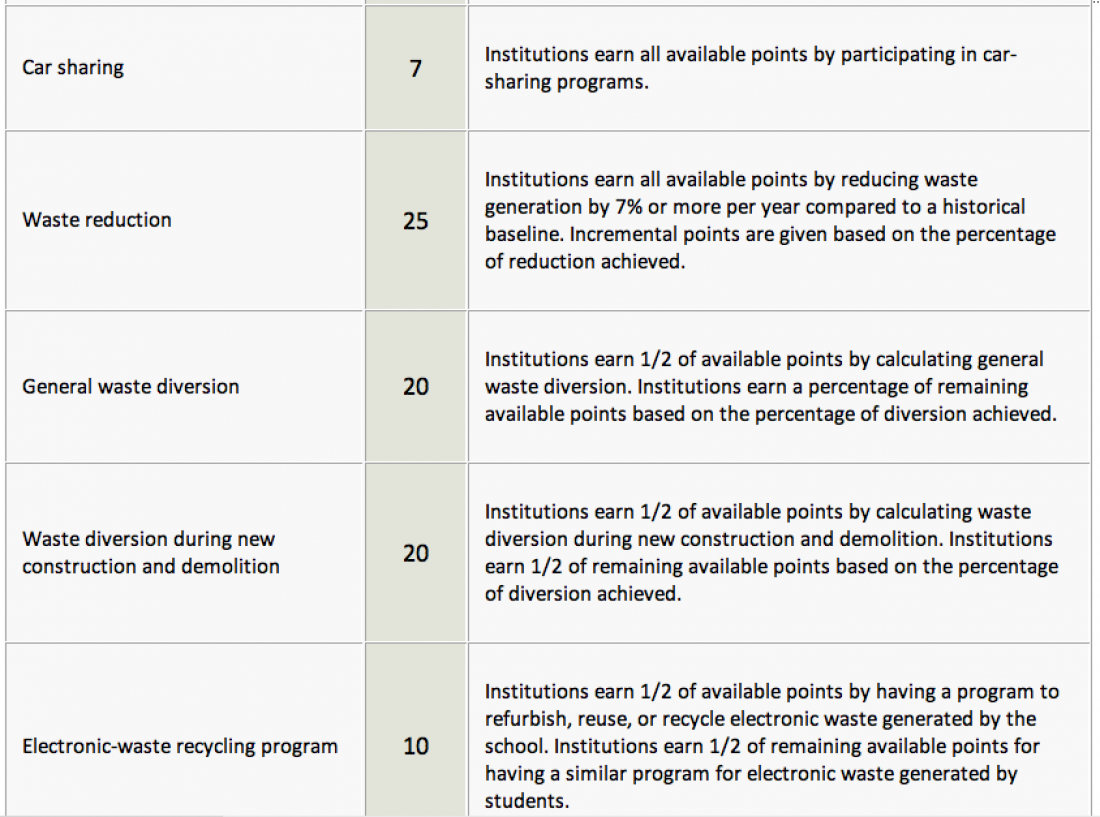
 This is self-explanatory.
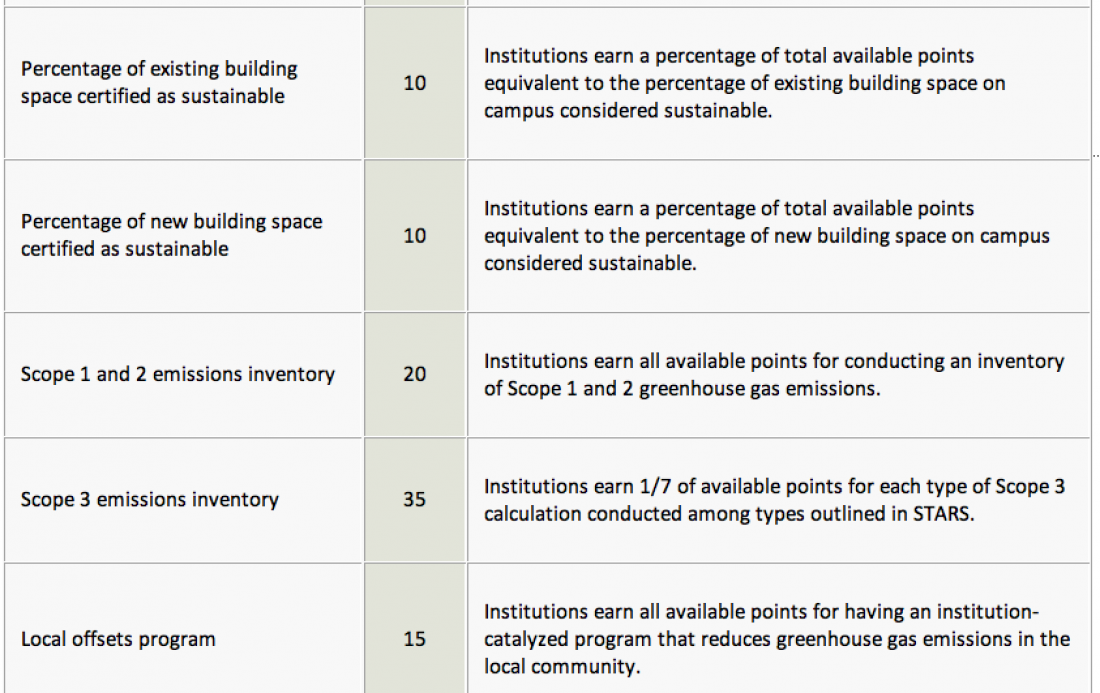
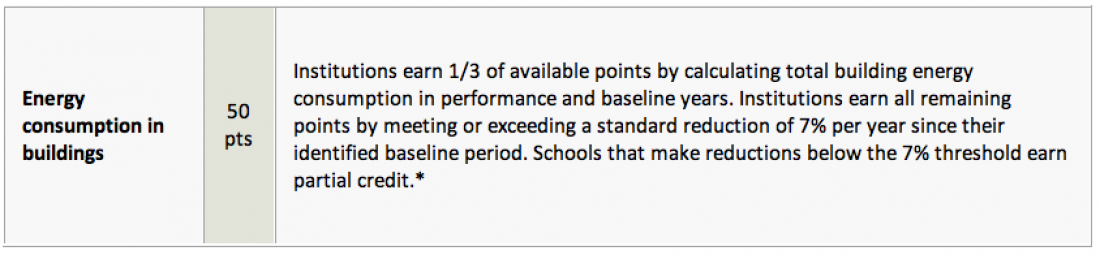 This can be done building by building, starting with the oldest buildings.
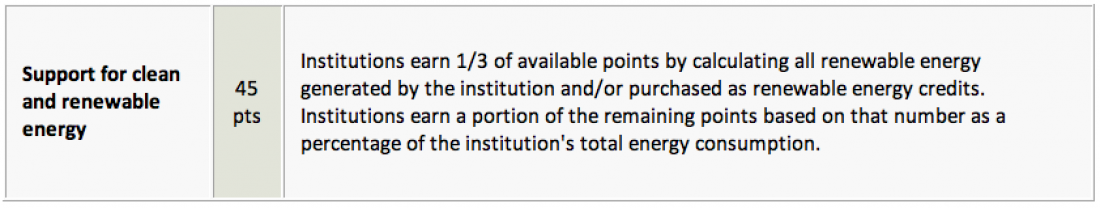 There was a June 13th conference on the use of solar energy on CUNY campuses. I will expand on this issue next week with some details about the conference.
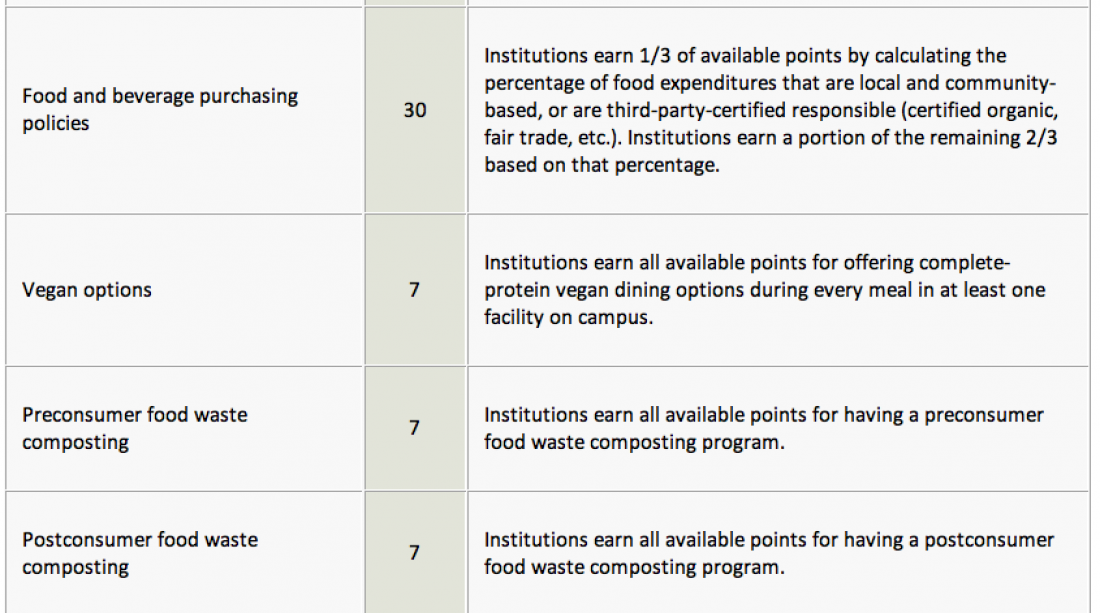
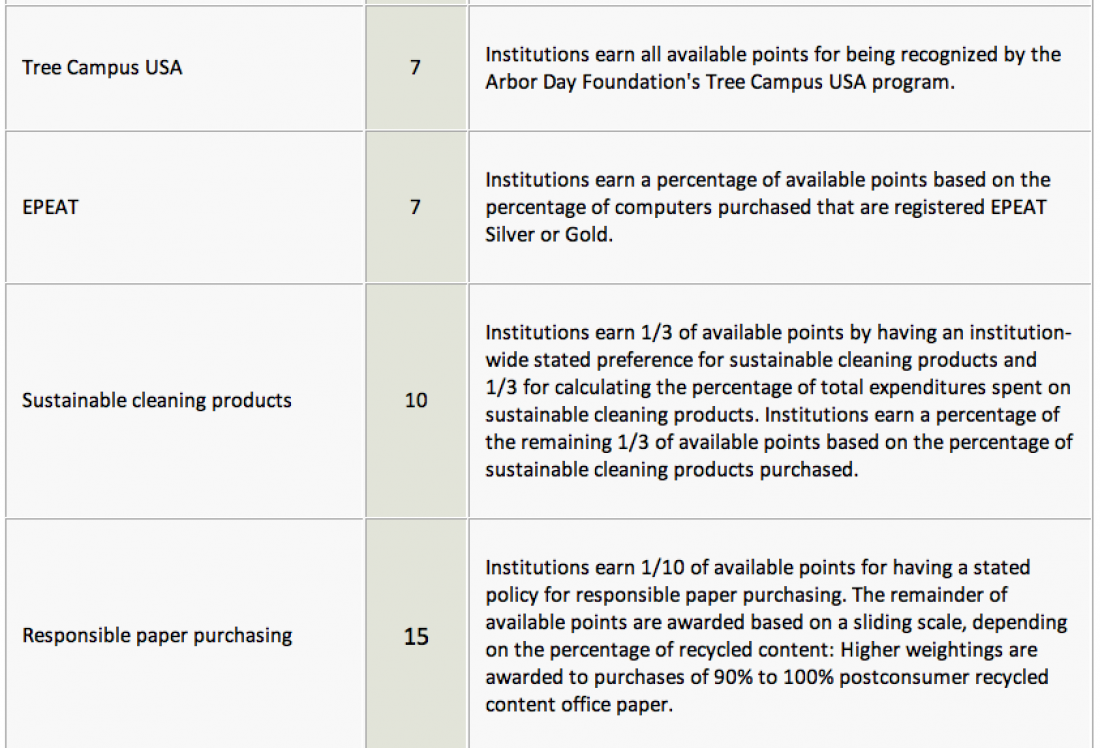
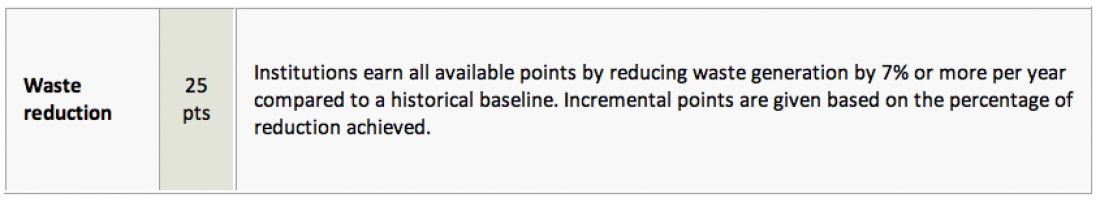 An institution must initially get a detailed accounting of its waste and then identify (and follow through with) actions to reduce it.
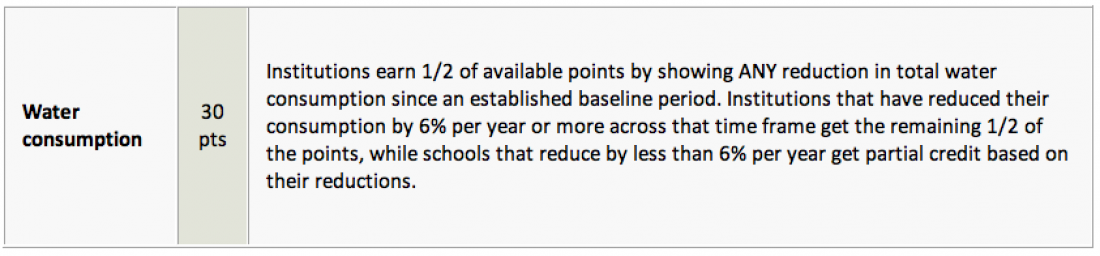 Same process as above.
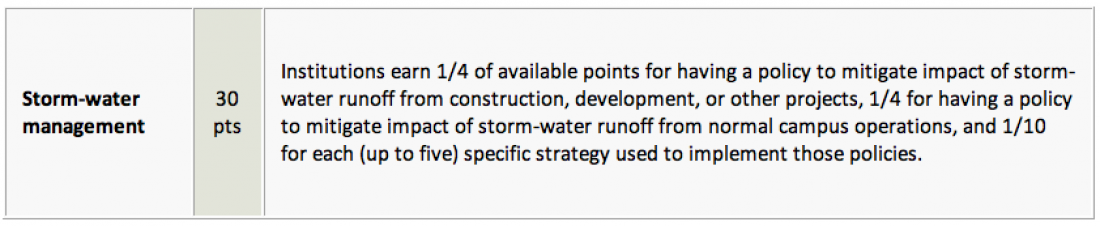
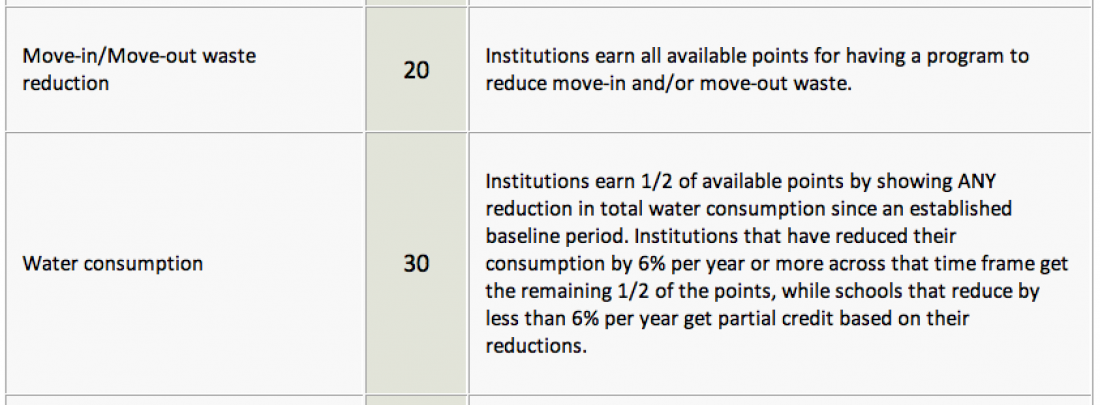
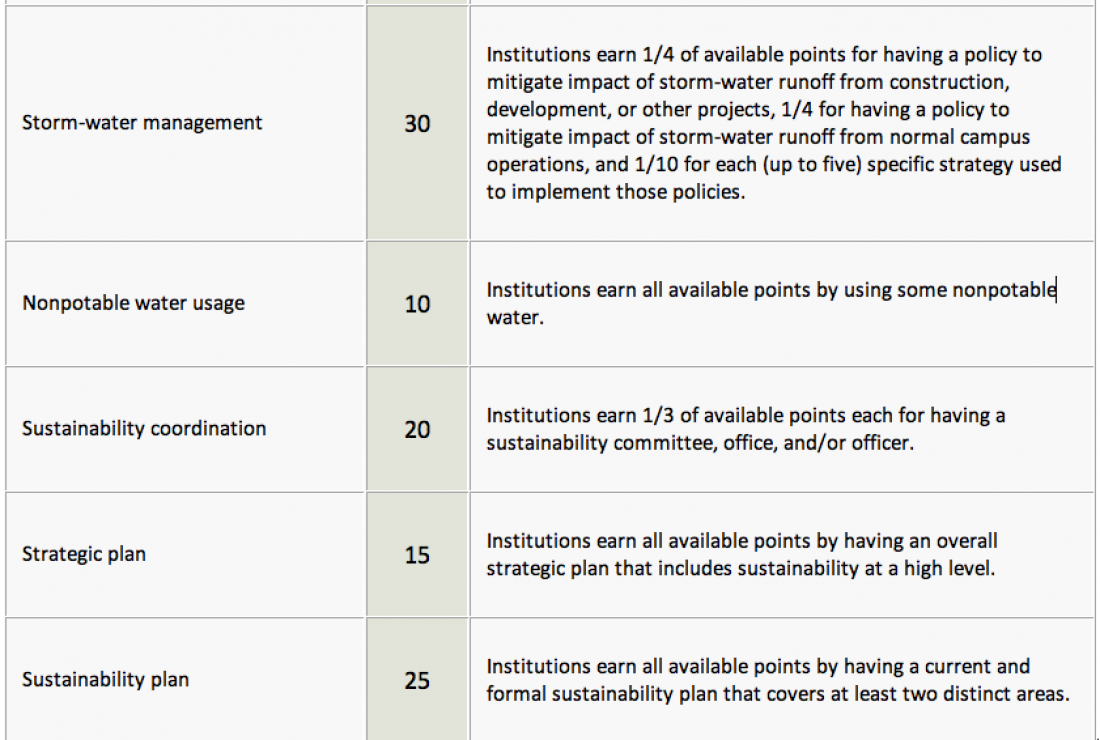
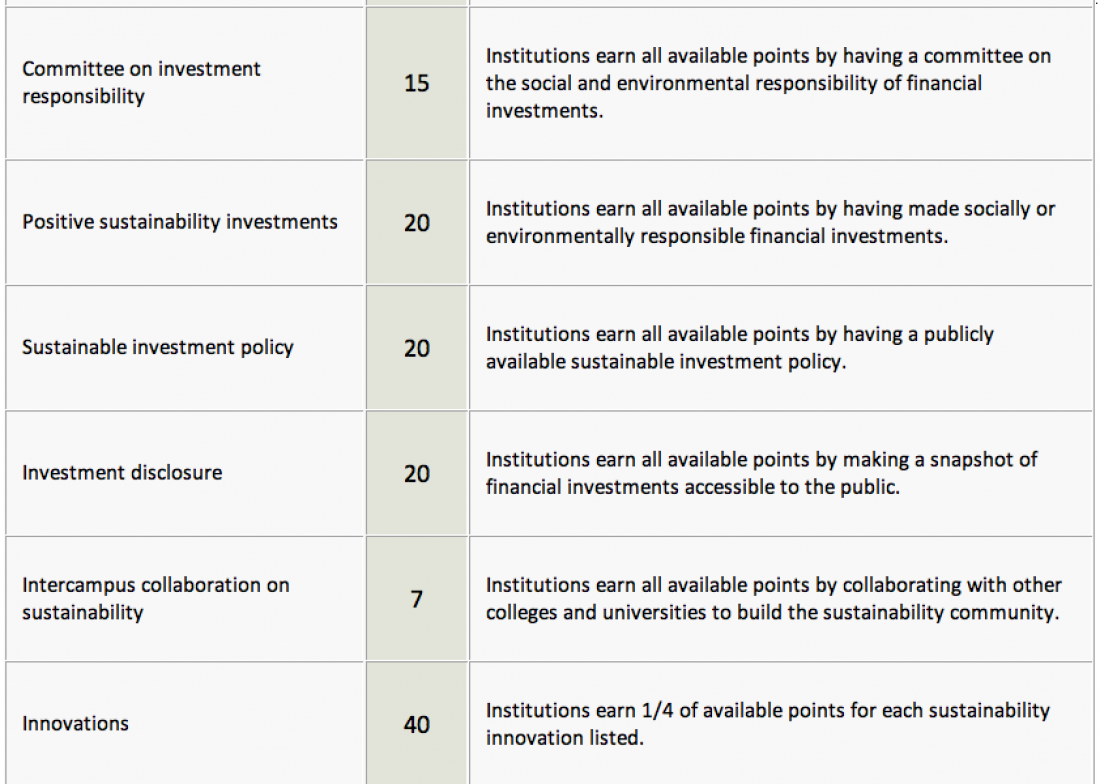
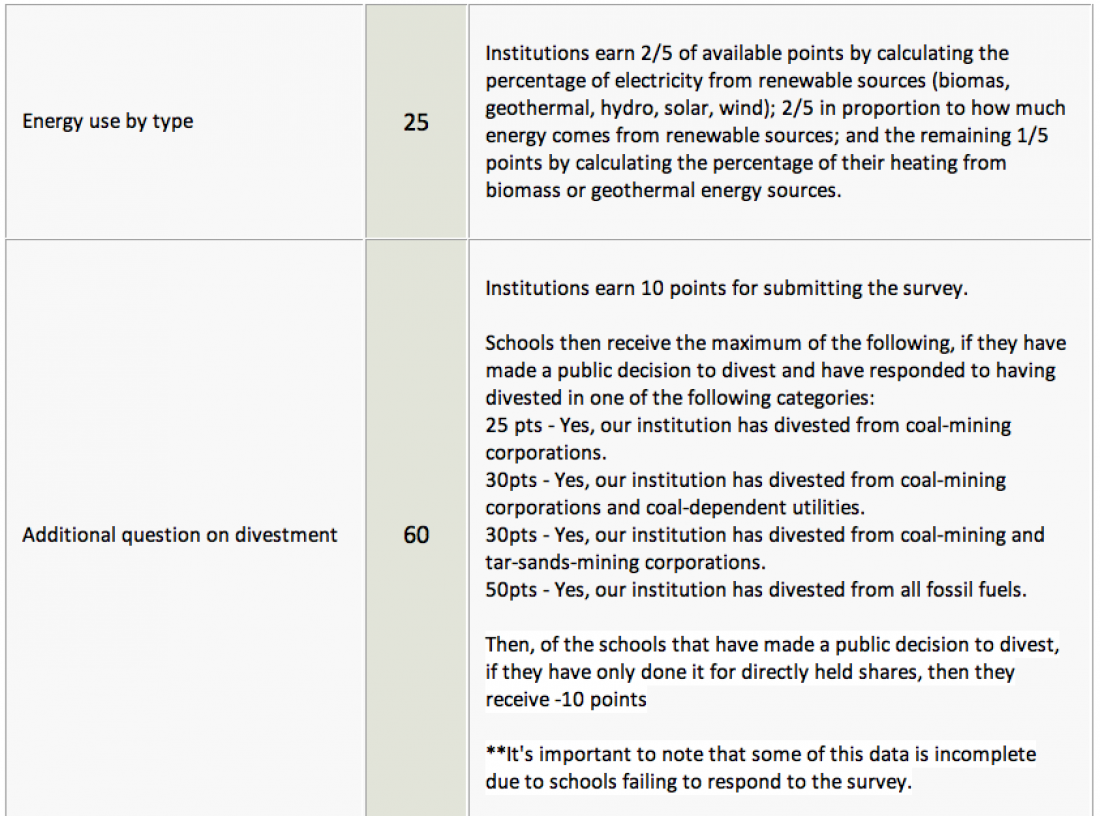
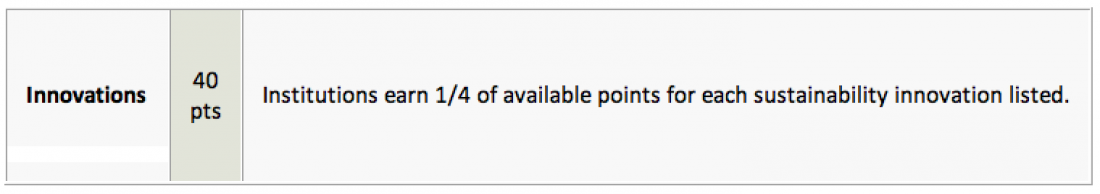 For educational institutions this is one of the most important topics that will define campuses as working sustainability laboratories.
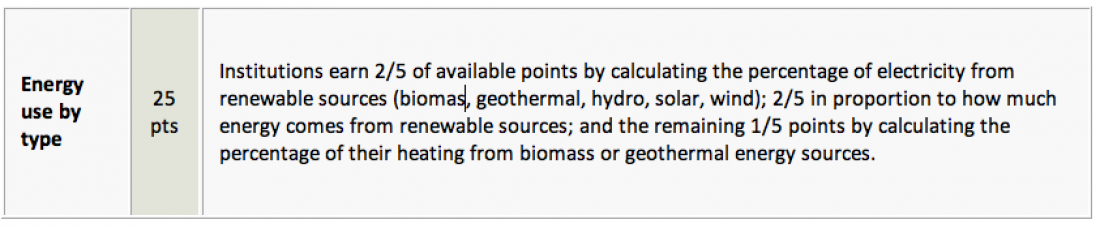 This is self-explanatory but is at least relatively easy in NYC where we can contact the power company to request that they deliver at least a certain portion of our electricity from renewable sources.
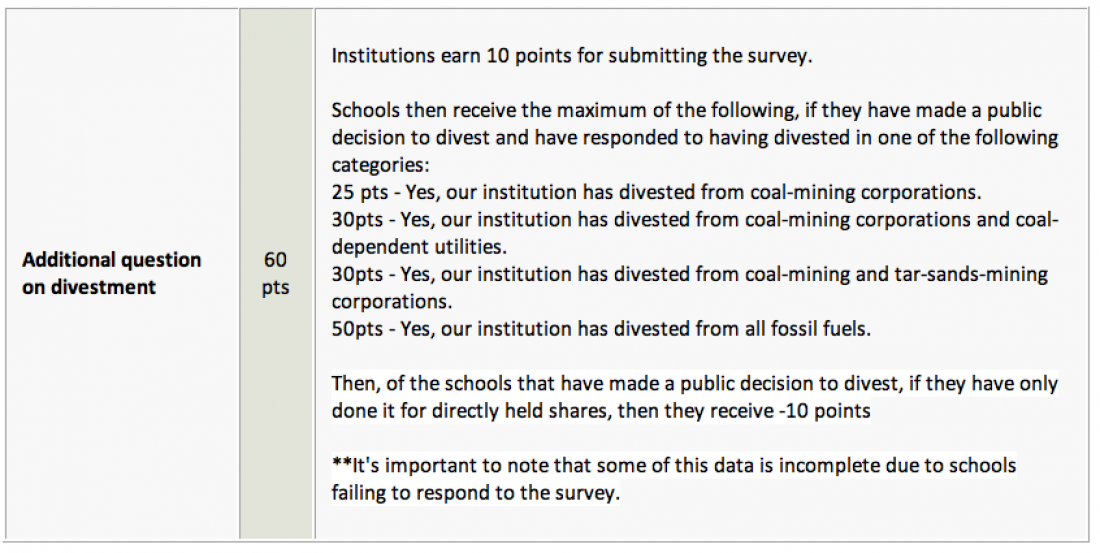 This is by far the highest number of available points and it calls for major action — not just pledges or promises!!


 A photo from a
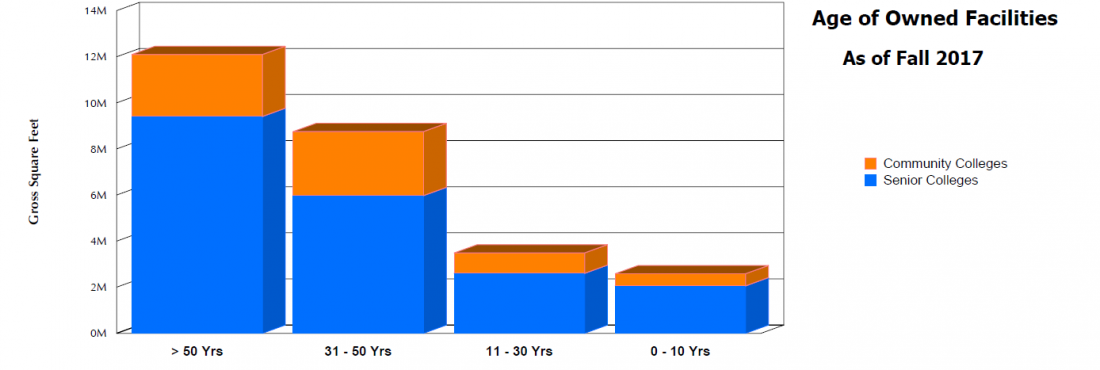
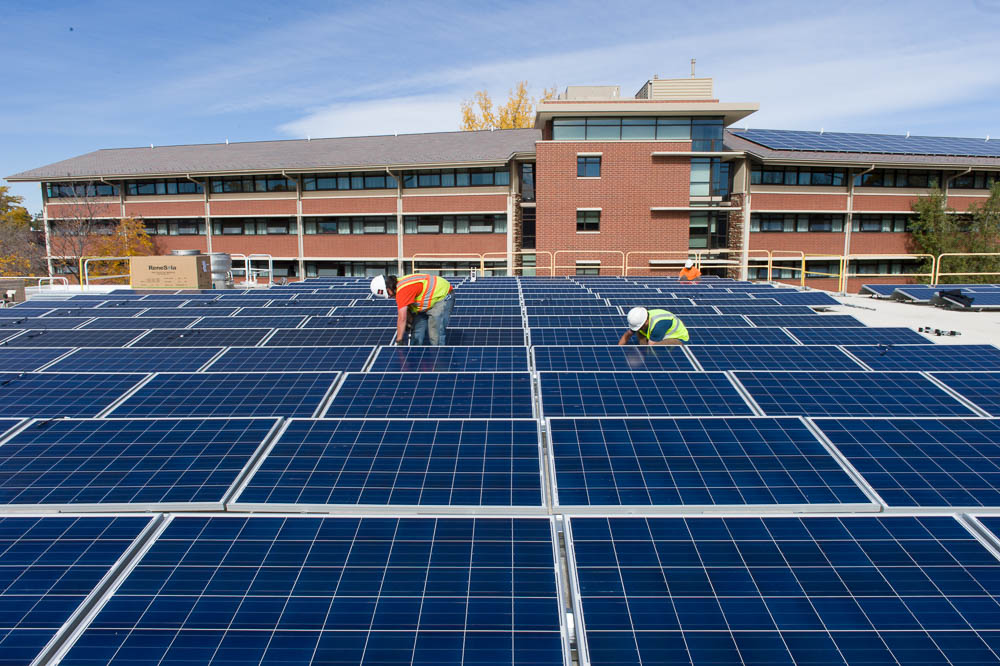

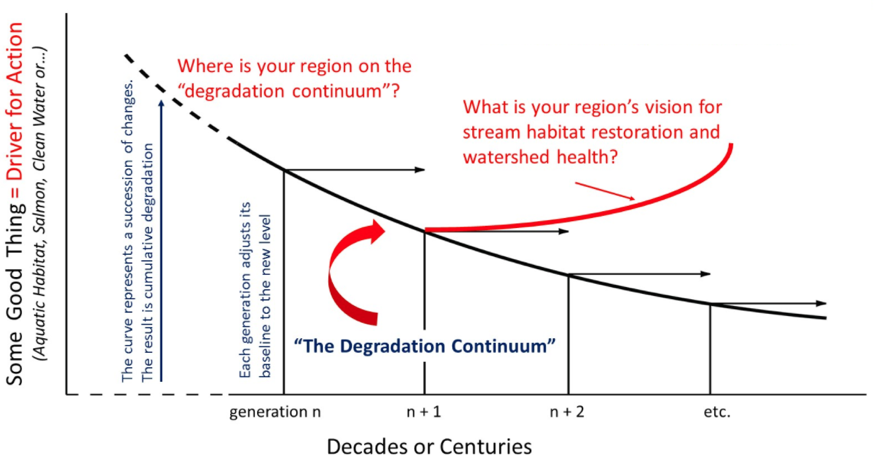
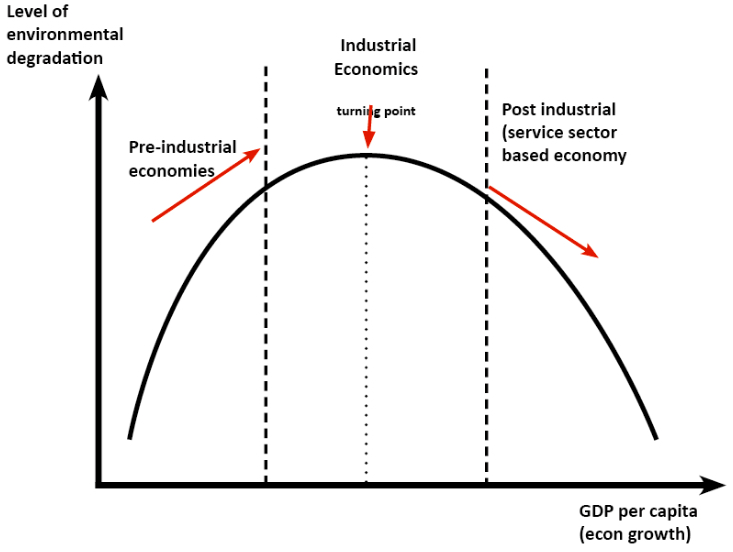 Figure 1 – Graphical representation of the relationship between a nation’s GDP per capita and its respective level of environmental degradation. This relationship demonstrates the Kuznets curve, commonly referred to as the environmental Kuznets curve when applied to this area of study.1
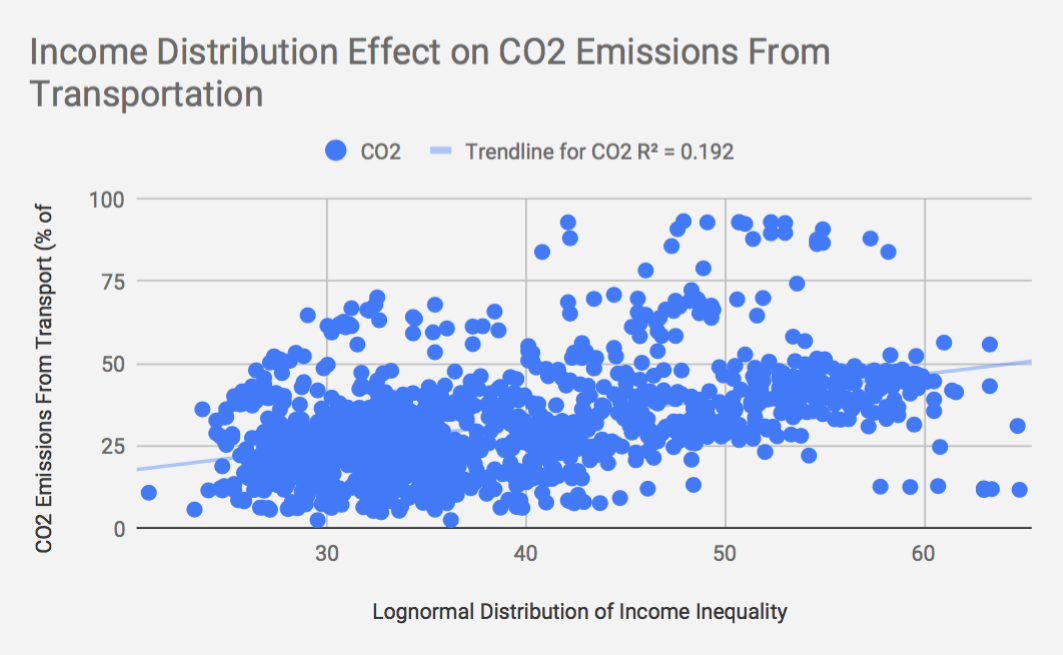
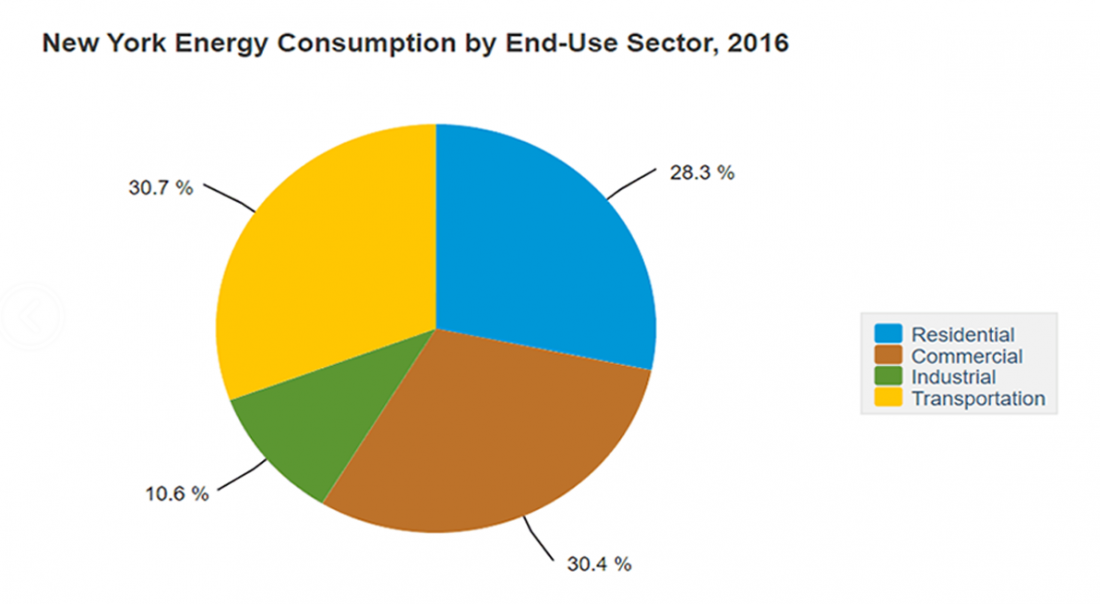

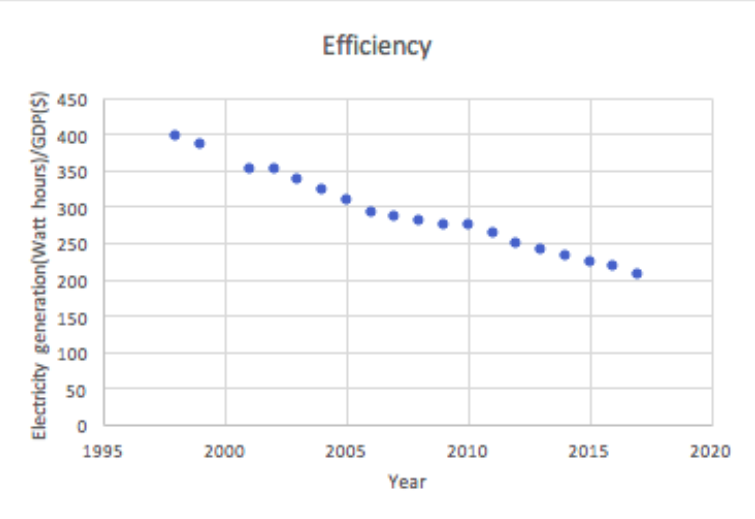
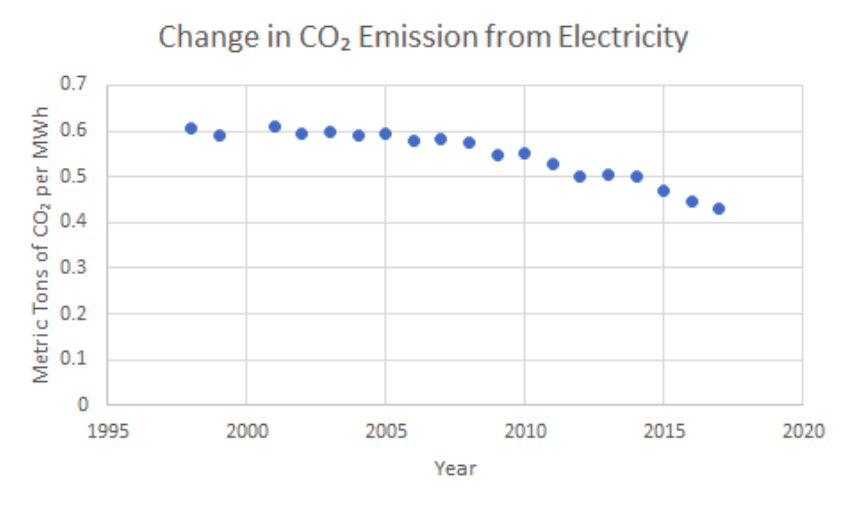 Figure 3 – Ratio of CO2 to Electricity Generation in the US, 1998-2017
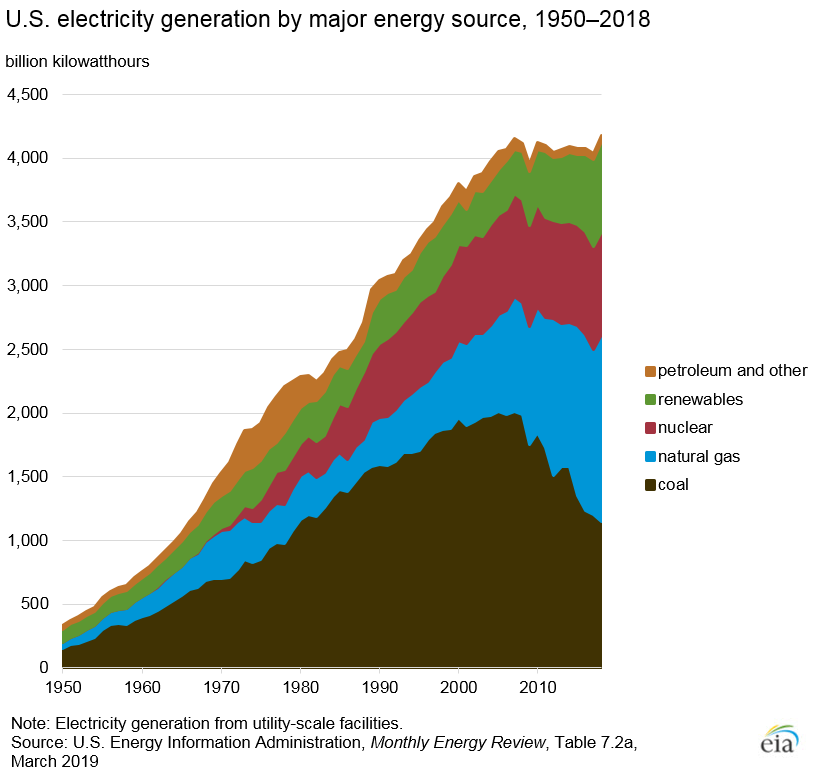 Figure 4 – US electricity generation by major energy source, 1950-2018